Tropical Depression 07A
|
Passive Microwave (PMW) Intensity Information Hurricane Intensity Estimation (HIE) Algorithm Version 9.0 |
Overpass Inten Ring Ring Wind Forecast Final Target
Date Time Score Meaning Pct Diam BTdiff Est Sat Lat Lon Lat Lon Lat Lon
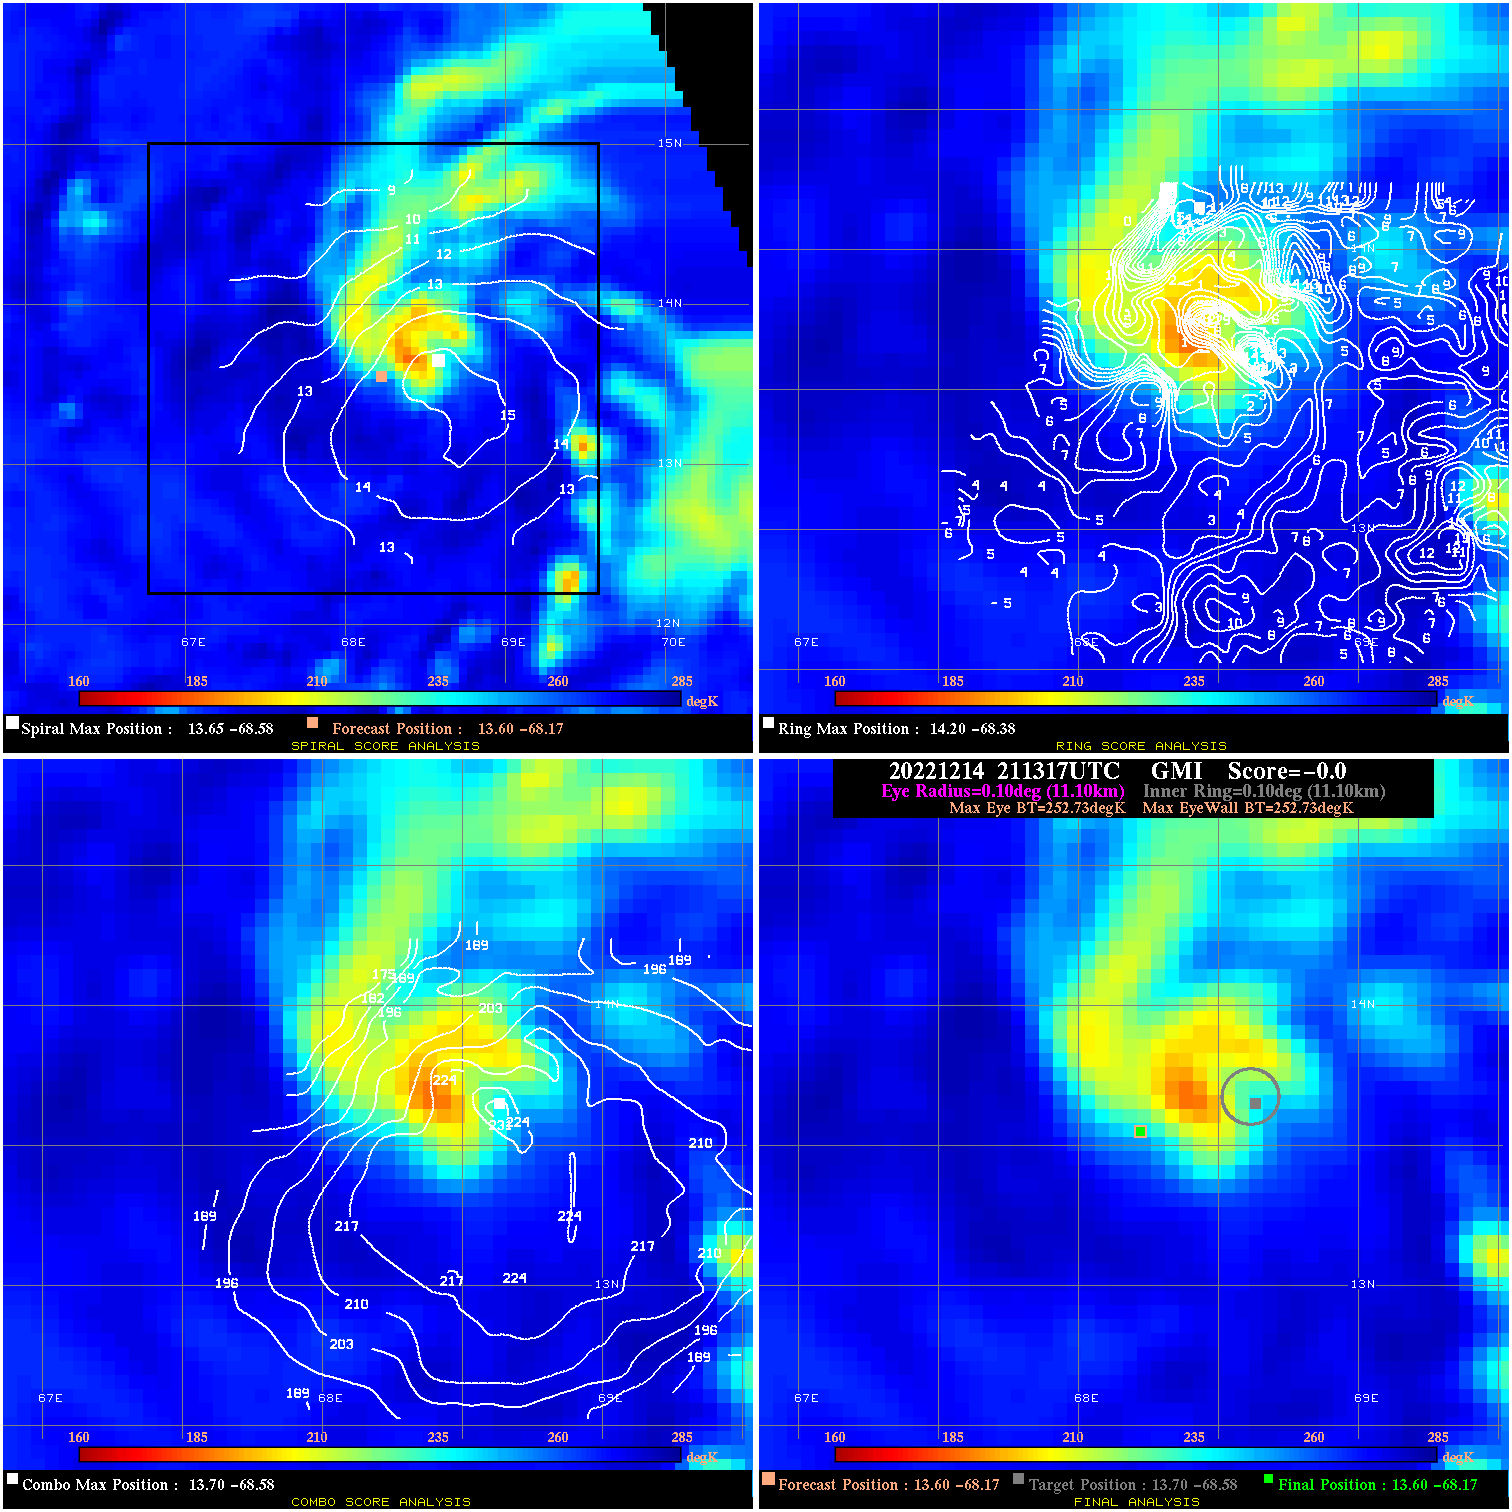
20221214 211317 N/A N/A N/A N/A N/A 35.0 GMI 13.6 -68.2 13.6 -68.2 13.7 -68.6 Analysis Plot
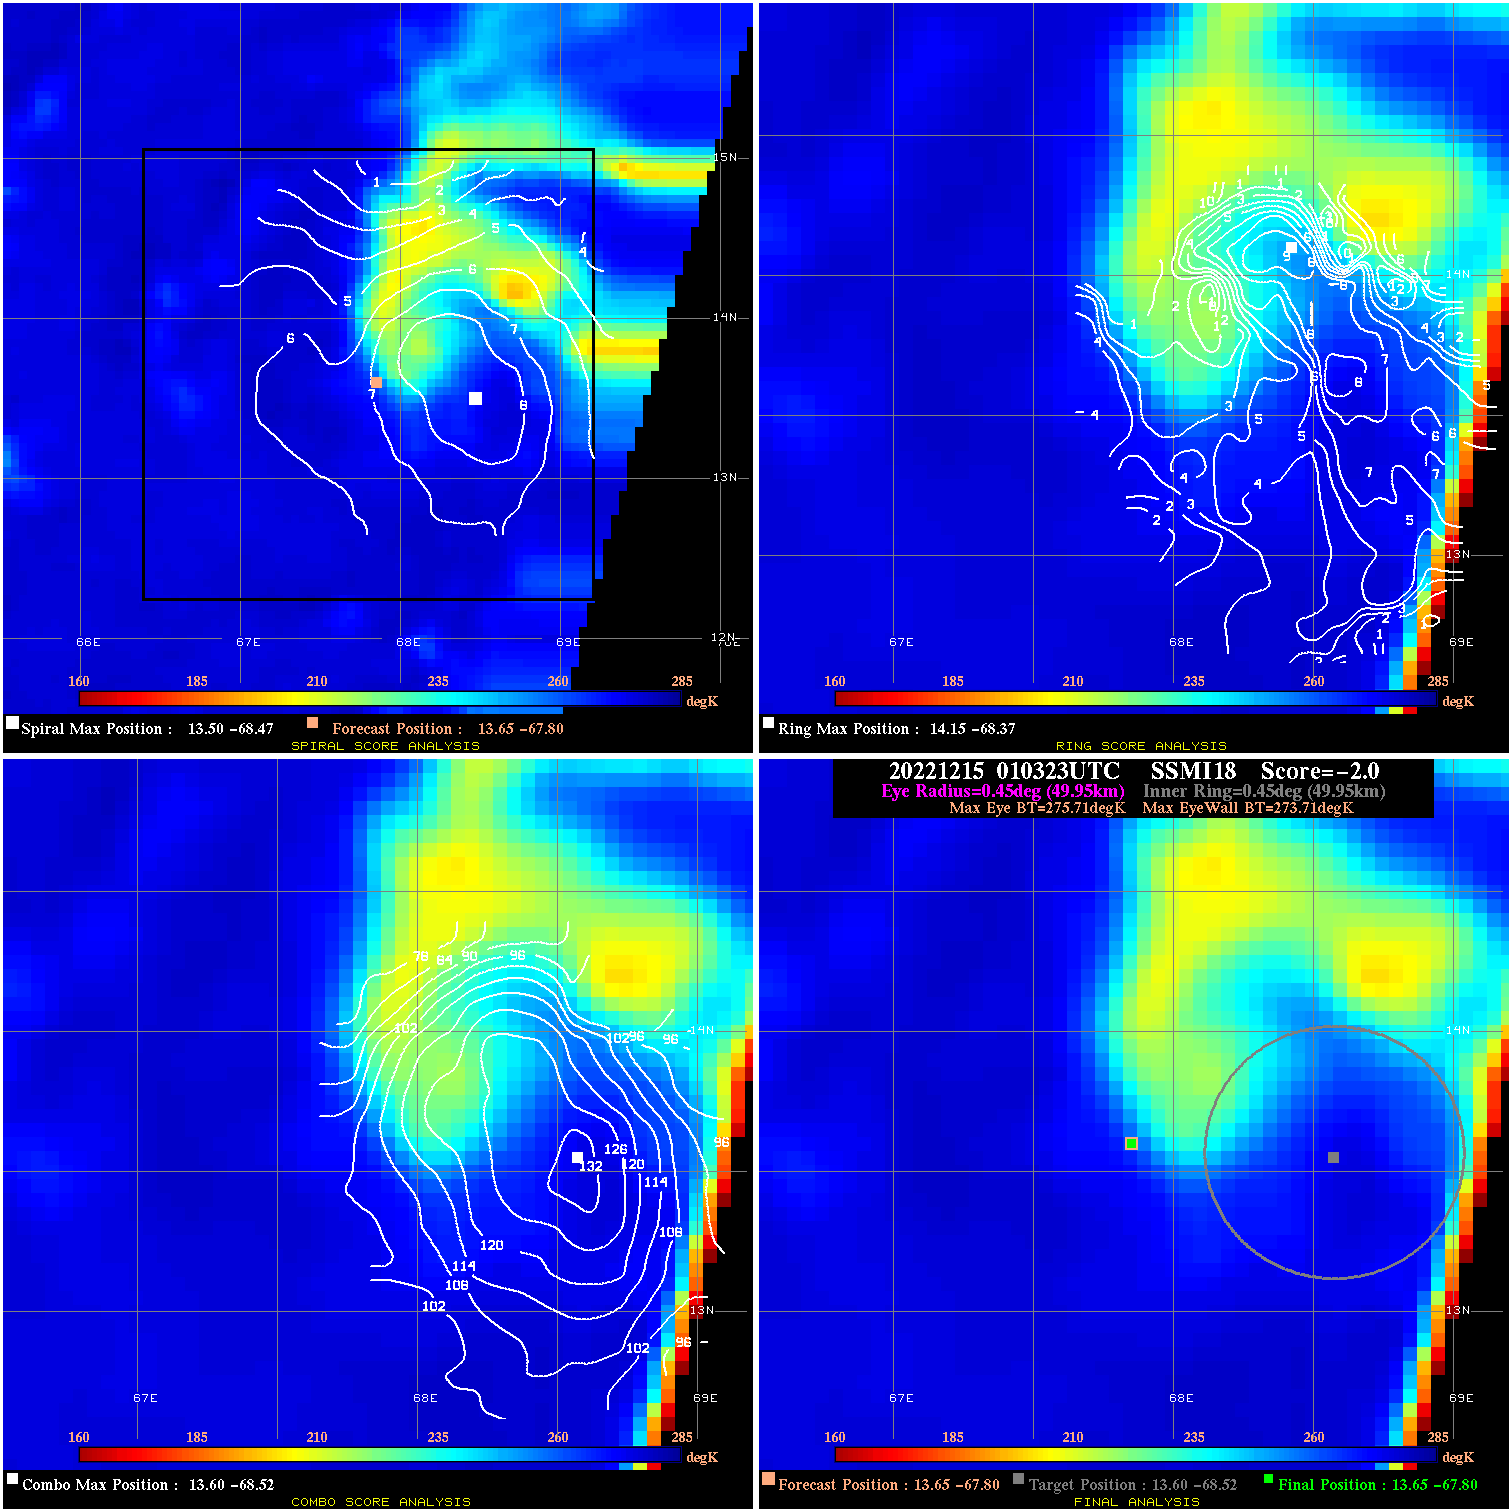
20221215 010323 -2.0 N/A 26.6% 99.99 2.00 35.0 SSMI18 13.6 -67.8 13.6 -67.8 13.6 -68.5 Analysis Plot
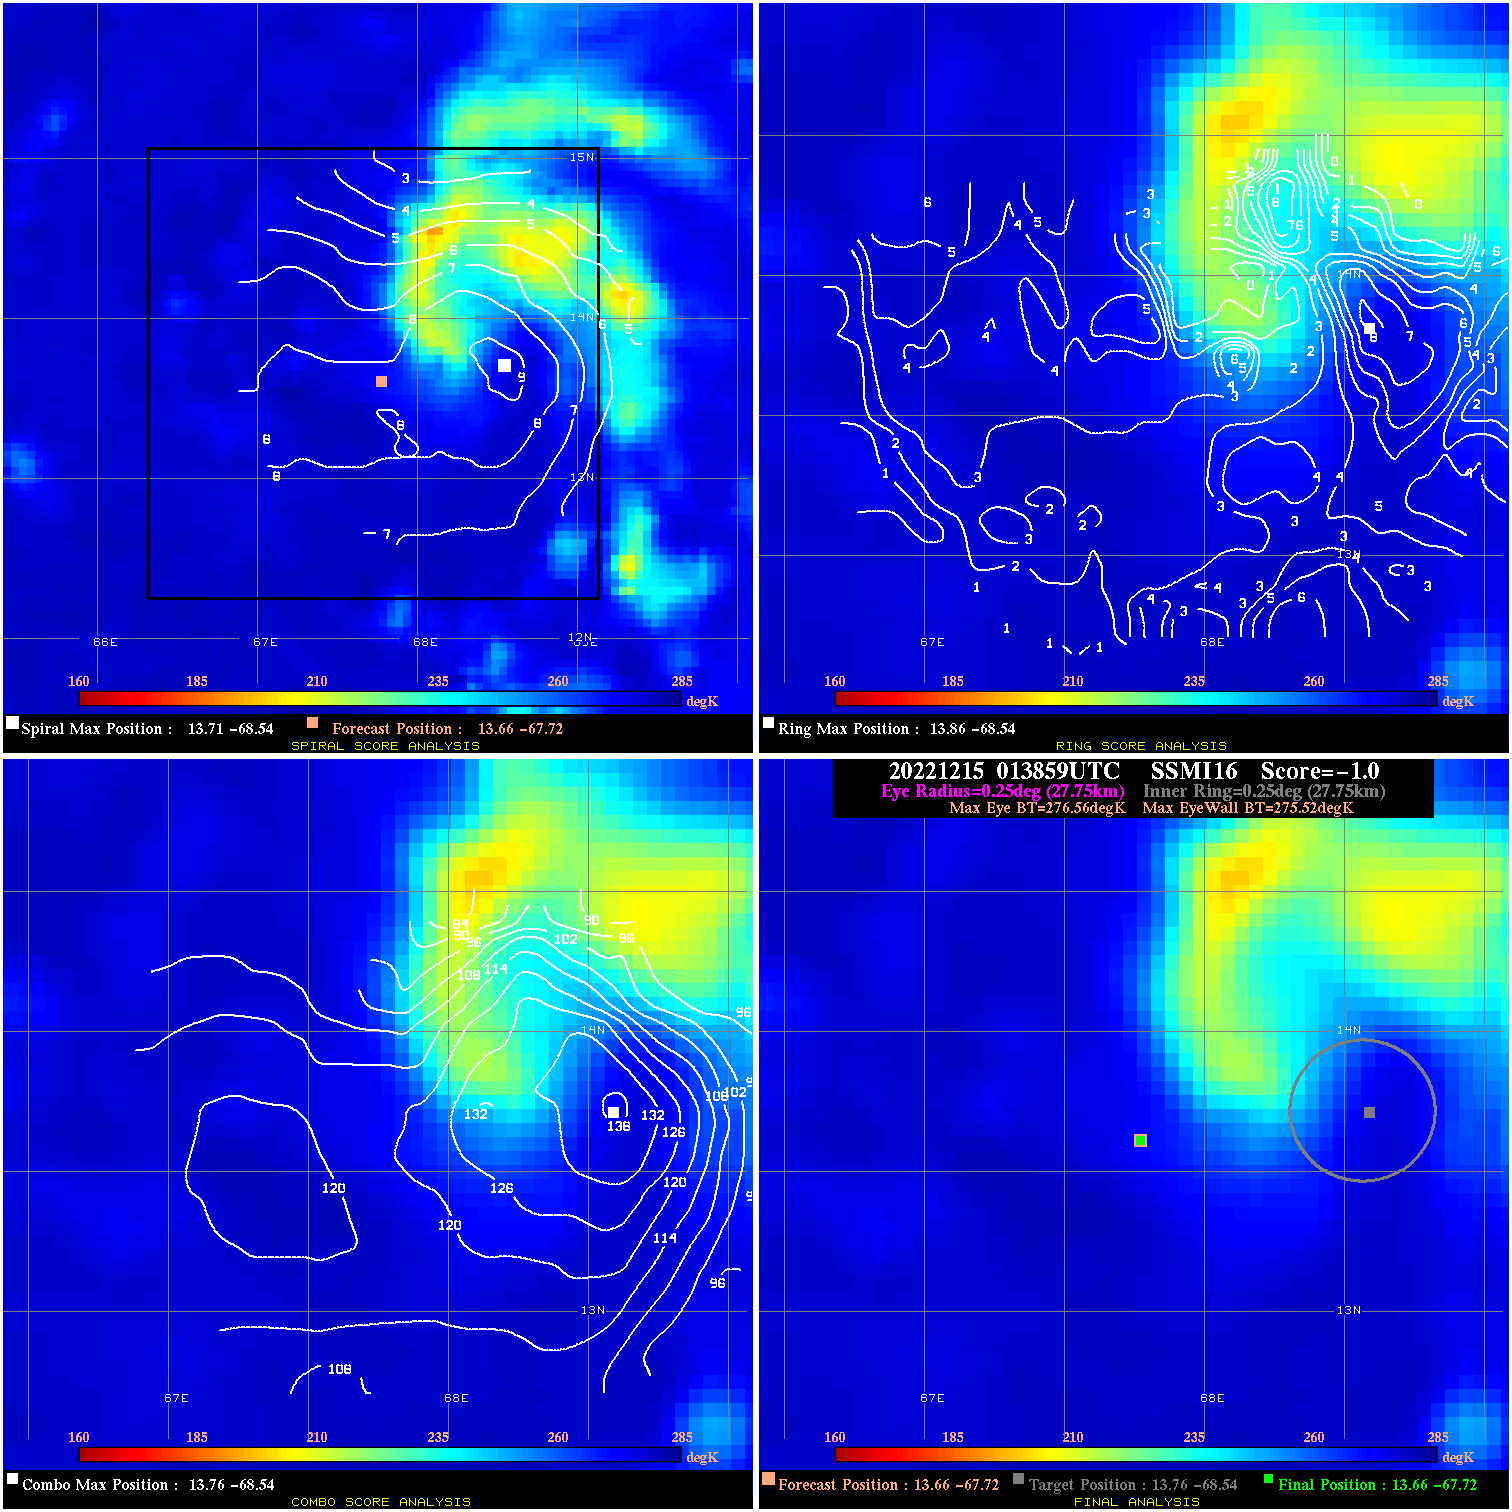
20221215 013859 -1.0 N/A N/A 55.55 1.04 35.0 SSMI16 13.7 -67.7 13.7 -67.7 13.8 -68.5 Analysis Plot
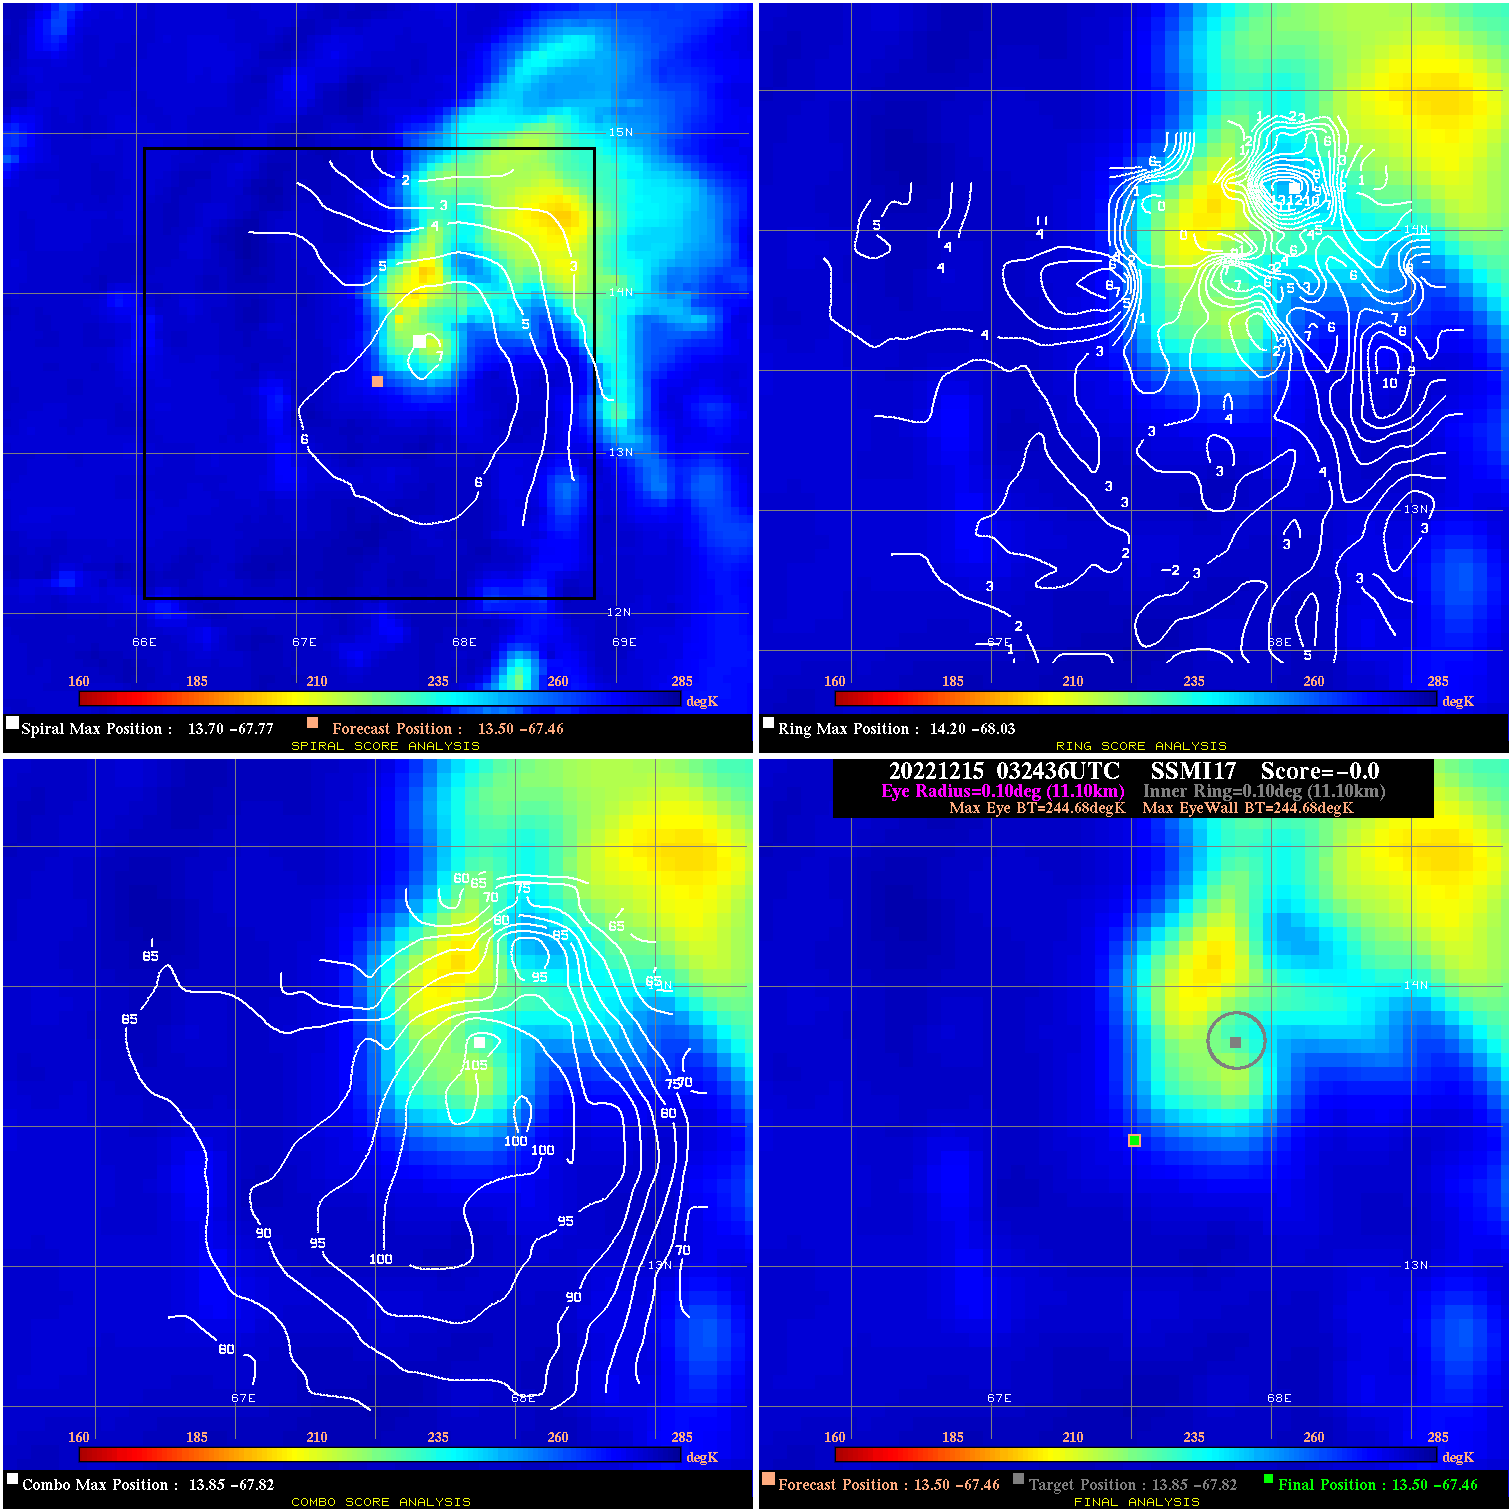
20221215 032436 N/A N/A N/A N/A N/A 35.0 SSMI17 13.5 -67.5 13.5 -67.5 13.9 -67.8 Analysis Plot
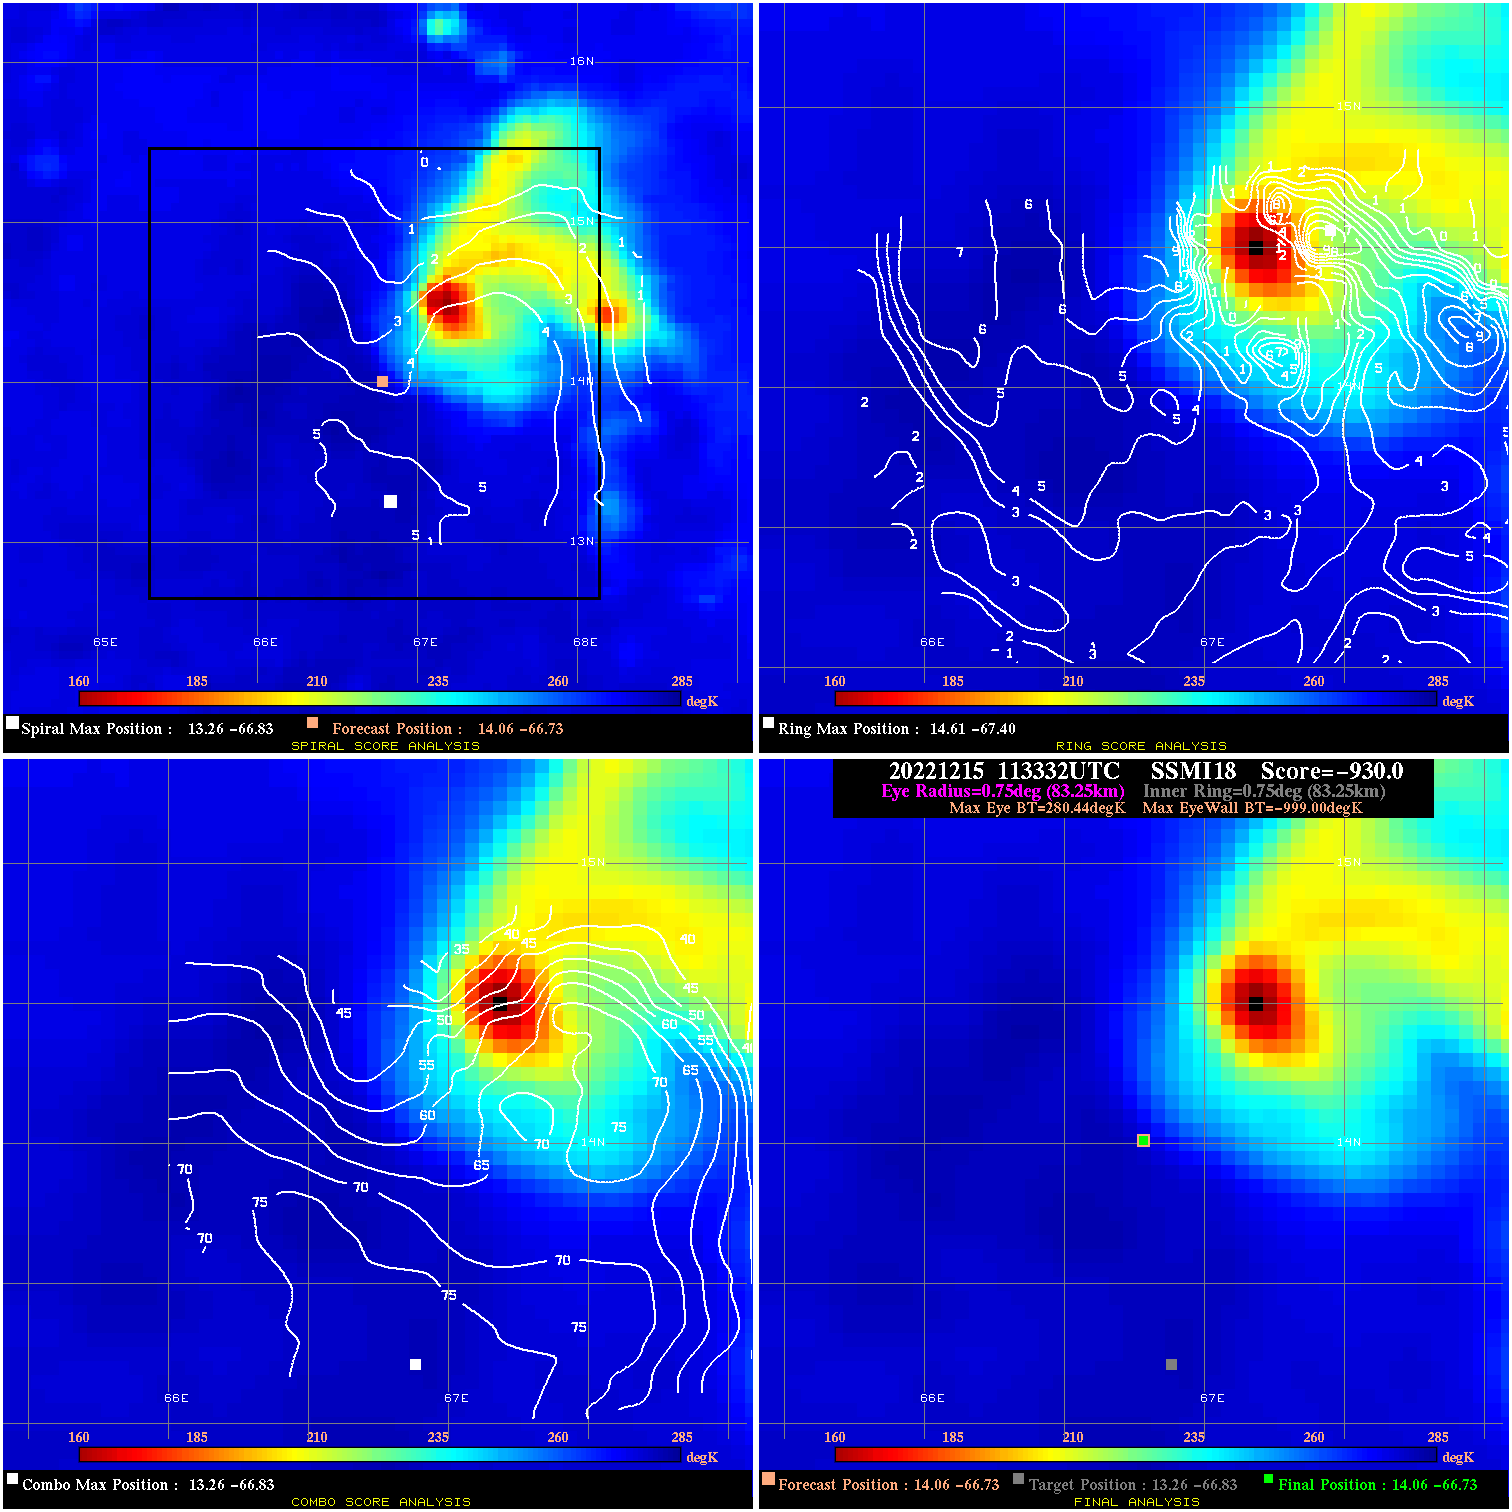
20221215 113332 -930.0 N/A N/A N/A 0.00 45.0 SSMI18 14.1 -66.7 14.1 -66.7 13.3 -66.8 Analysis Plot
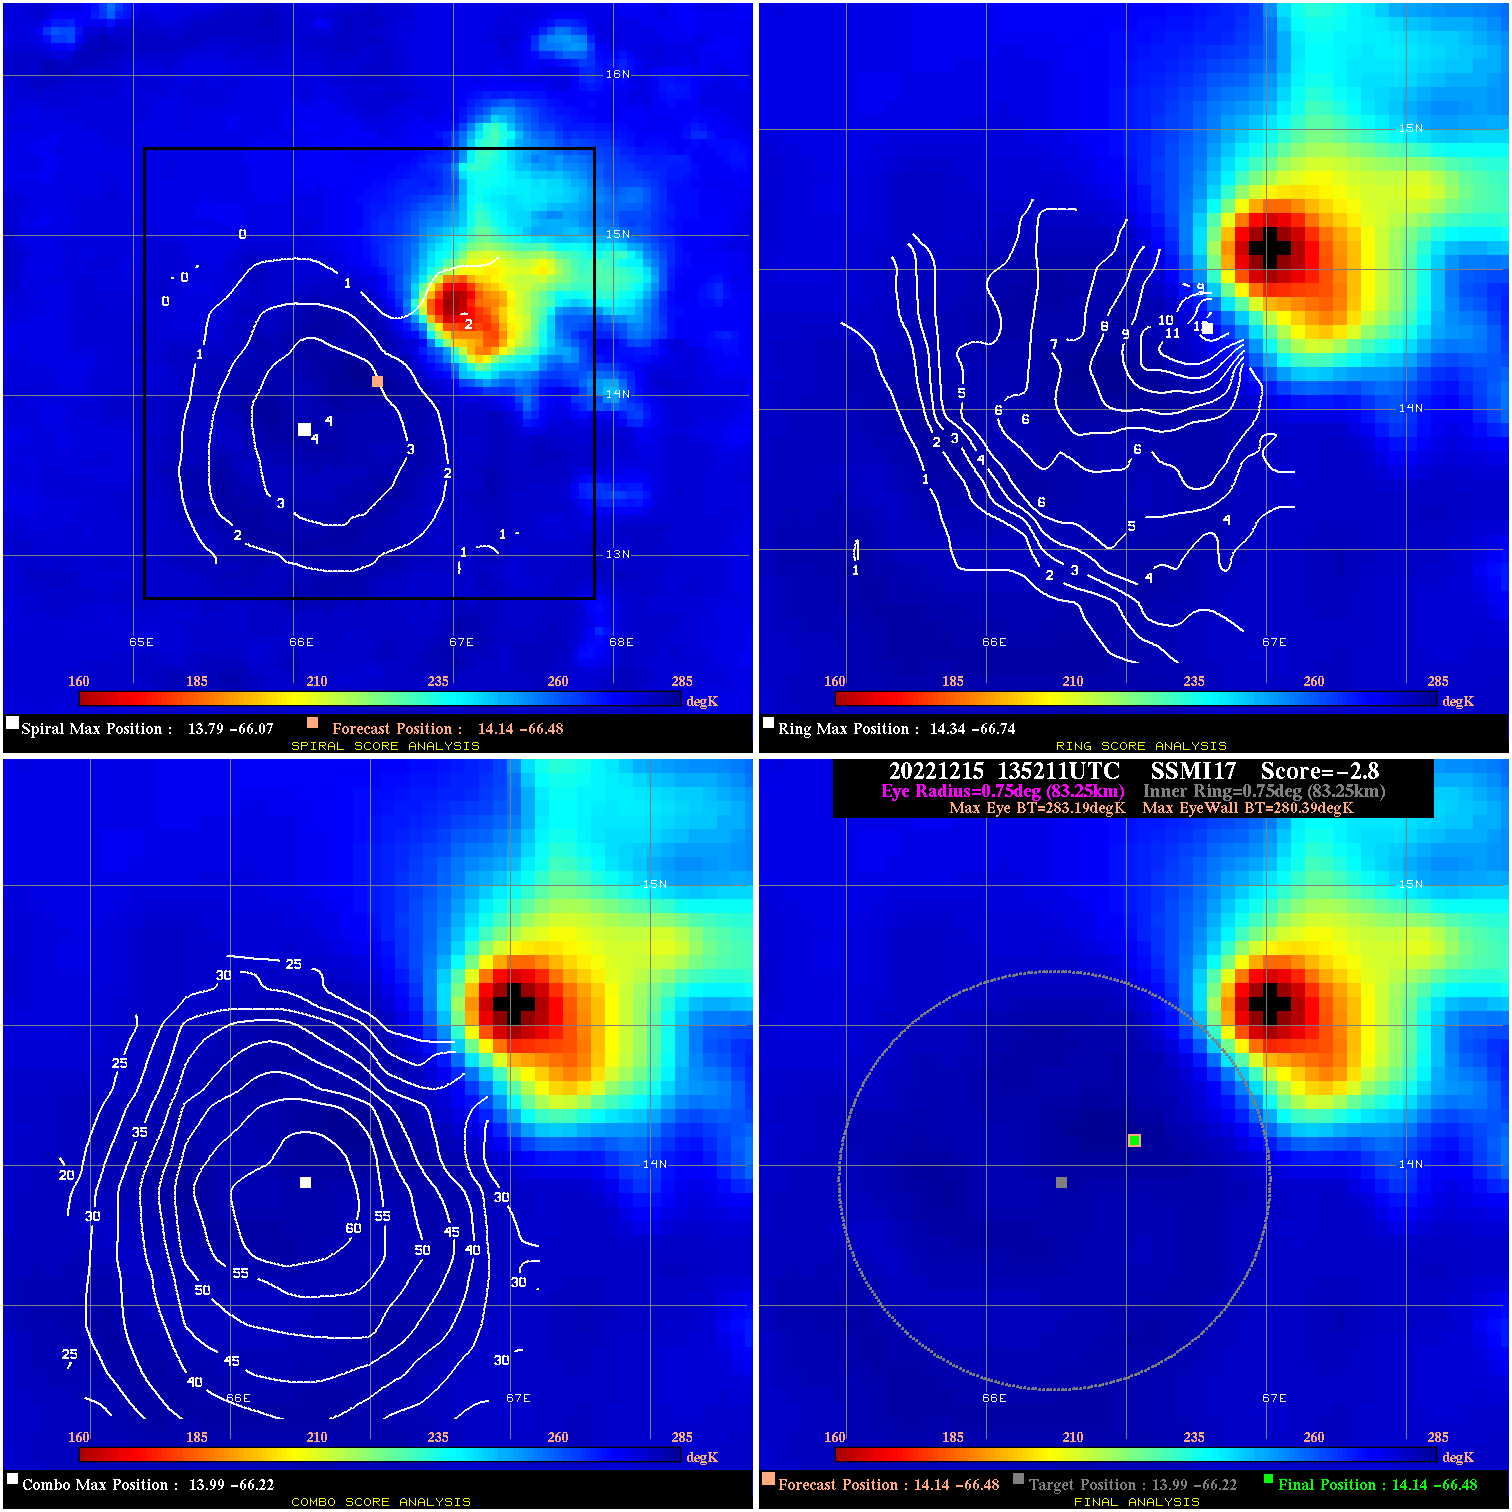
20221215 135211 -2.8 N/A 6.8% 166.65 2.80 45.0 SSMI17 14.1 -66.5 14.1 -66.5 14.0 -66.2 Analysis Plot
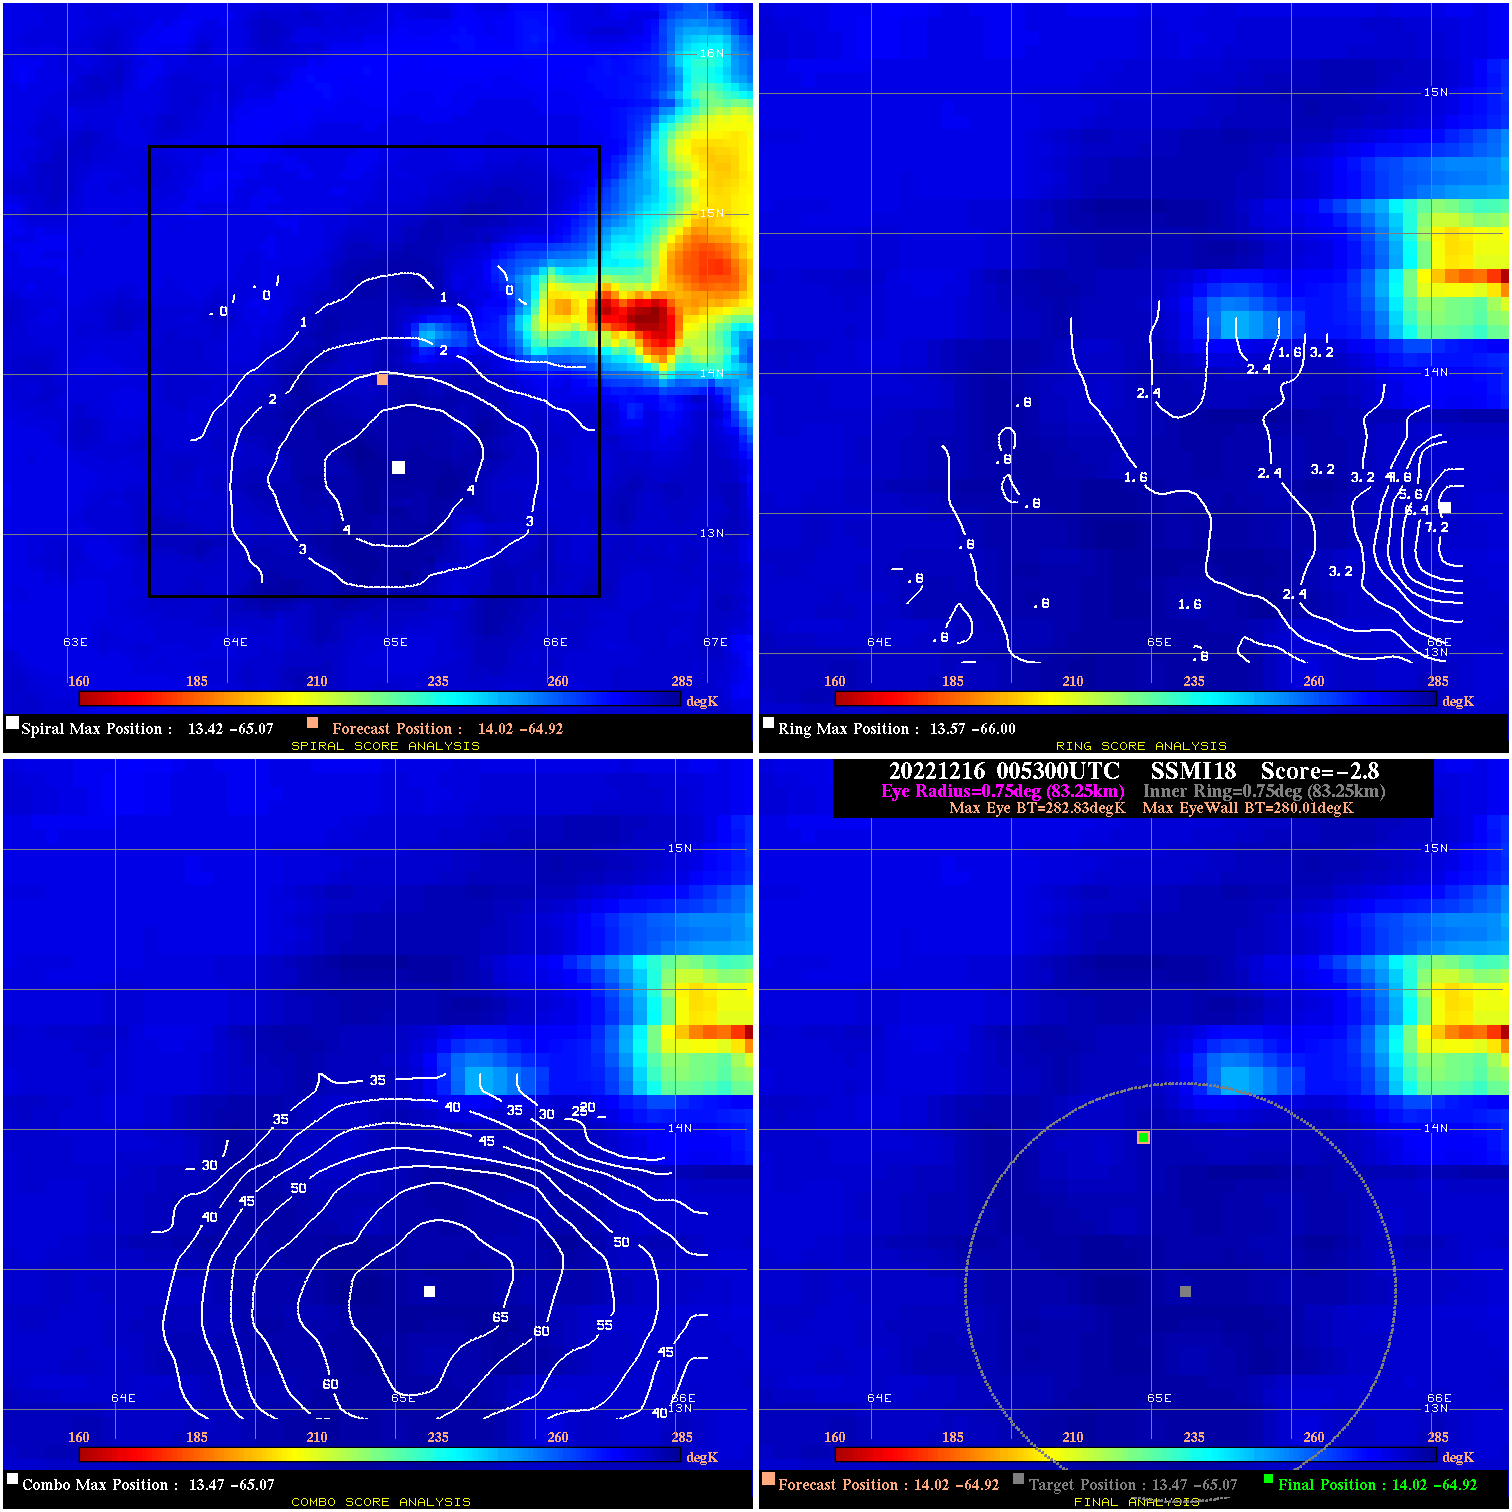
20221216 005300 -2.8 N/A N/A 166.65 2.82 35.0 SSMI18 14.0 -64.9 14.0 -64.9 13.5 -65.1 Analysis Plot
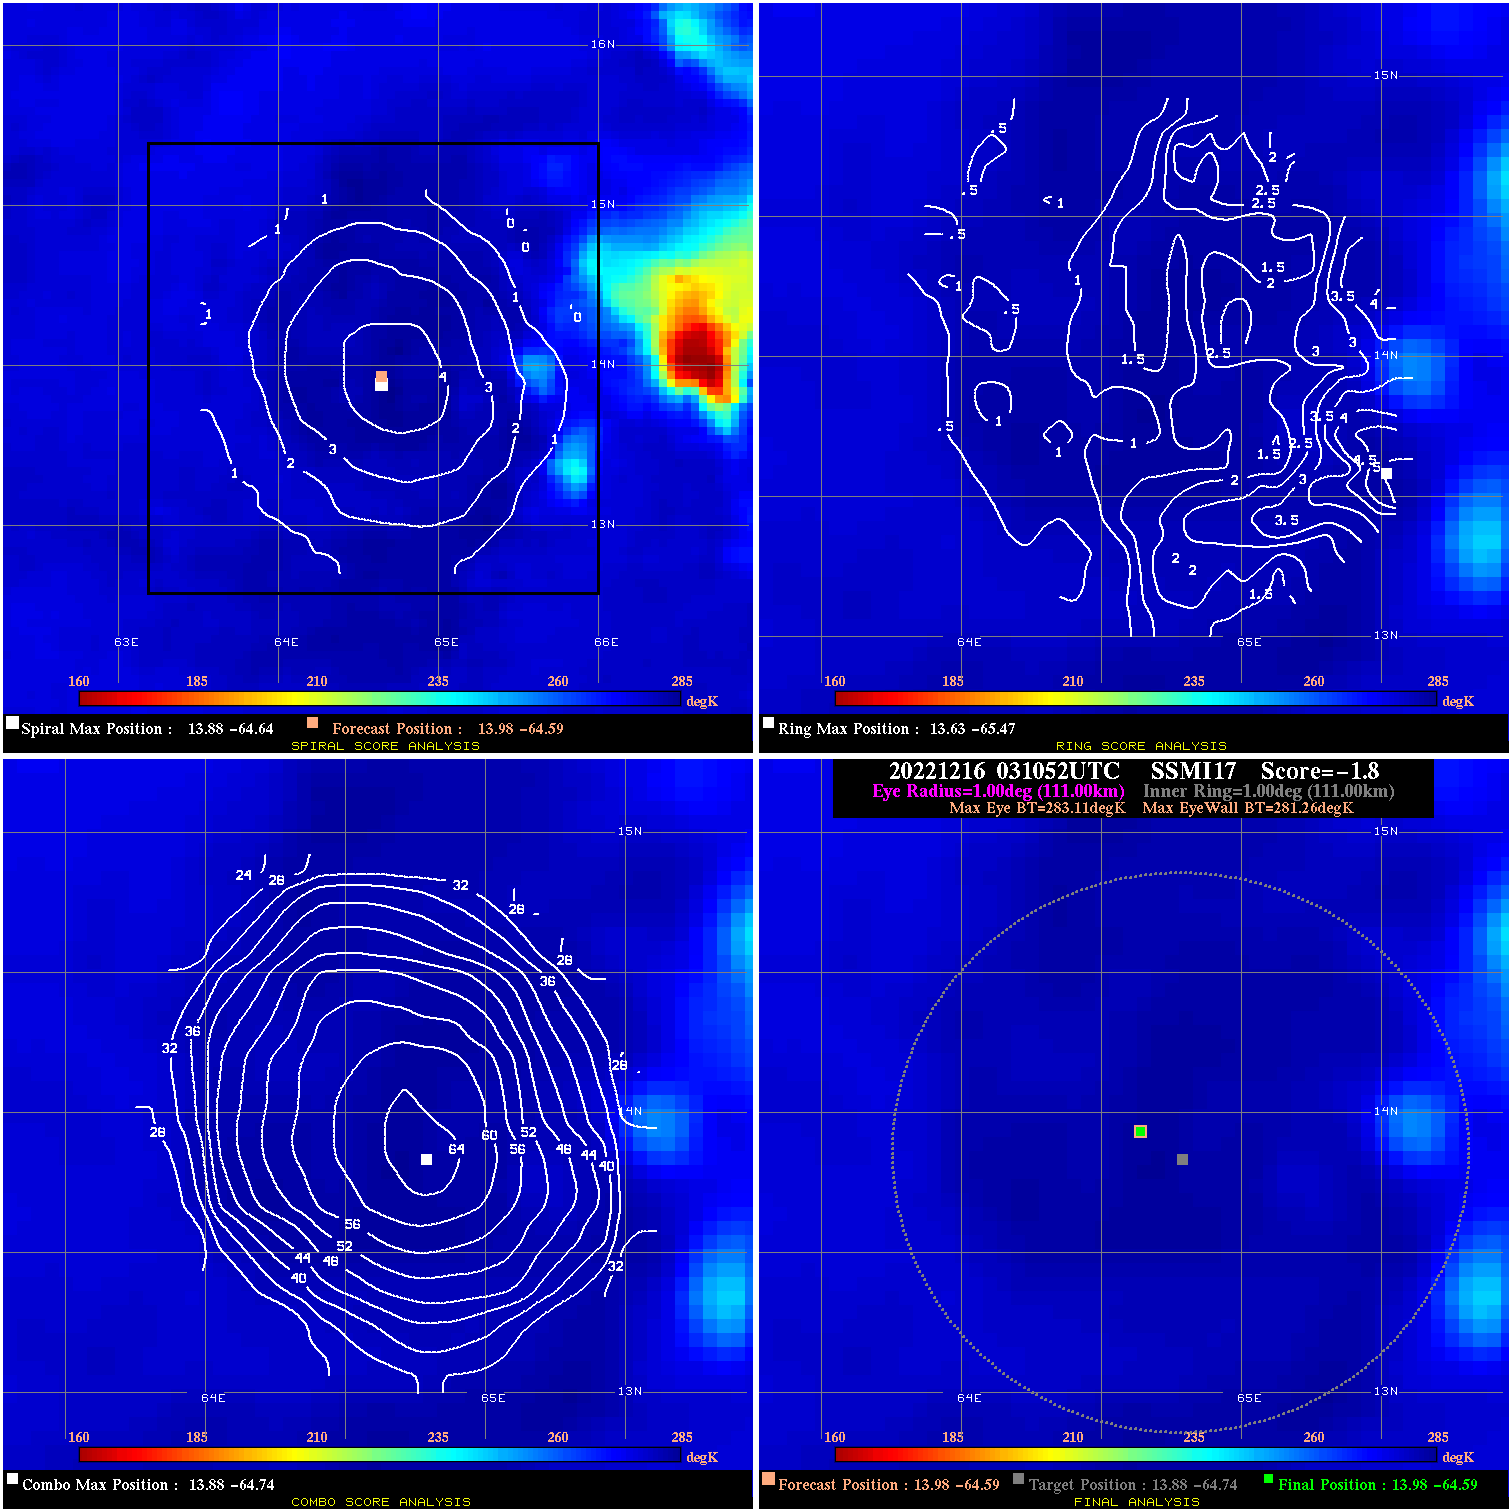
20221216 031052 -1.8 N/A N/A 222.20 1.85 35.0 SSMI17 14.0 -64.6 14.0 -64.6 13.9 -64.7 Analysis Plot
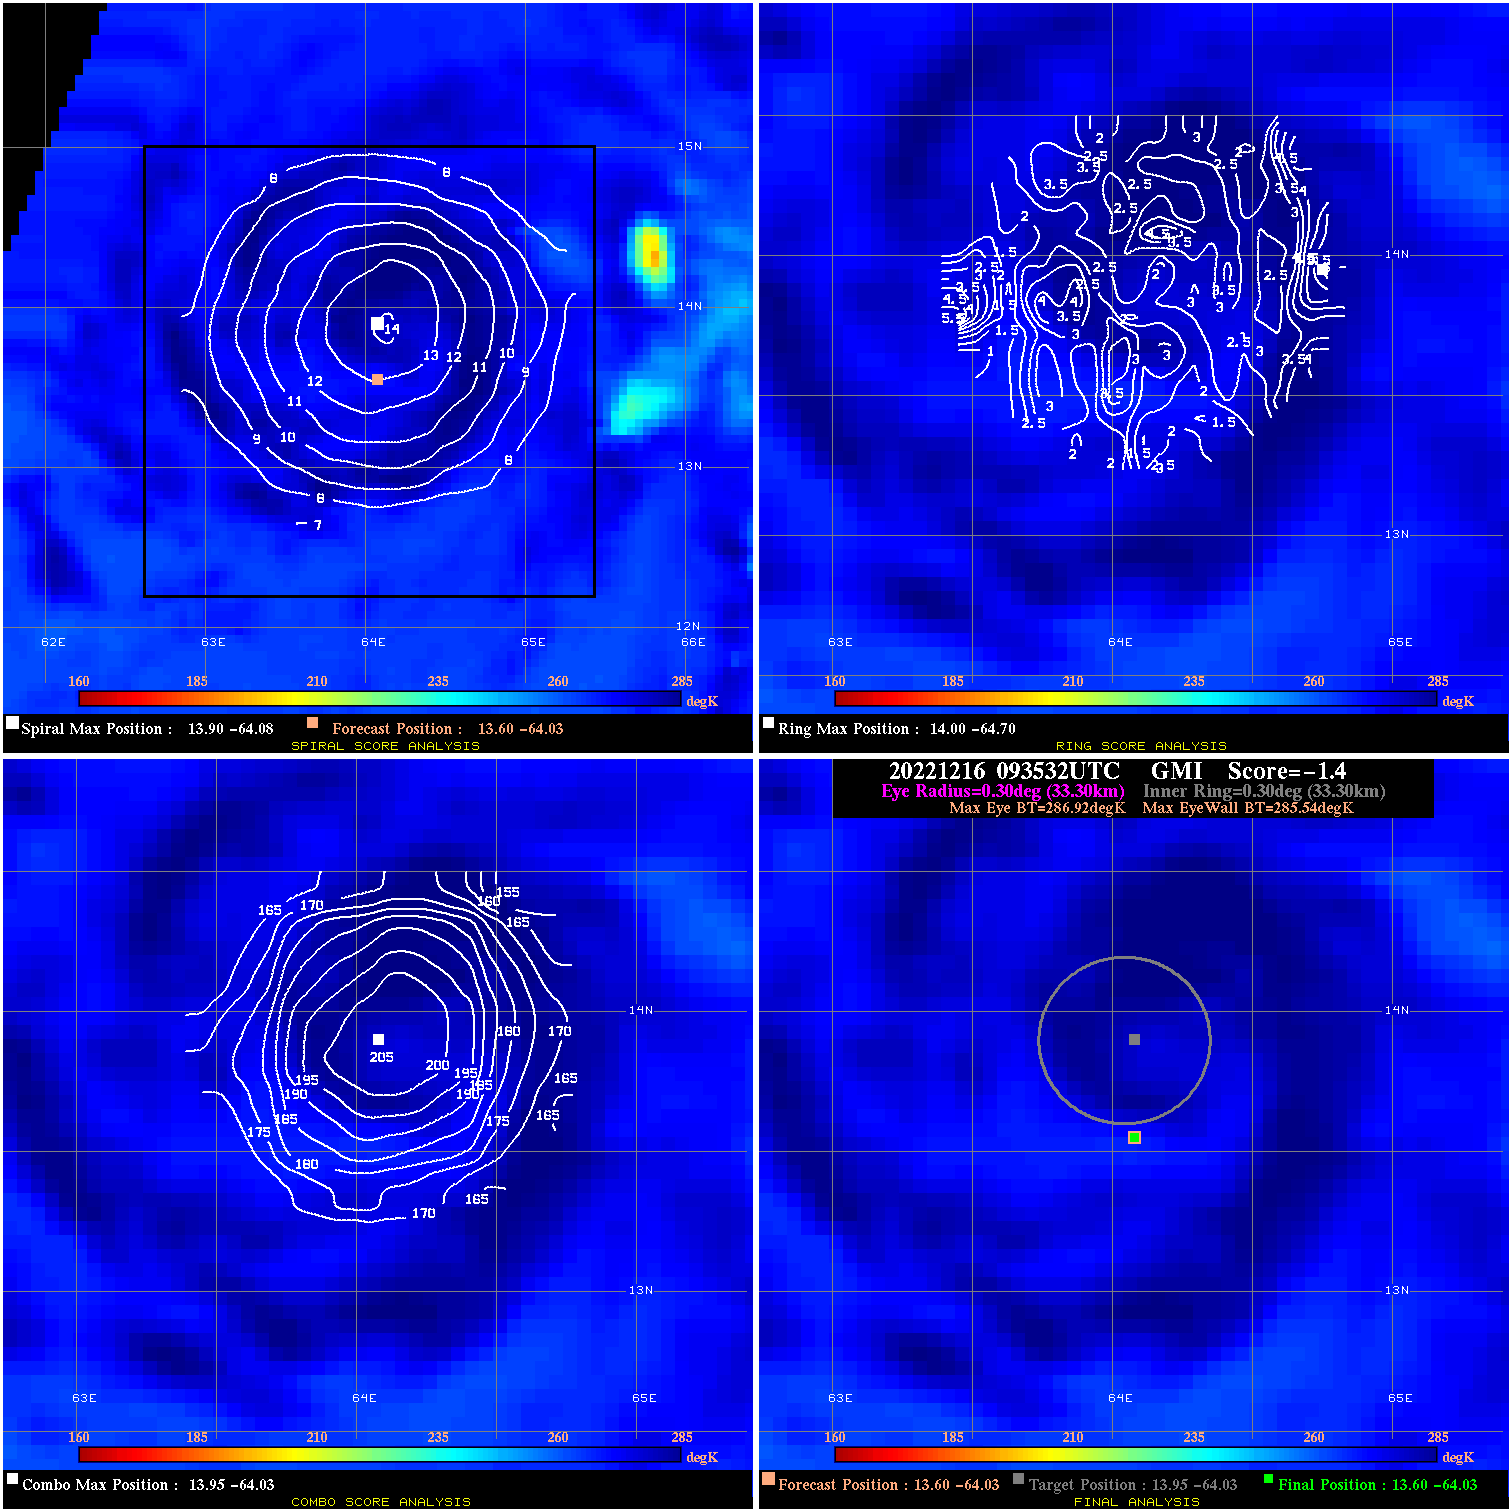
20221216 093532 -1.4 N/A N/A 66.66 1.38 35.0 GMI 13.6 -64.0 13.6 -64.0 13.9 -64.0 Analysis Plot
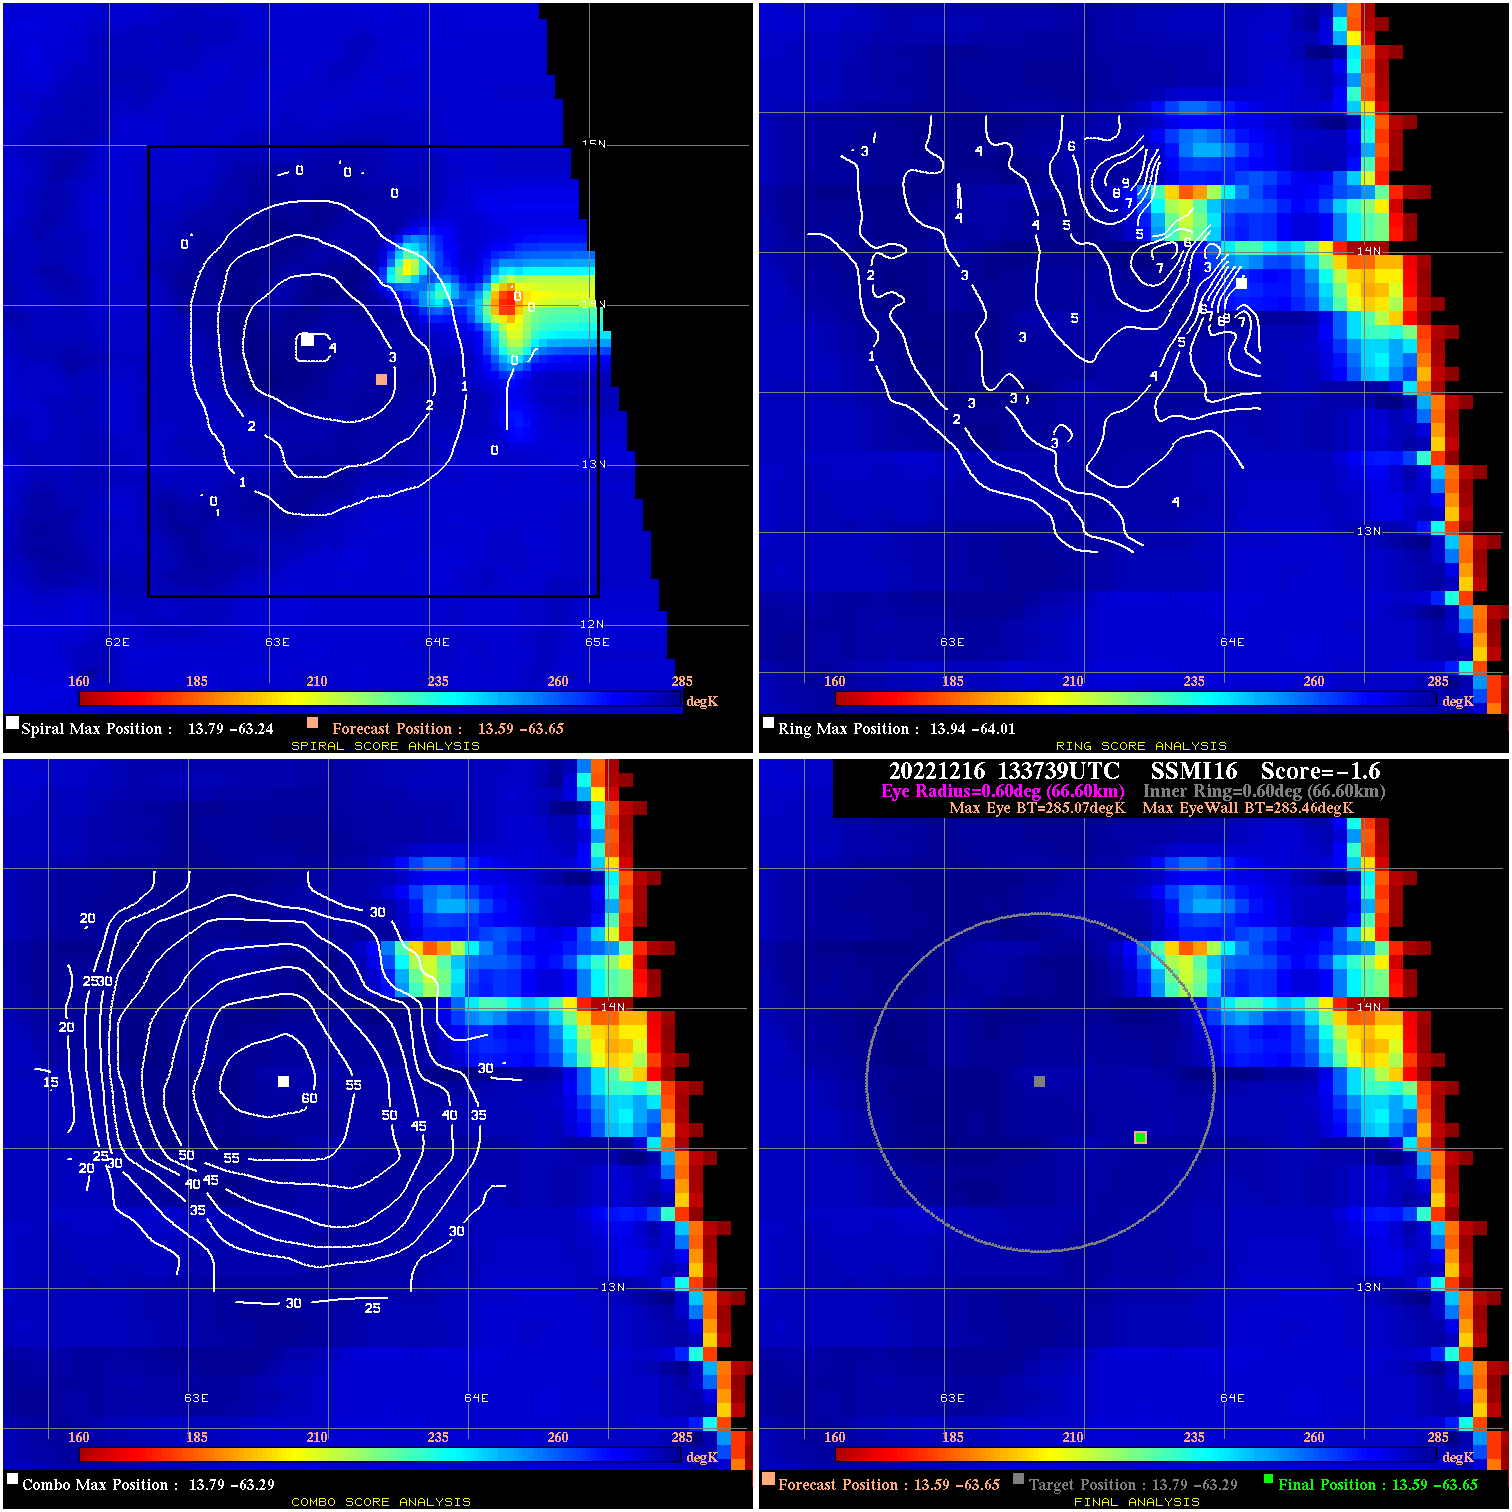
20221216 133739 -1.6 N/A N/A 133.32 1.61 35.0 SSMI16 13.6 -63.7 13.6 -63.7 13.8 -63.3 Analysis Plot
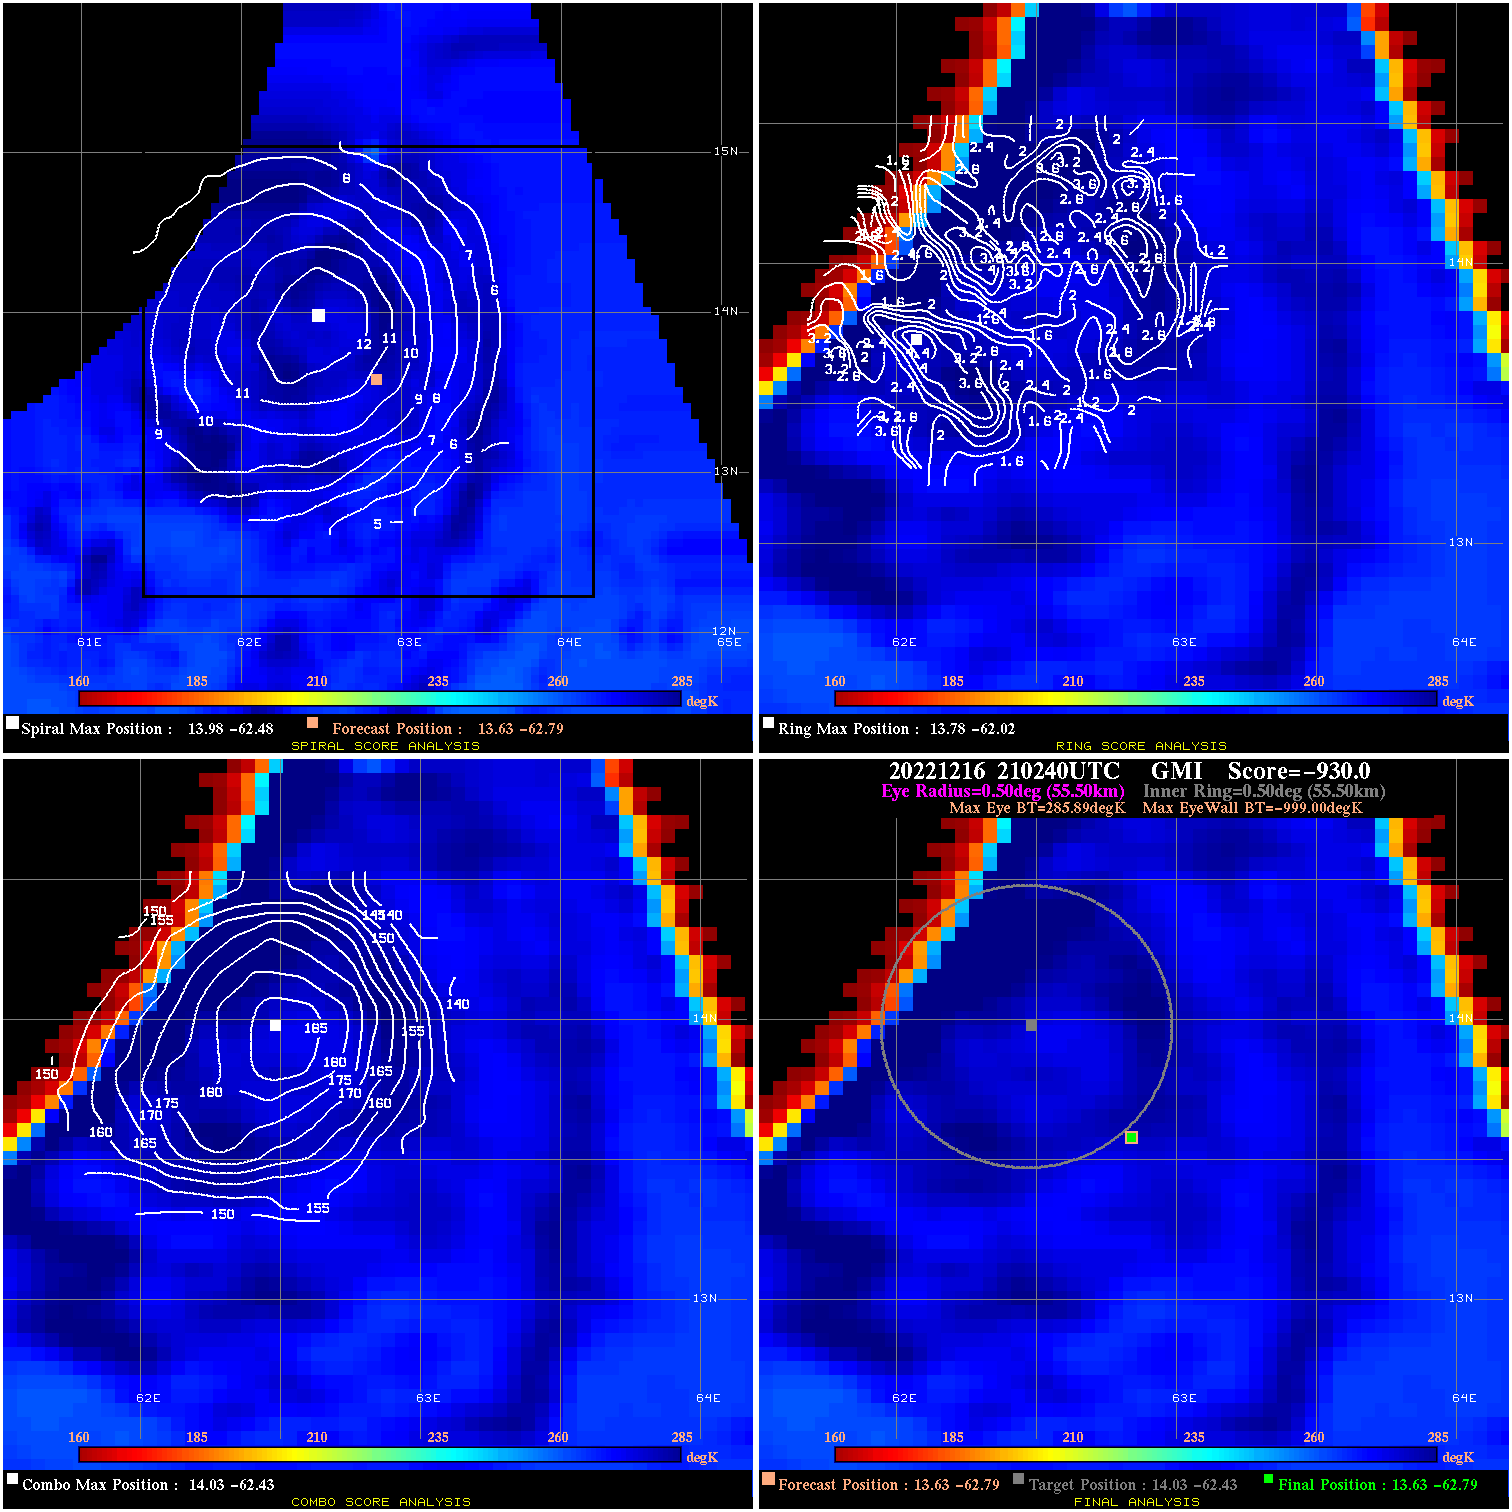
20221216 210240 -930.0 N/A N/A N/A 0.00 35.0 GMI 13.6 -62.8 13.6 -62.8 14.0 -62.4 Analysis Plot
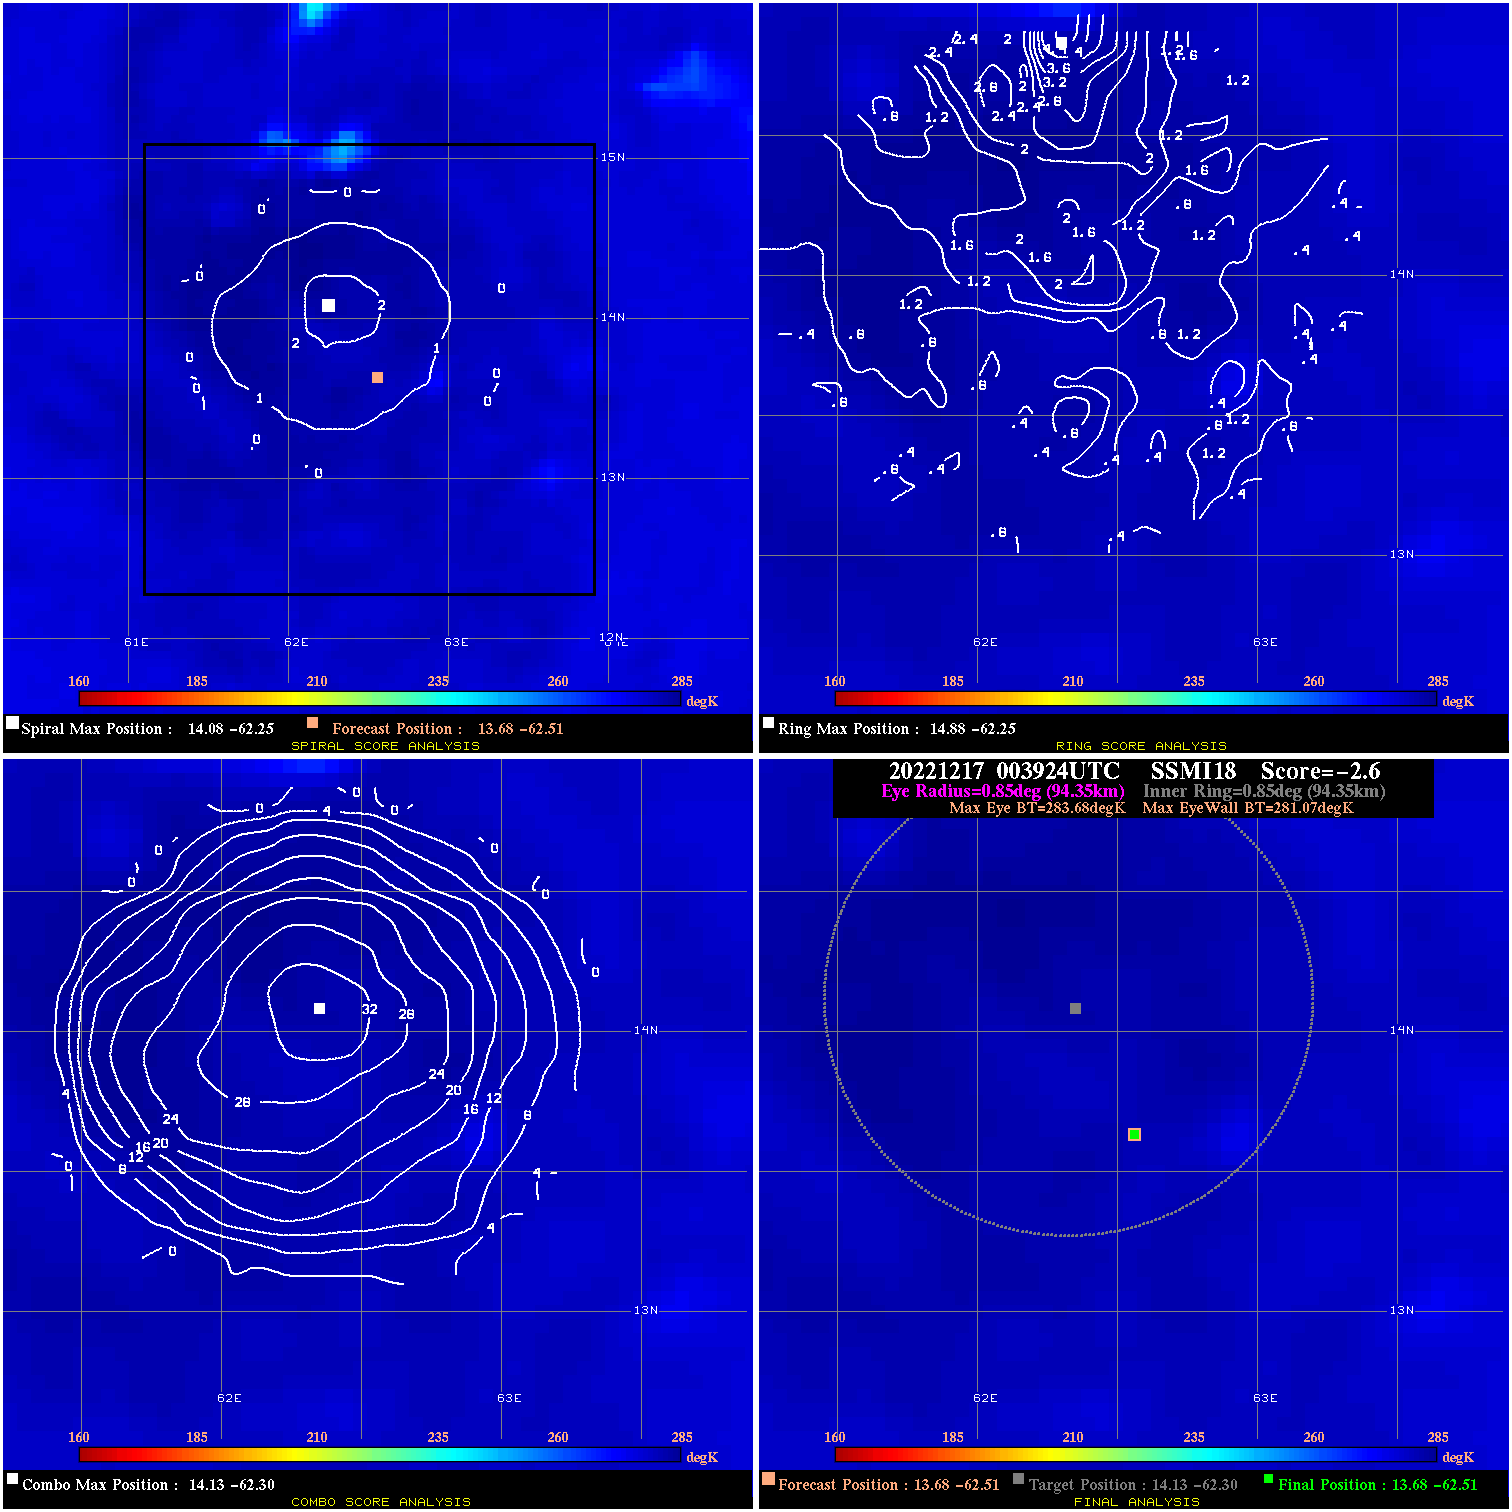
20221217 003924 -2.6 N/A N/A 188.87 2.61 35.0 SSMI18 13.7 -62.5 13.7 -62.5 14.1 -62.3 Analysis Plot
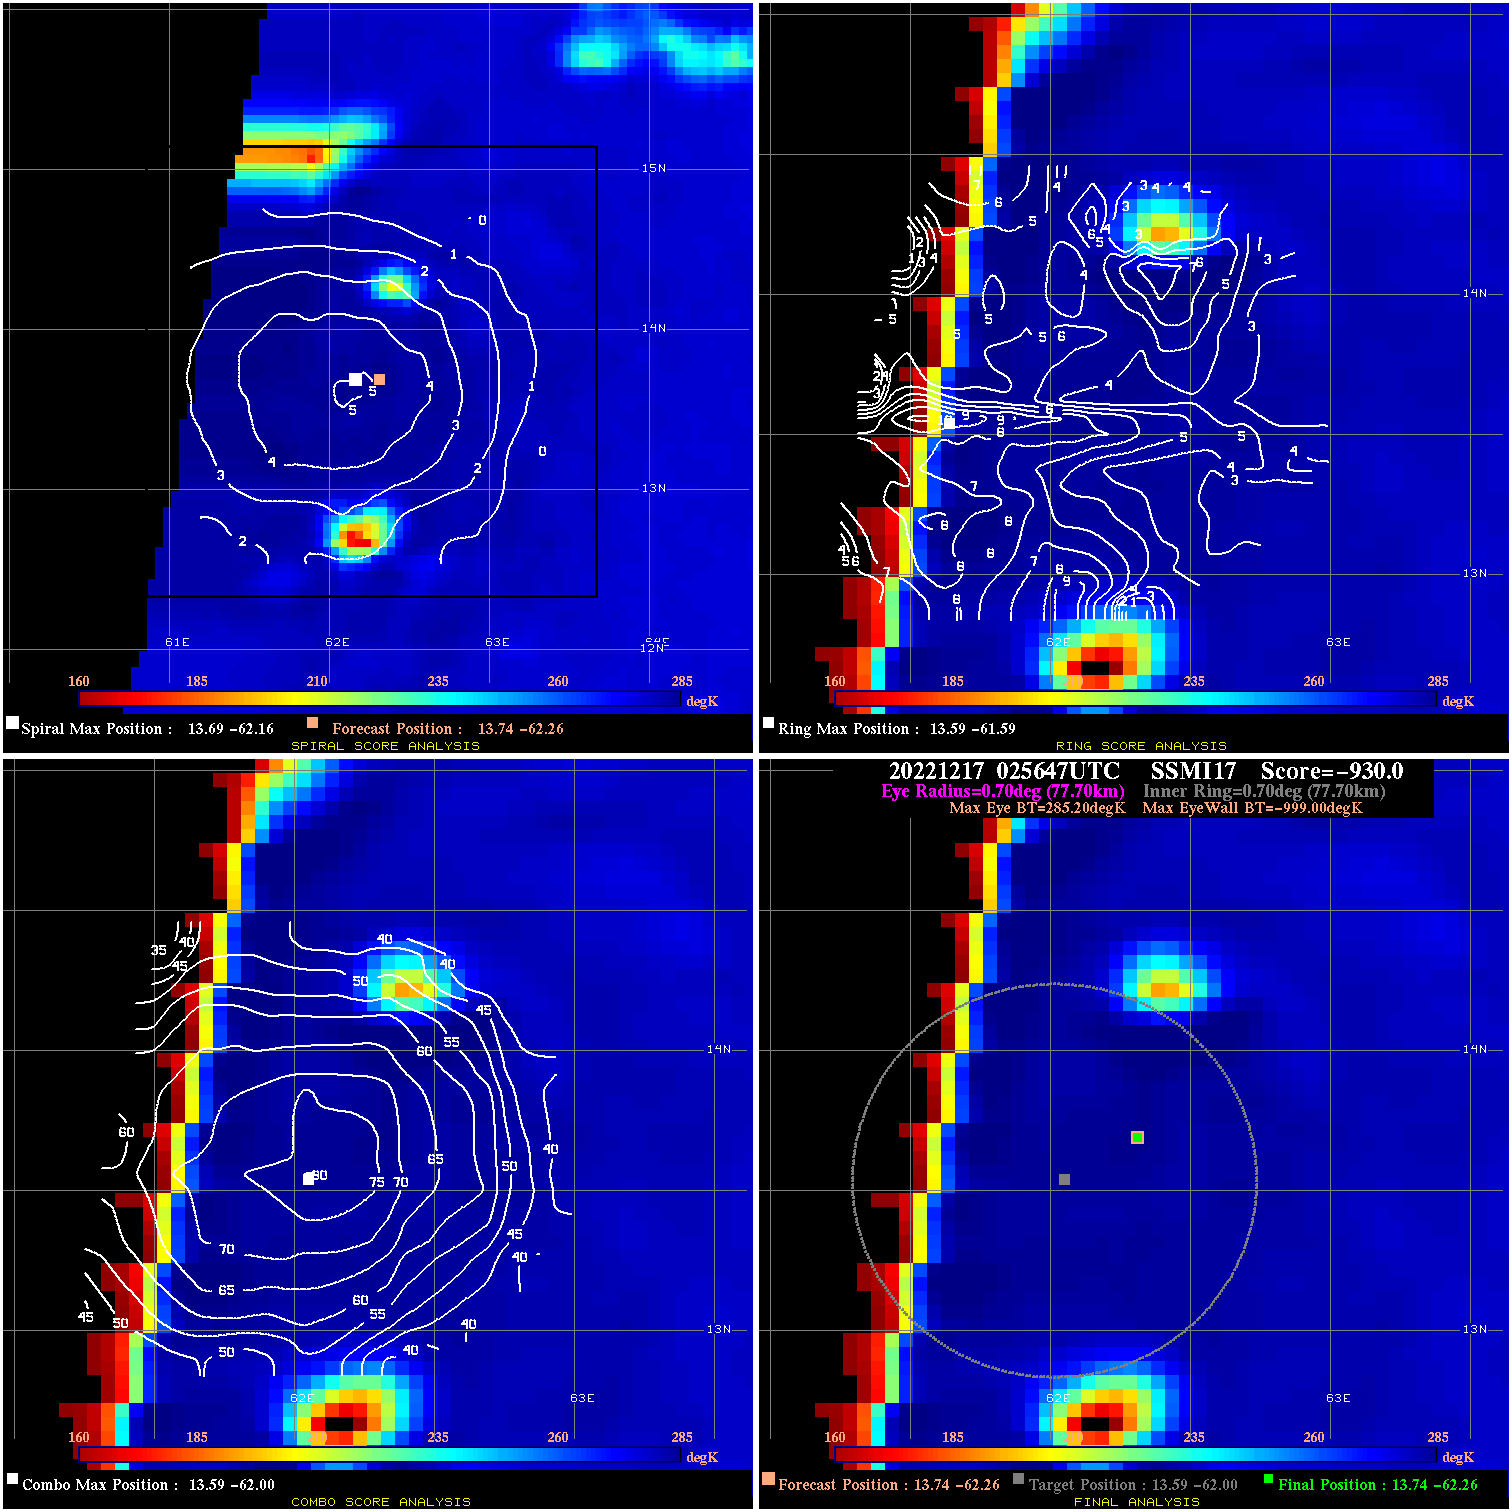
20221217 025647 -930.0 N/A N/A N/A 0.00 35.0 SSMI17 13.7 -62.3 13.7 -62.3 13.6 -62.0 Analysis Plot
|
|
Legend: - Date/Time are determined from PMW imagery at Forecast (initial guess) Lat/Lon position. - Positive/Negative Latitude = North/South Hemisphere; Longitude = Western/Eastern Hemisphere. - "Ring Diam" value indicates the estimated surface eyewall diameter in km (the MI eyewall edge diameter minus 10 km). - "Ring Pct" is the percentage of the "ring" (eyewall inner boundary) that is 1) colder than the "hot spot" (warmest eye pixel) in the eye by 20K, or 2) the percentage that is a) colder than 232K and b) colder than the "hot spot" by 10K, whichever is greater. - Values are red if Ring % <= 65, yellow/brown if Ring % <= 85 and green if Ring % > 85. - "Tb diff" is the difference between the "hot spot" (warmest eye pixel) and the warmest pixel on the eyewall. - Intensity score are listed as negative, and not used, when the JTWC or NHC estimated Vmax is <55 kts in order to rule out weak but highly symmetric TCs. - Error messages in intensity scores: -920 is used when the hottest pixel in the eye is <200K, to prevent false positives; -930 means <85% of eyewall has observations/data. |