Tropical Depression 10E
|
Passive Microwave (PMW) Intensity Information Hurricane Intensity Estimation (HIE) Algorithm Version 9.0 |
Overpass Inten Ring Ring Wind Forecast Final Target
Date Time Score Meaning Pct Diam BTdiff Est Sat Lat Lon Lat Lon Lat Lon
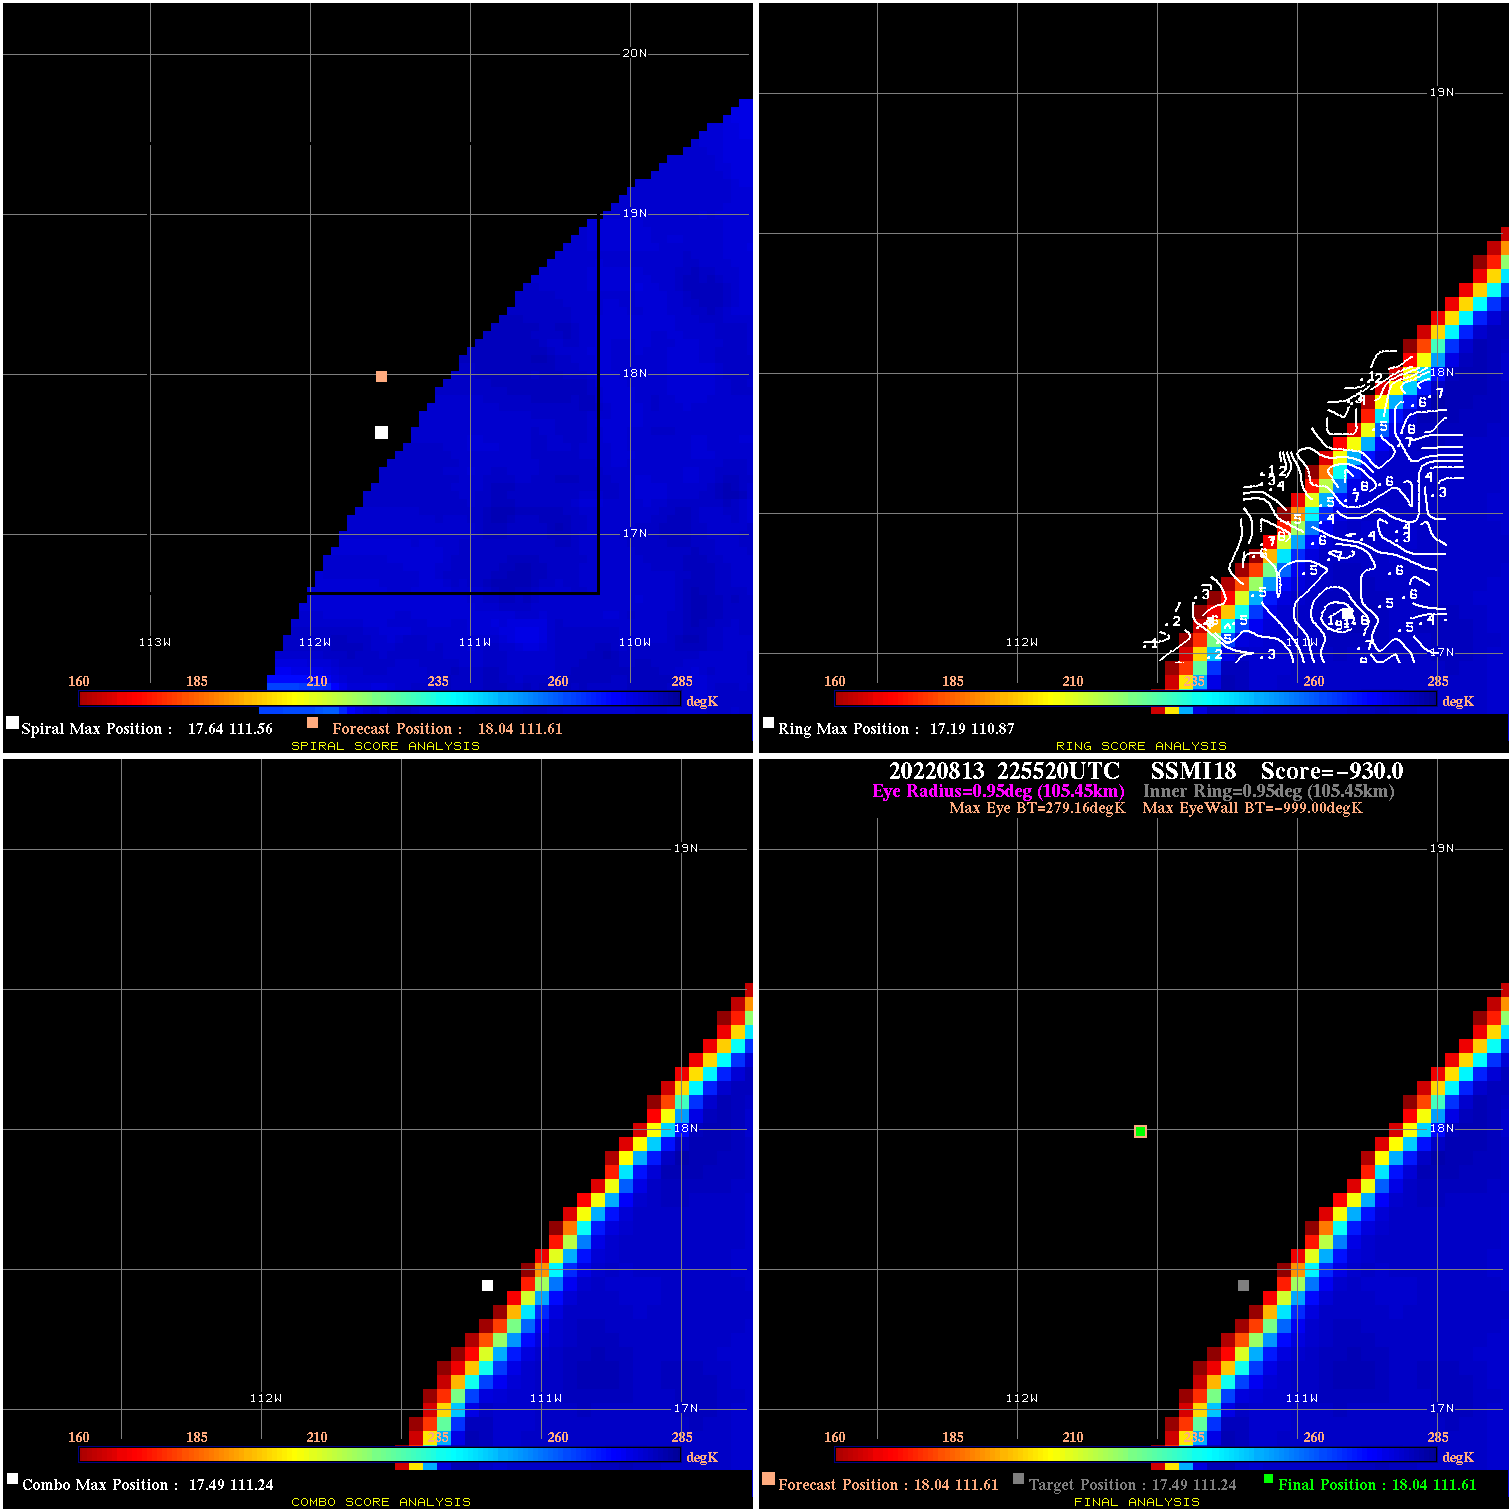
20220813 225520 -930.0 N/A N/A N/A 0.00 30.0 SSMI18 18.0 111.6 18.0 111.6 17.5 111.2 Analysis Plot
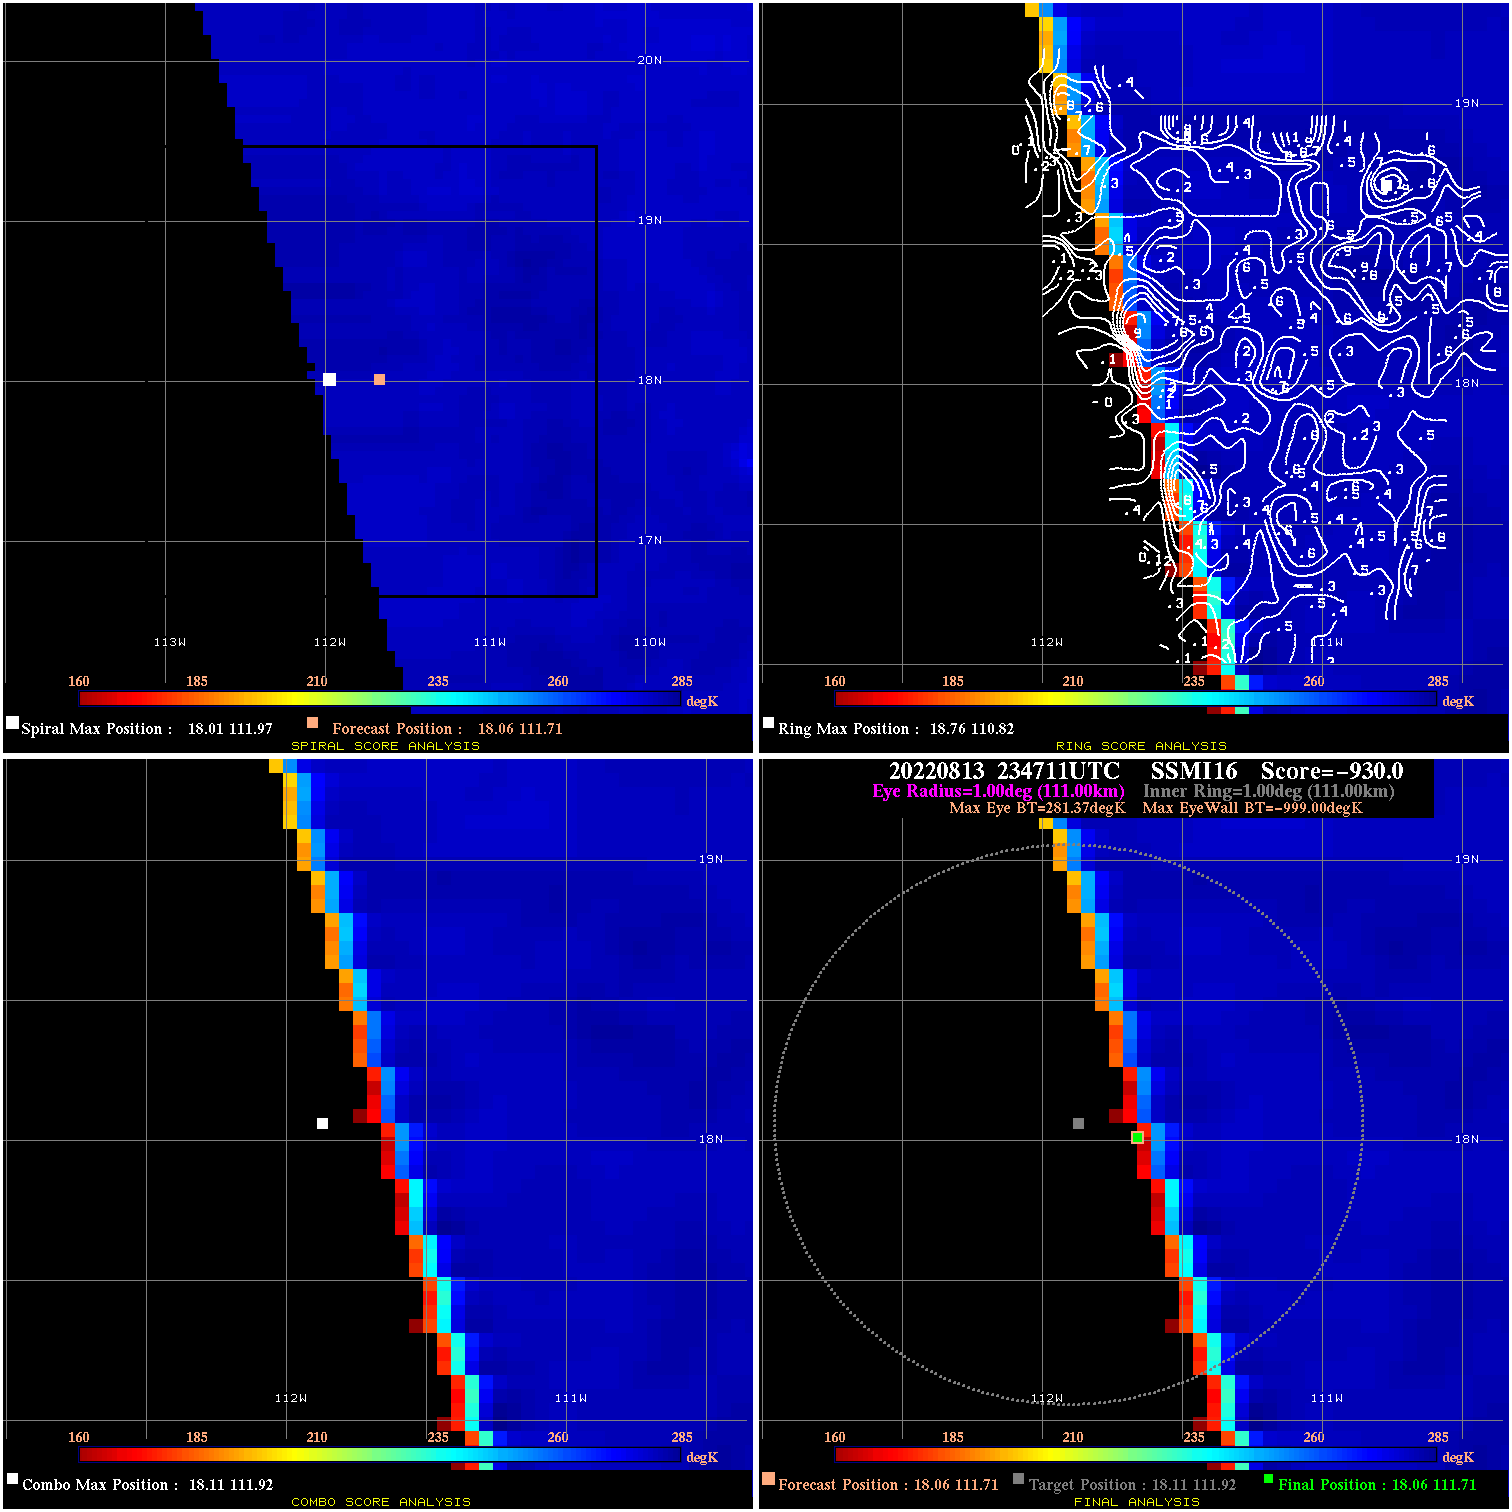
20220813 234711 -930.0 N/A N/A N/A 0.00 30.0 SSMI16 18.1 111.7 18.1 111.7 18.1 111.9 Analysis Plot
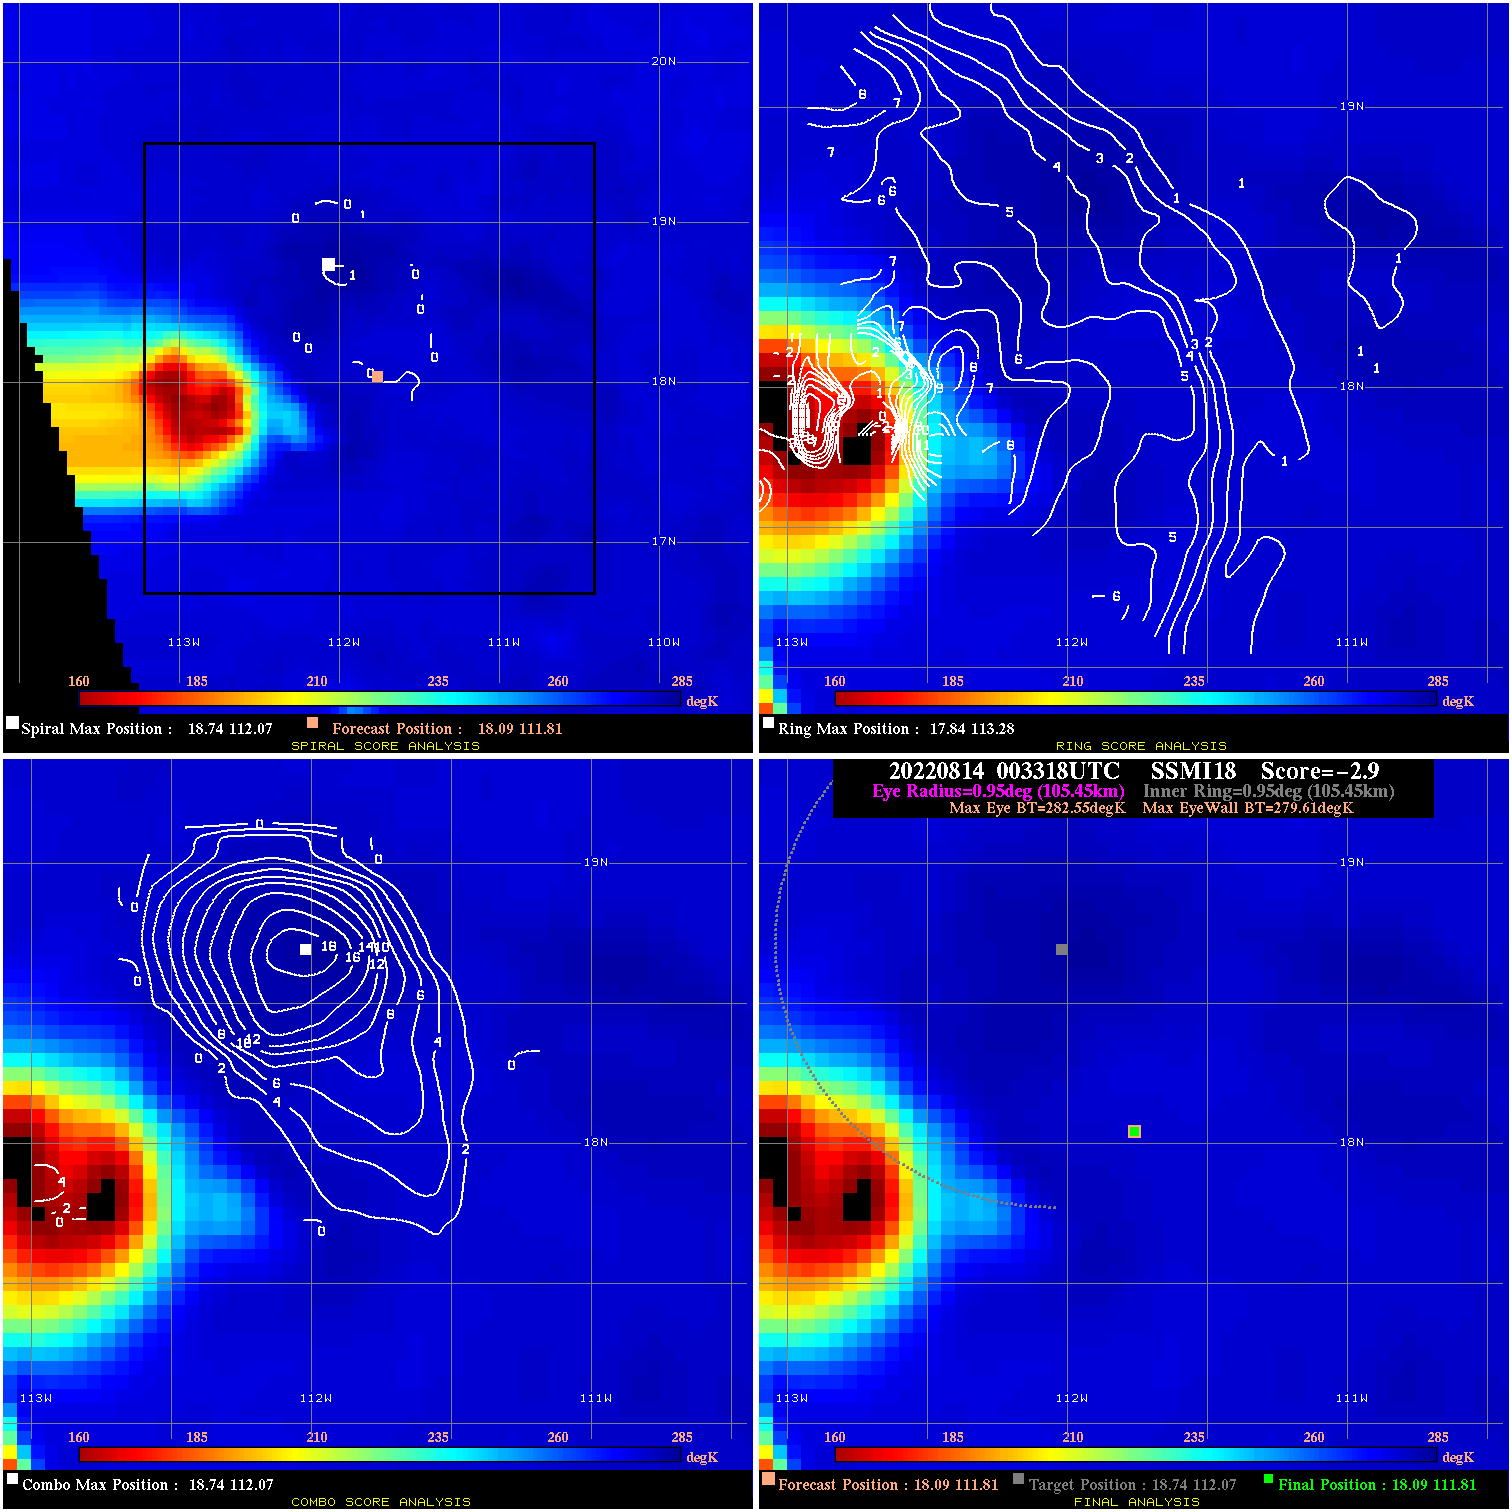
20220814 003318 -2.9 N/A 11.8% 211.09 2.94 30.0 SSMI18 18.1 111.8 18.1 111.8 18.7 112.1 Analysis Plot
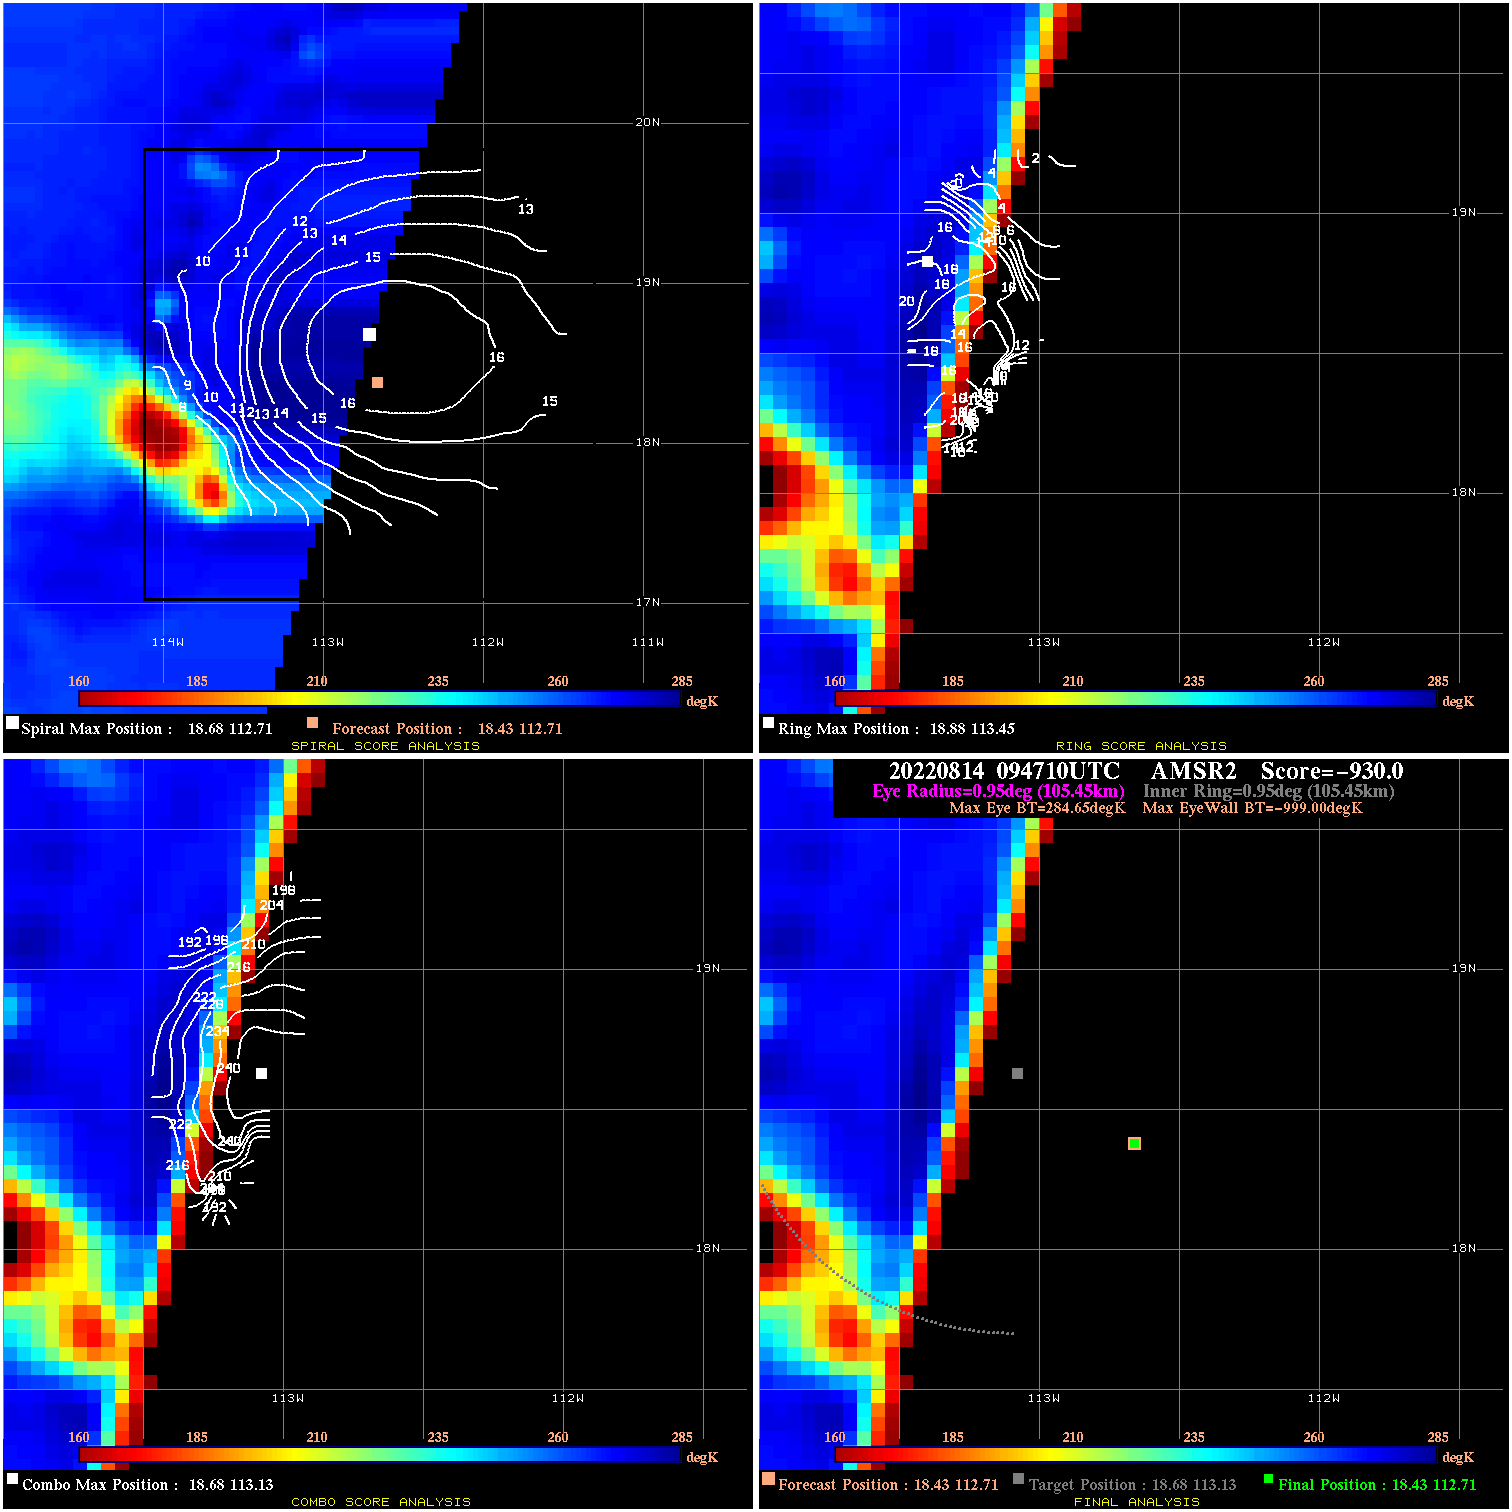
20220814 094710 -930.0 N/A N/A N/A 0.00 30.0 AMSR2 18.4 112.7 18.4 112.7 18.7 113.1 Analysis Plot
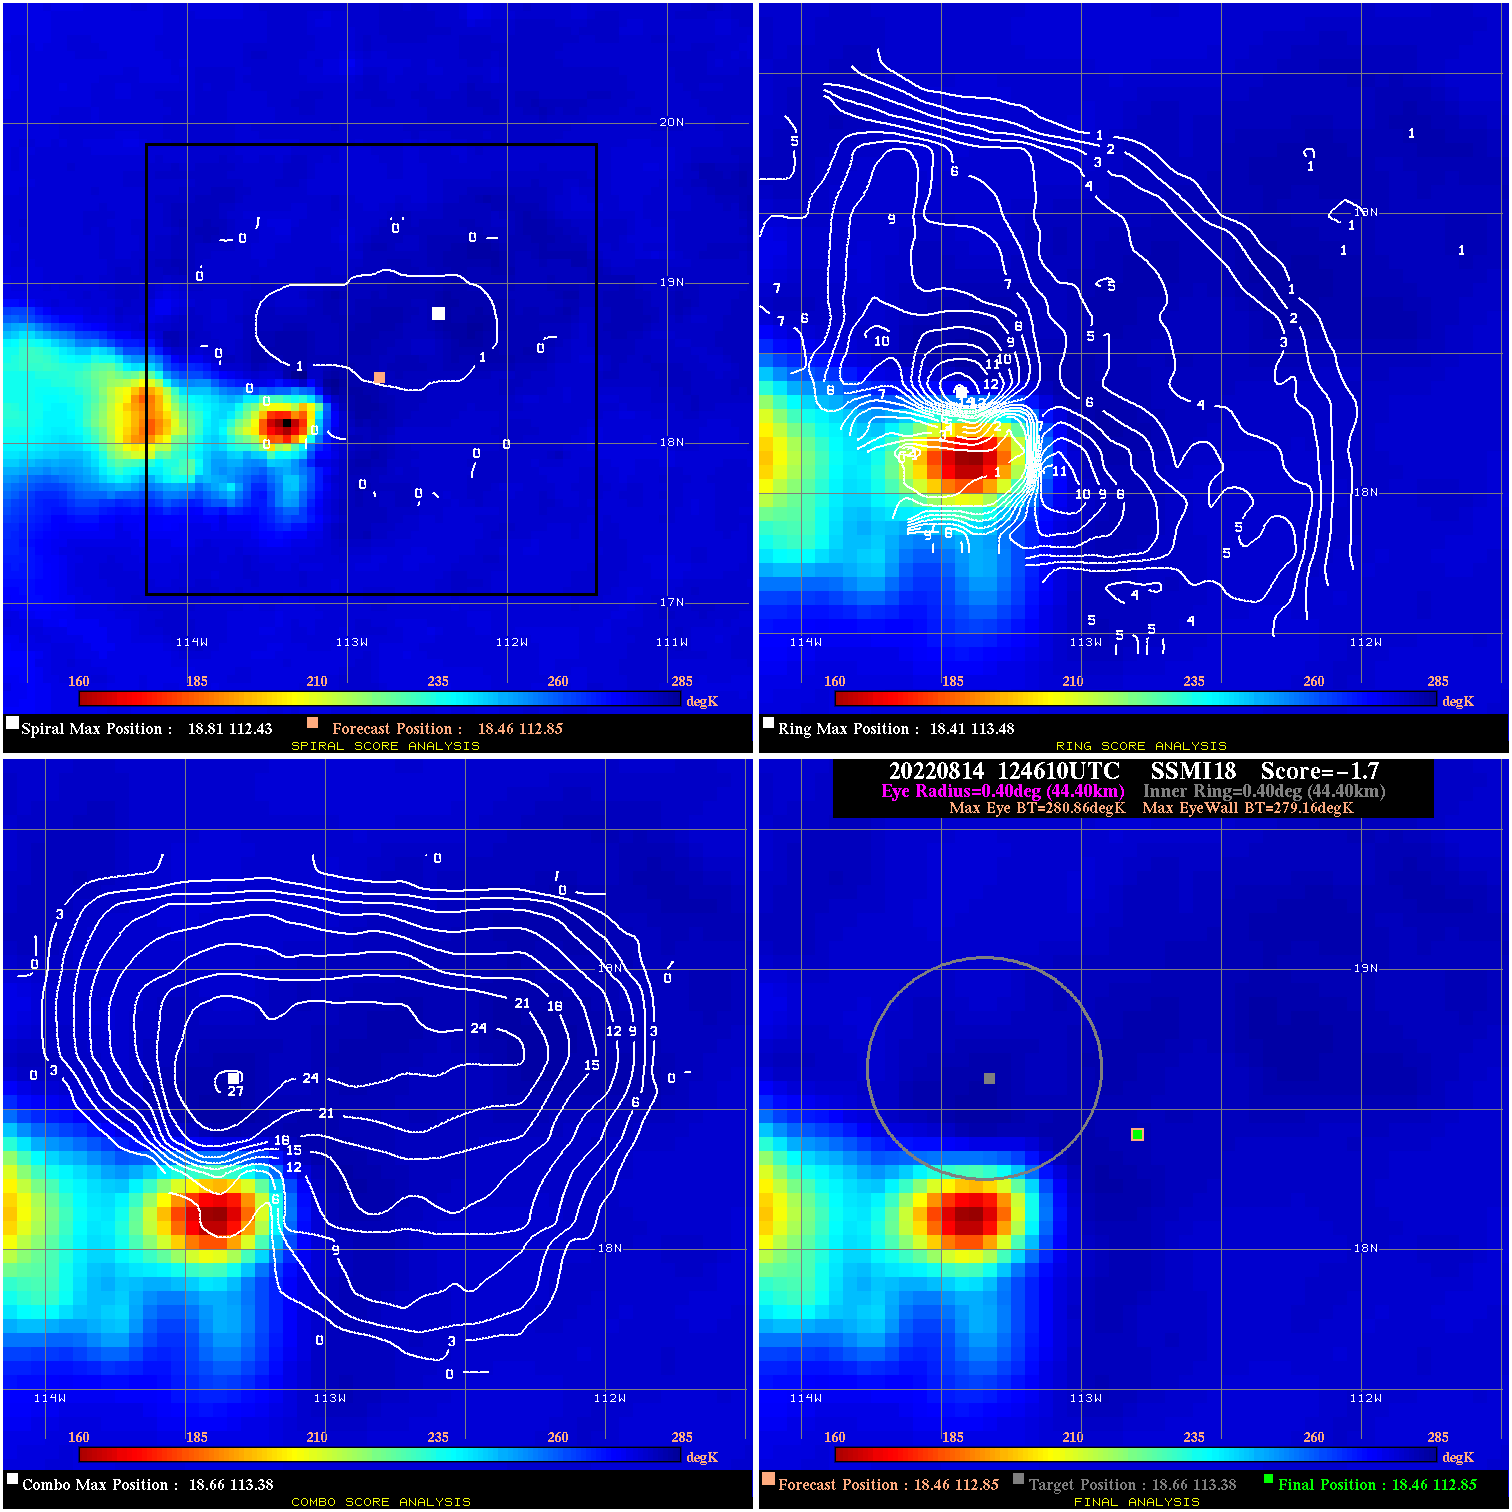
20220814 124610 -1.7 N/A 5.5% 88.88 1.70 30.0 SSMI18 18.5 112.8 18.5 112.8 18.7 113.4 Analysis Plot
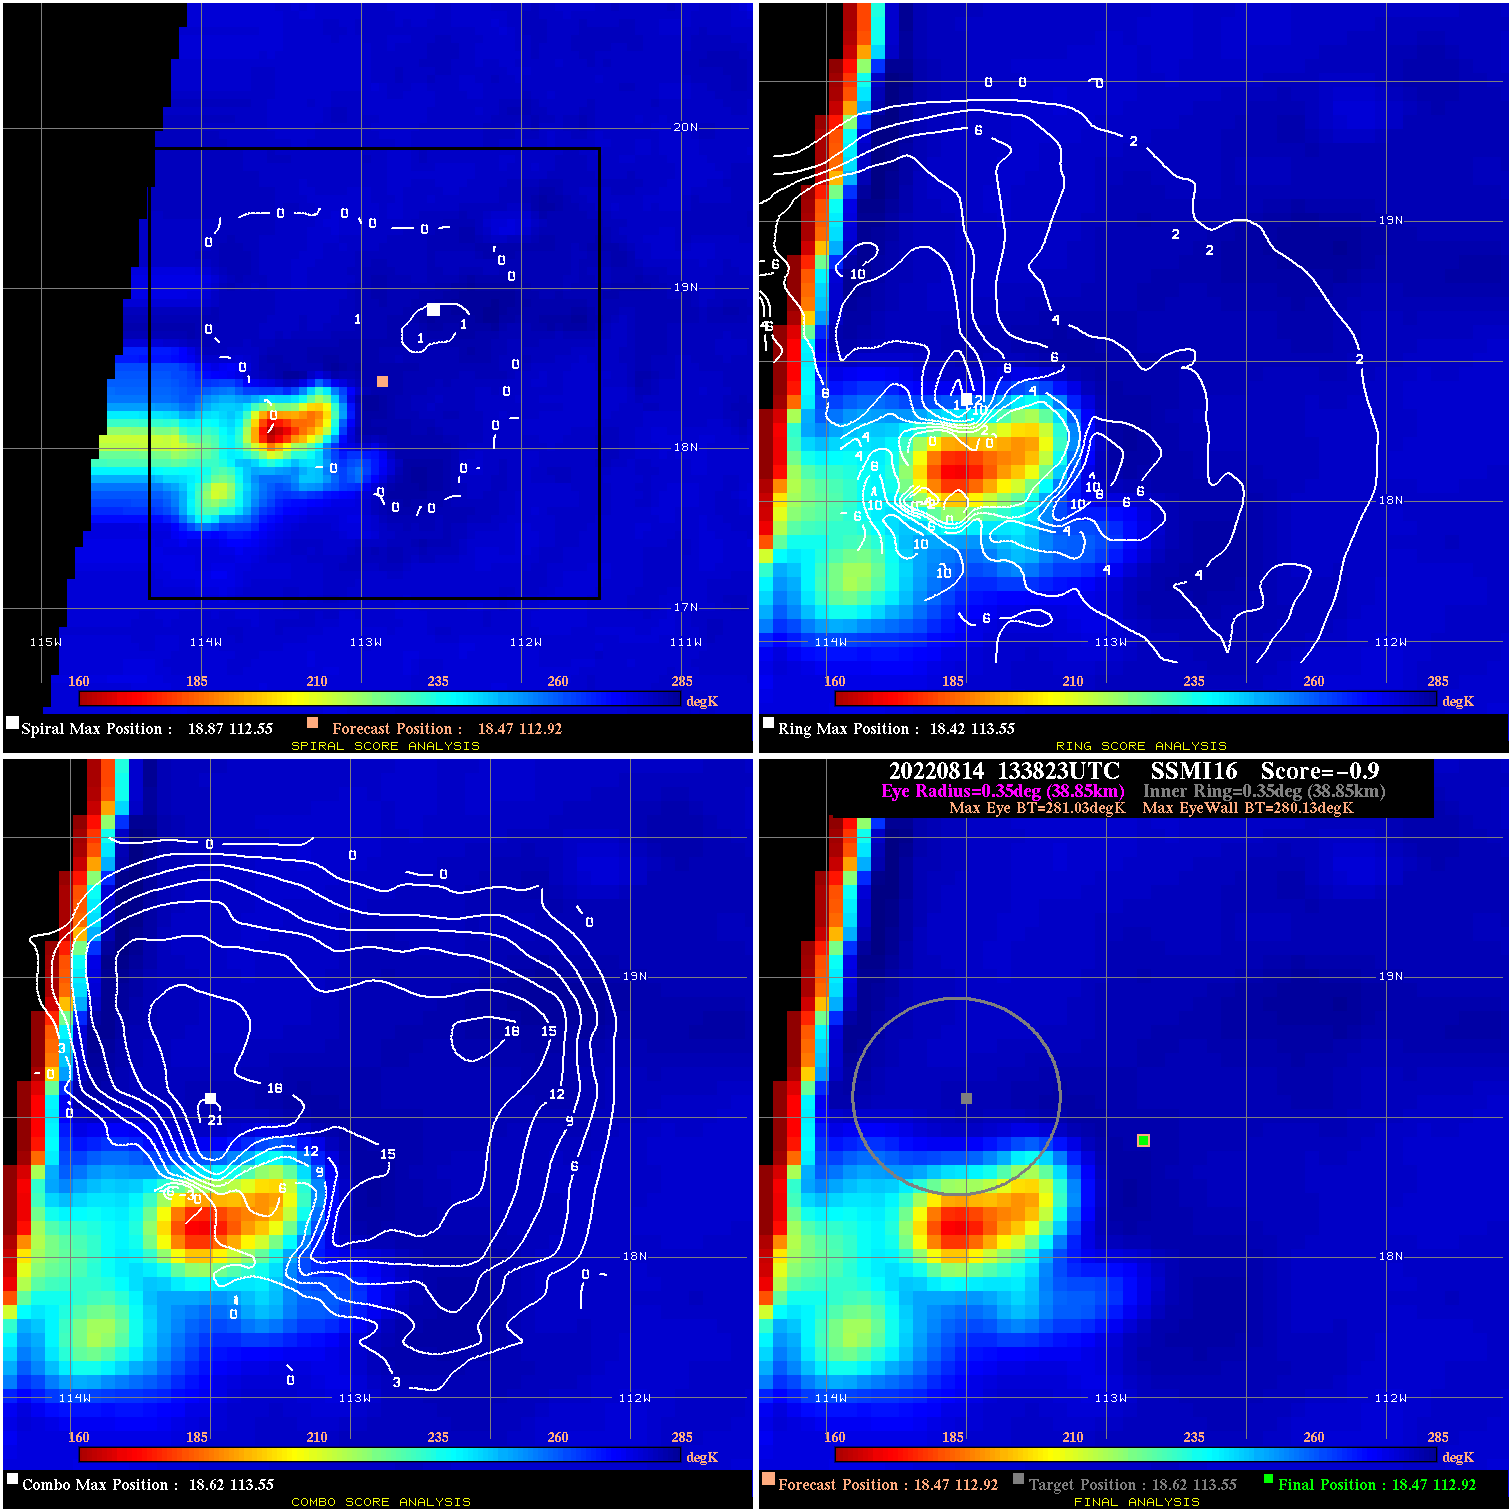
20220814 133823 -0.9 N/A 16.4% 77.77 .90 30.0 SSMI16 18.5 112.9 18.5 112.9 18.6 113.6 Analysis Plot
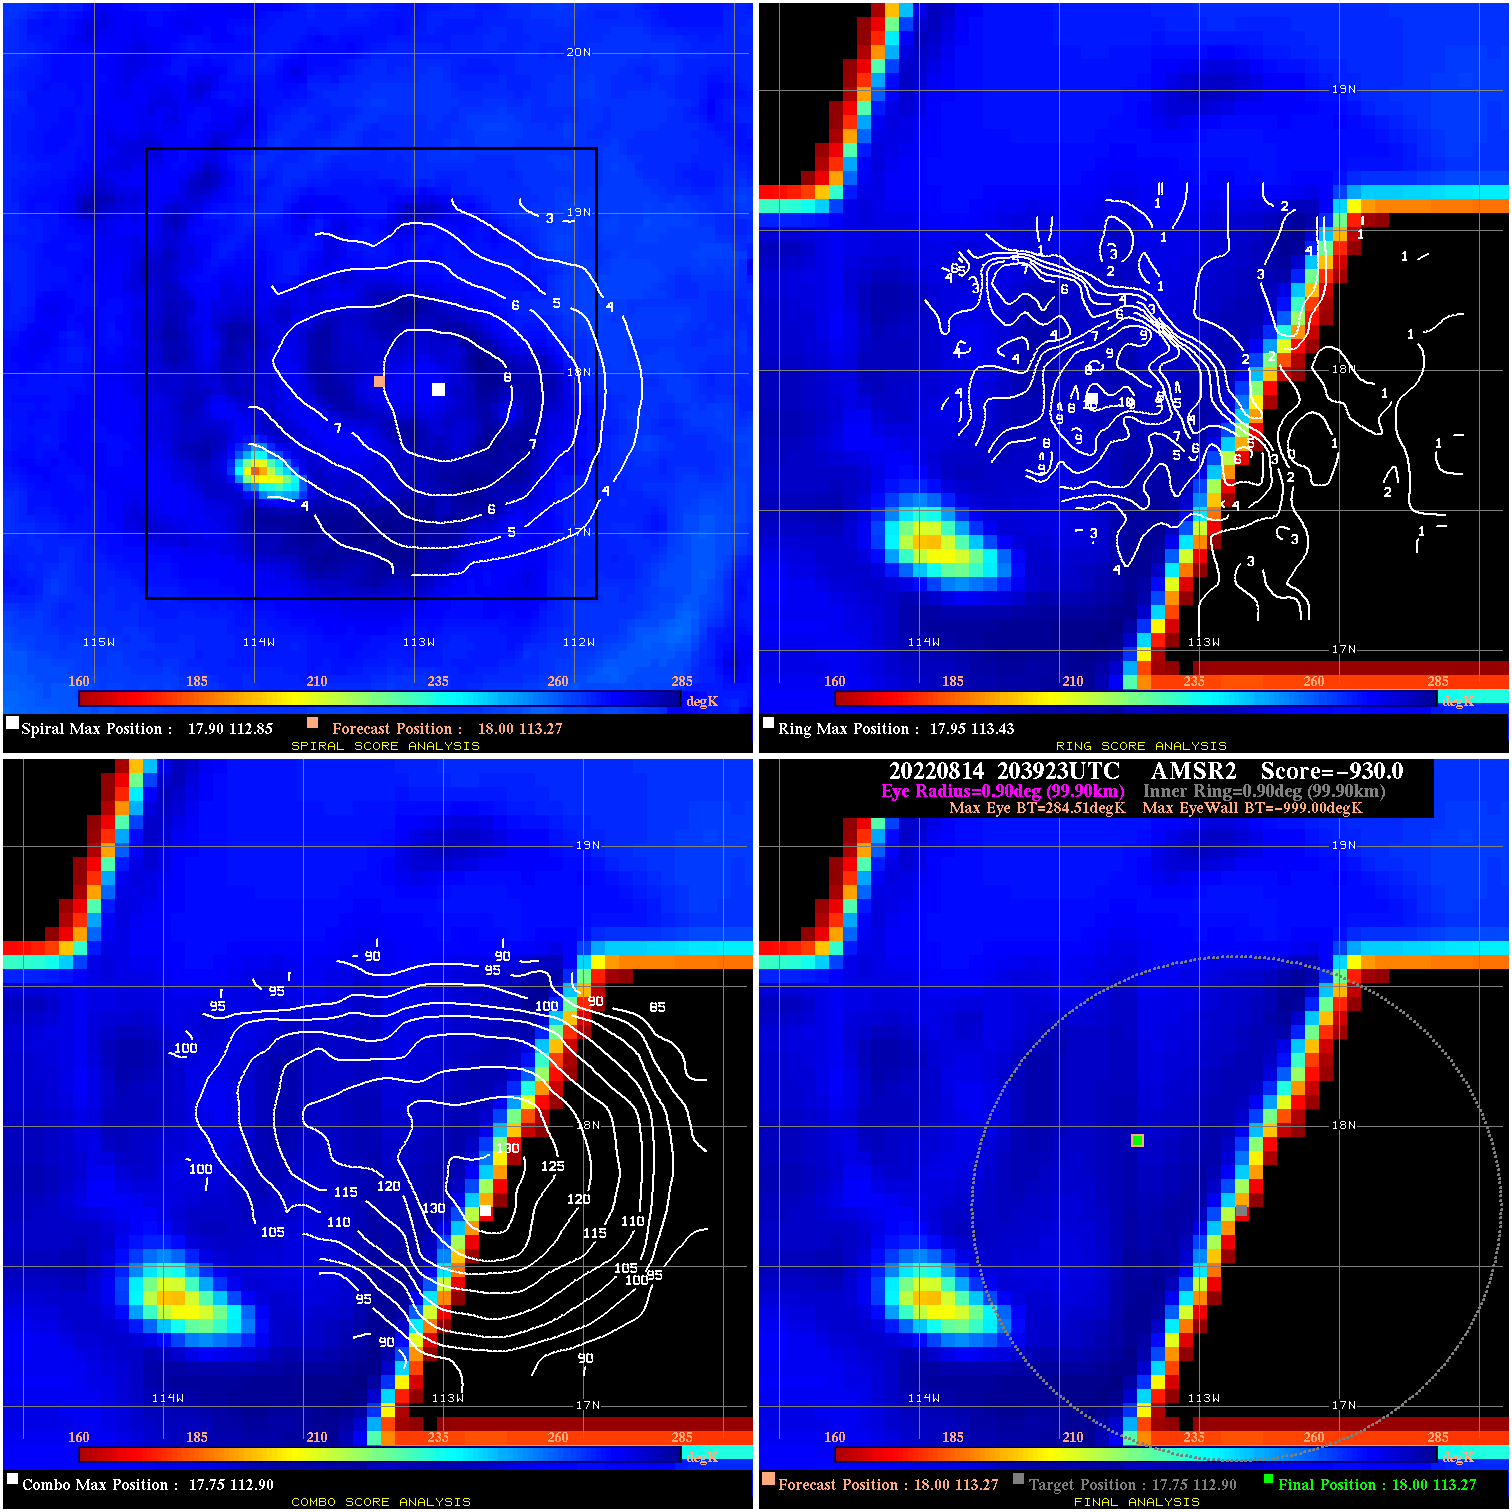
20220814 203923 -930.0 N/A N/A N/A 0.00 30.0 AMSR2 18.0 113.3 18.0 113.3 17.8 112.9 Analysis Plot
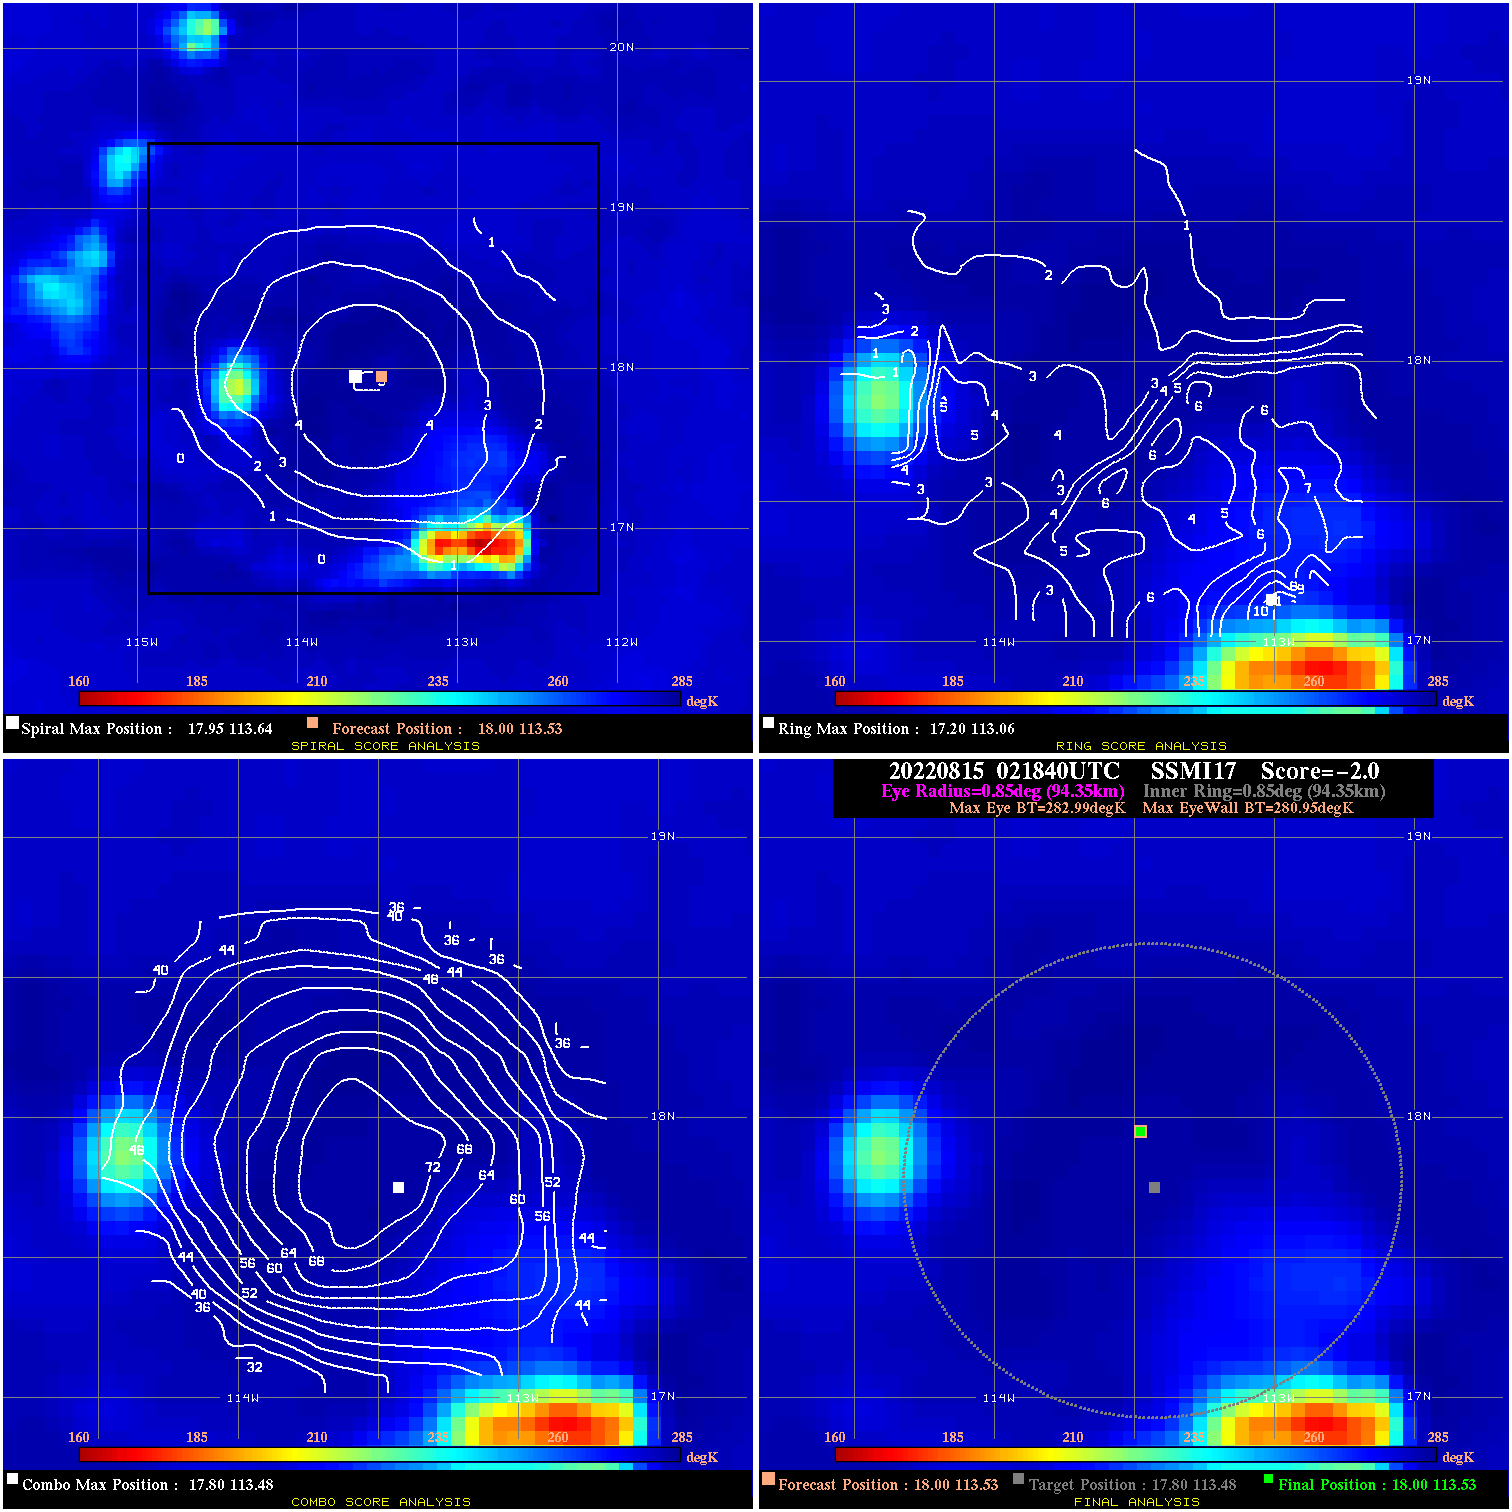
20220815 021840 -2.0 N/A 9.6% 188.87 2.04 30.0 SSMI17 18.0 113.5 18.0 113.5 17.8 113.5 Analysis Plot
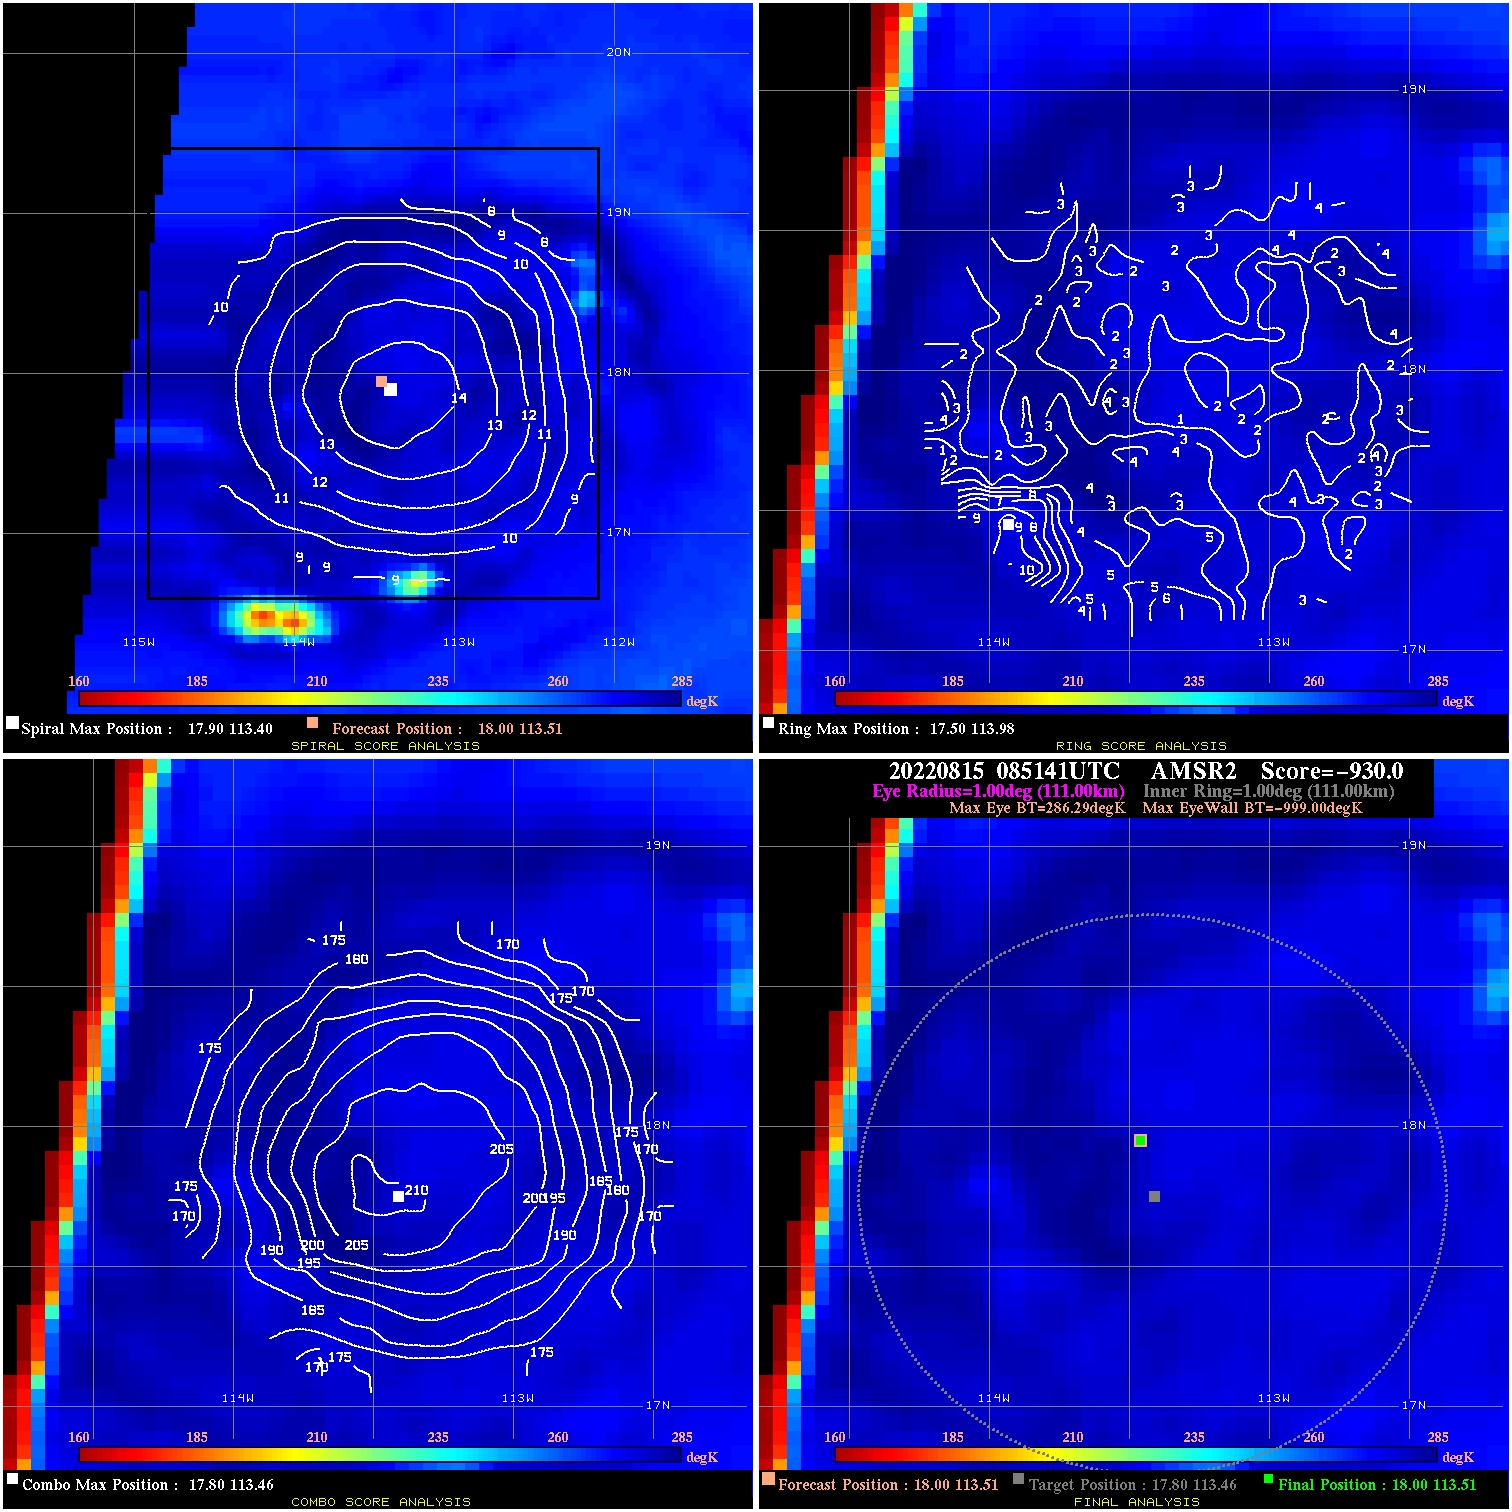
20220815 085141 -930.0 N/A N/A N/A 0.00 25.0 AMSR2 18.0 113.5 18.0 113.5 17.8 113.5 Analysis Plot
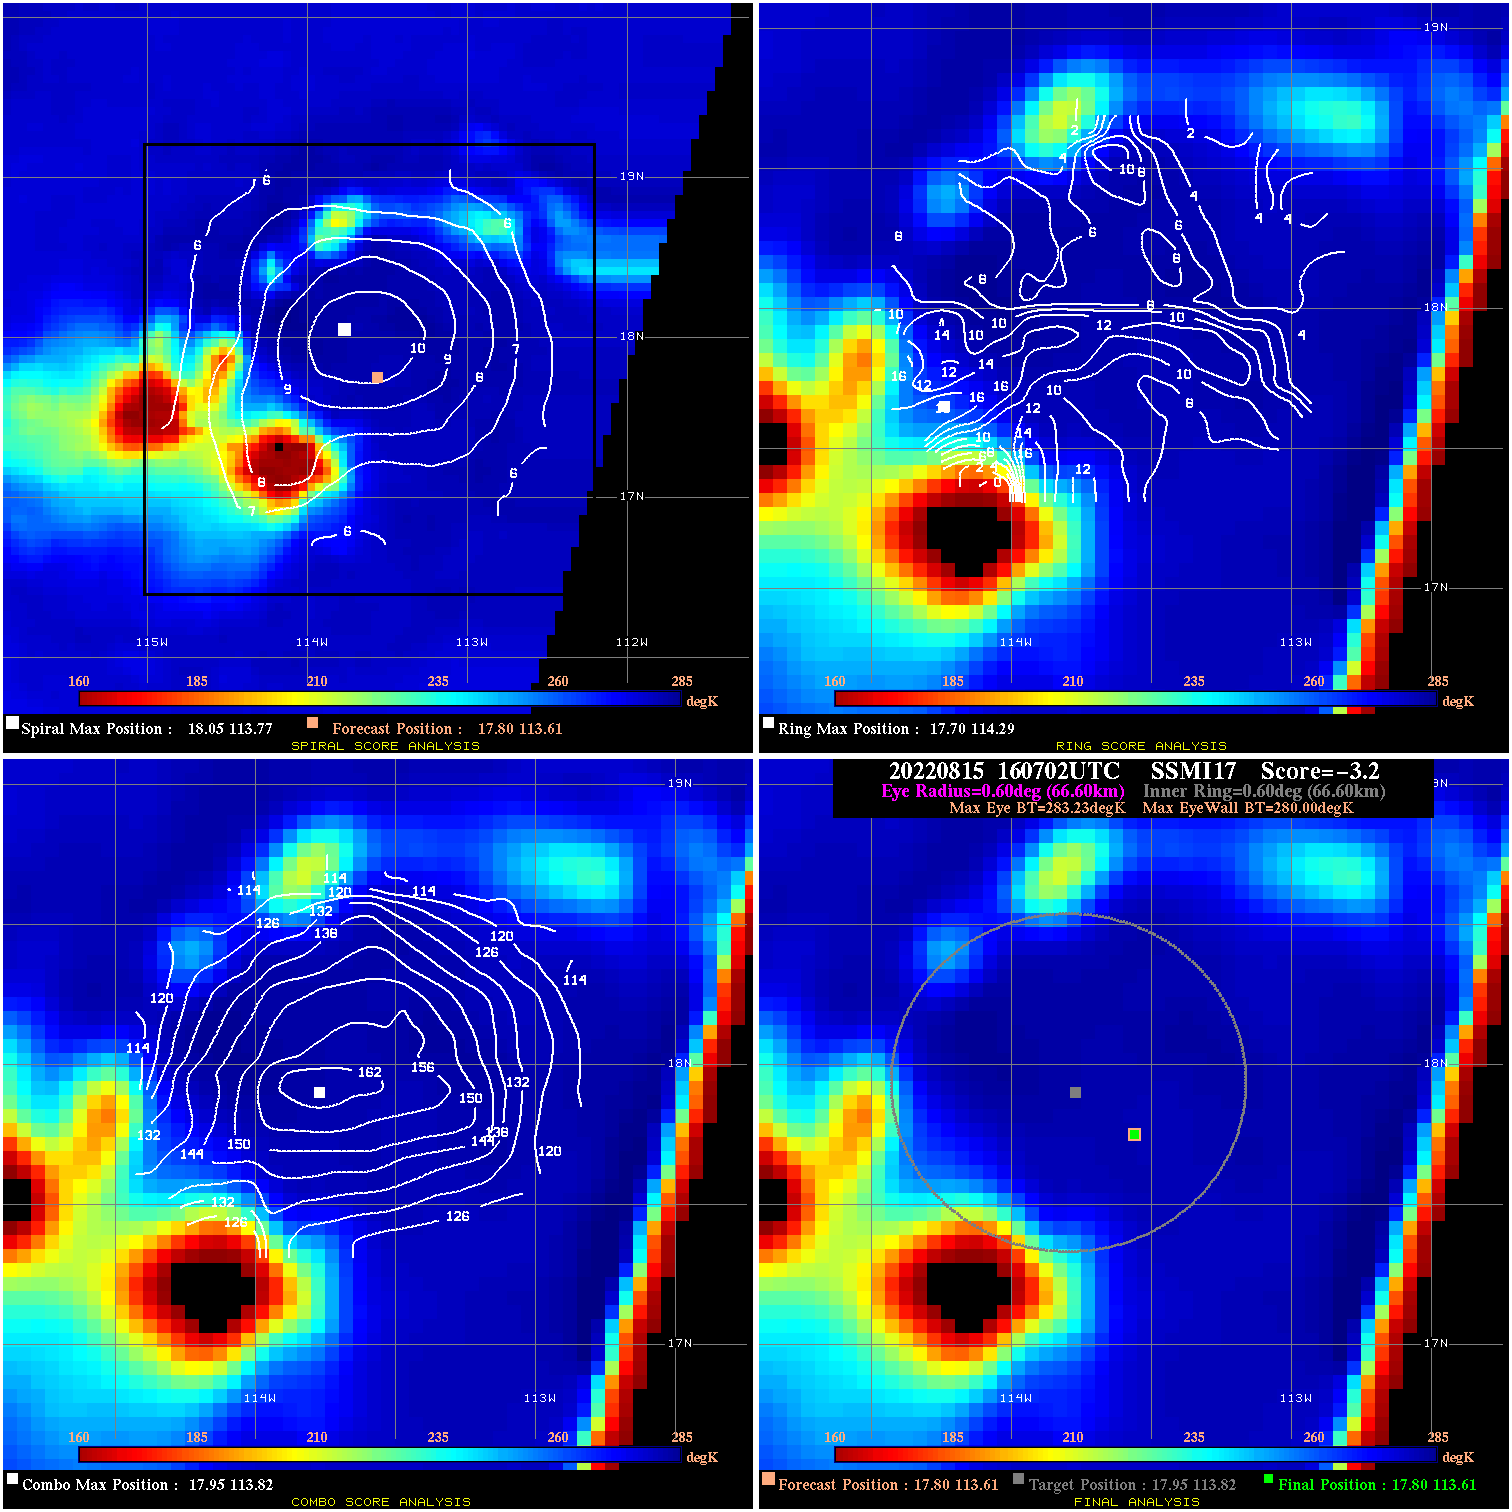
20220815 160702 -3.2 N/A 28.8% 133.32 3.23 25.0 SSMI17 17.8 113.6 17.8 113.6 18.0 113.8 Analysis Plot
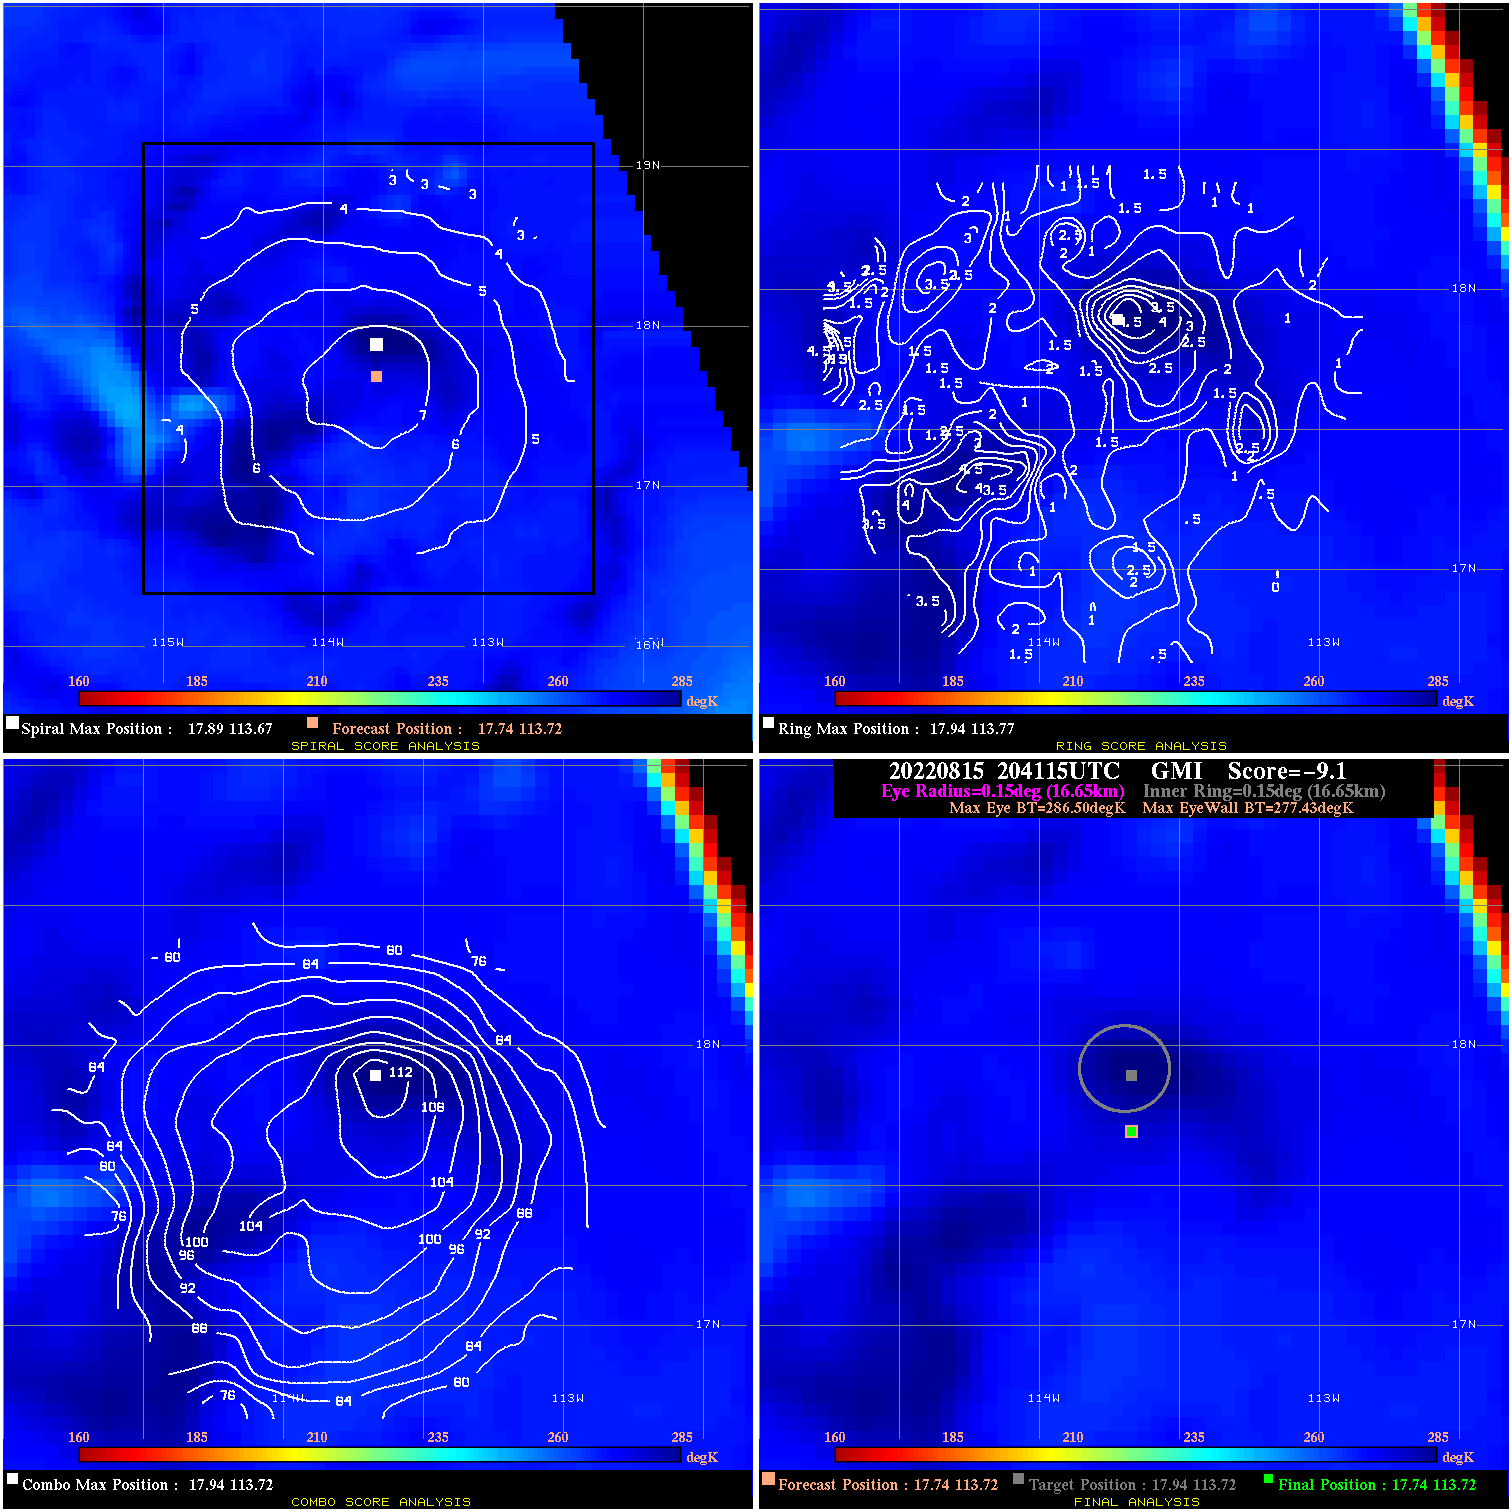
20220815 204115 -9.1 N/A N/A 33.33 9.07 25.0 GMI 17.7 113.7 17.7 113.7 17.9 113.7 Analysis Plot
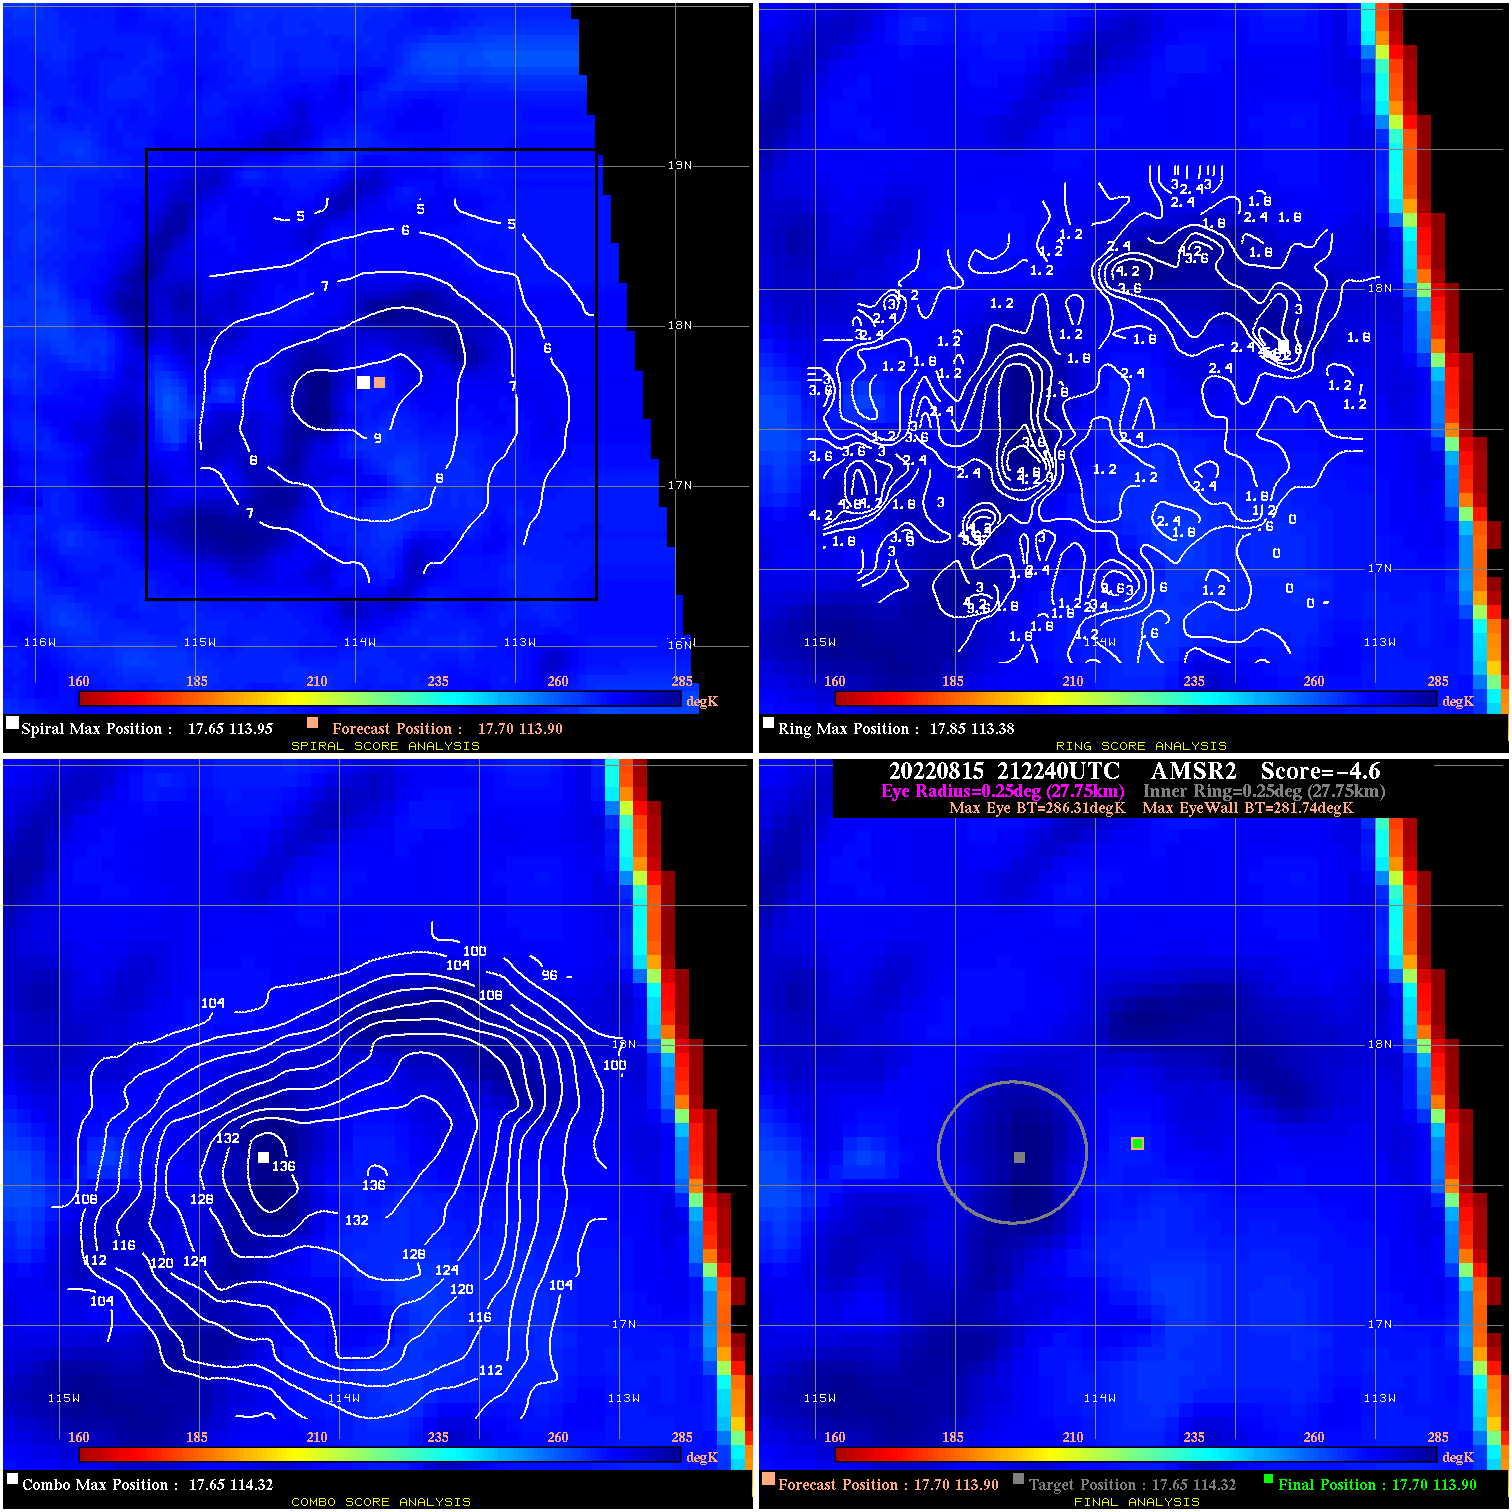
20220815 212240 -4.6 N/A N/A 55.55 4.57 35.0 AMSR2 17.7 113.9 17.7 113.9 17.6 114.3 Analysis Plot
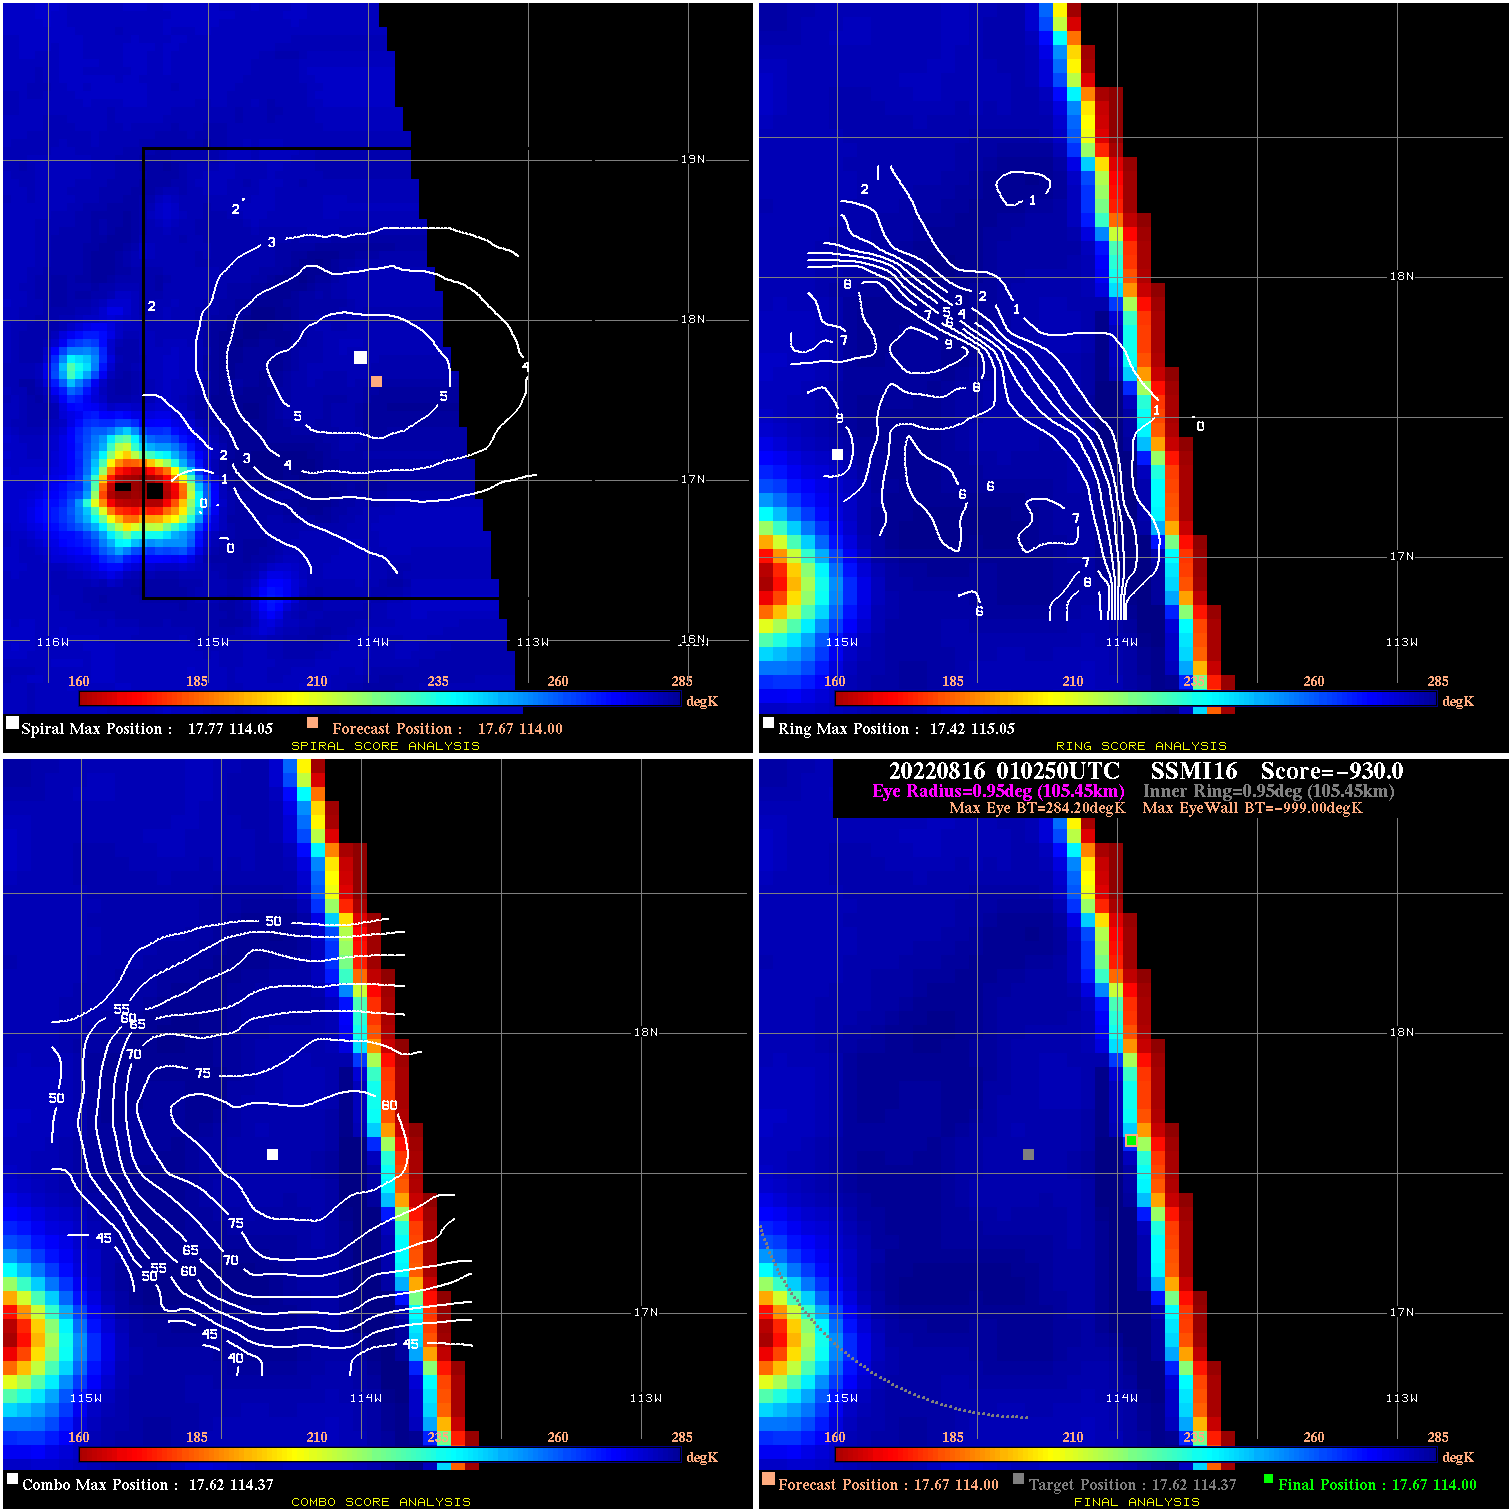
20220816 010250 -930.0 N/A N/A N/A 0.00 35.0 SSMI16 17.7 114.0 17.7 114.0 17.6 114.4 Analysis Plot
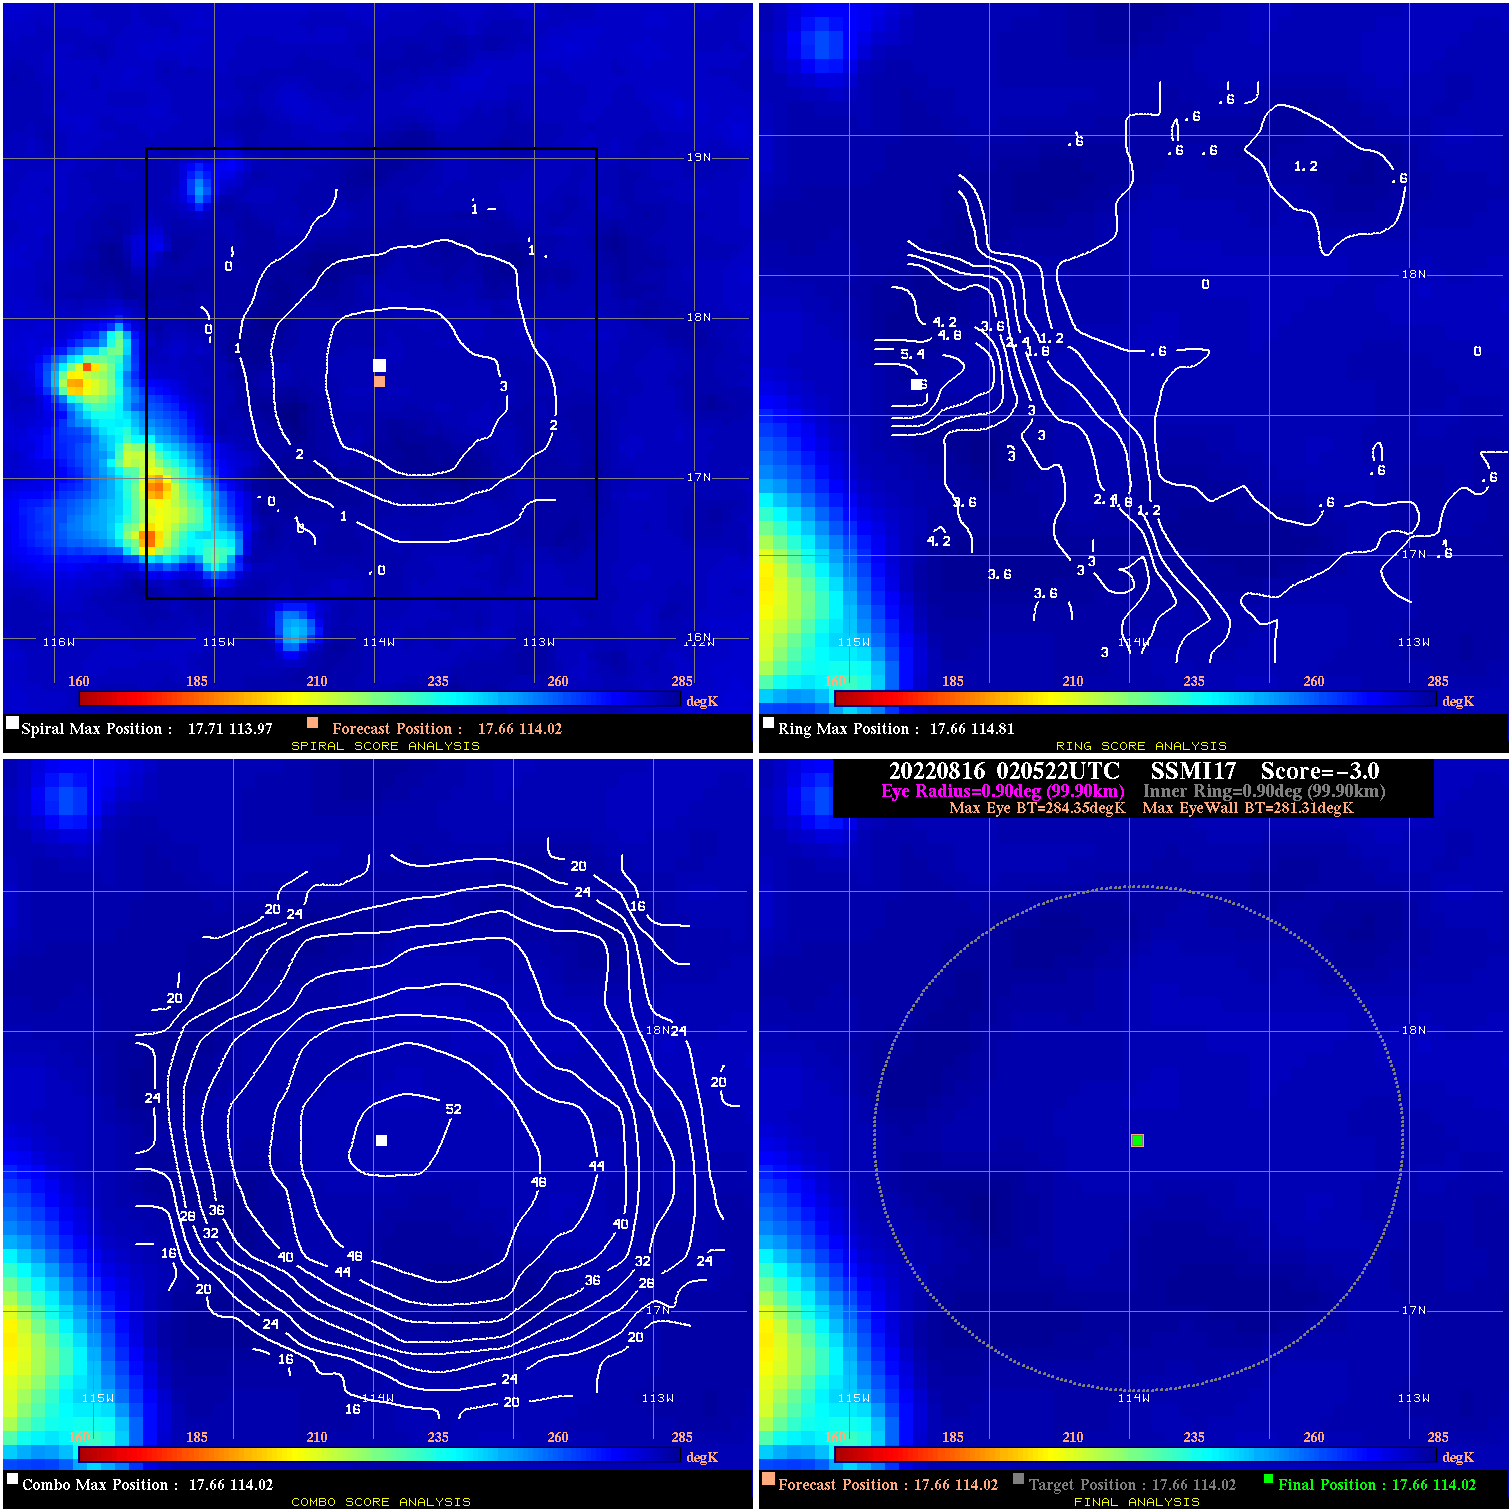
20220816 020522 -3.0 N/A N/A 199.98 3.04 35.0 SSMI17 17.7 114.0 17.7 114.0 17.7 114.0 Analysis Plot
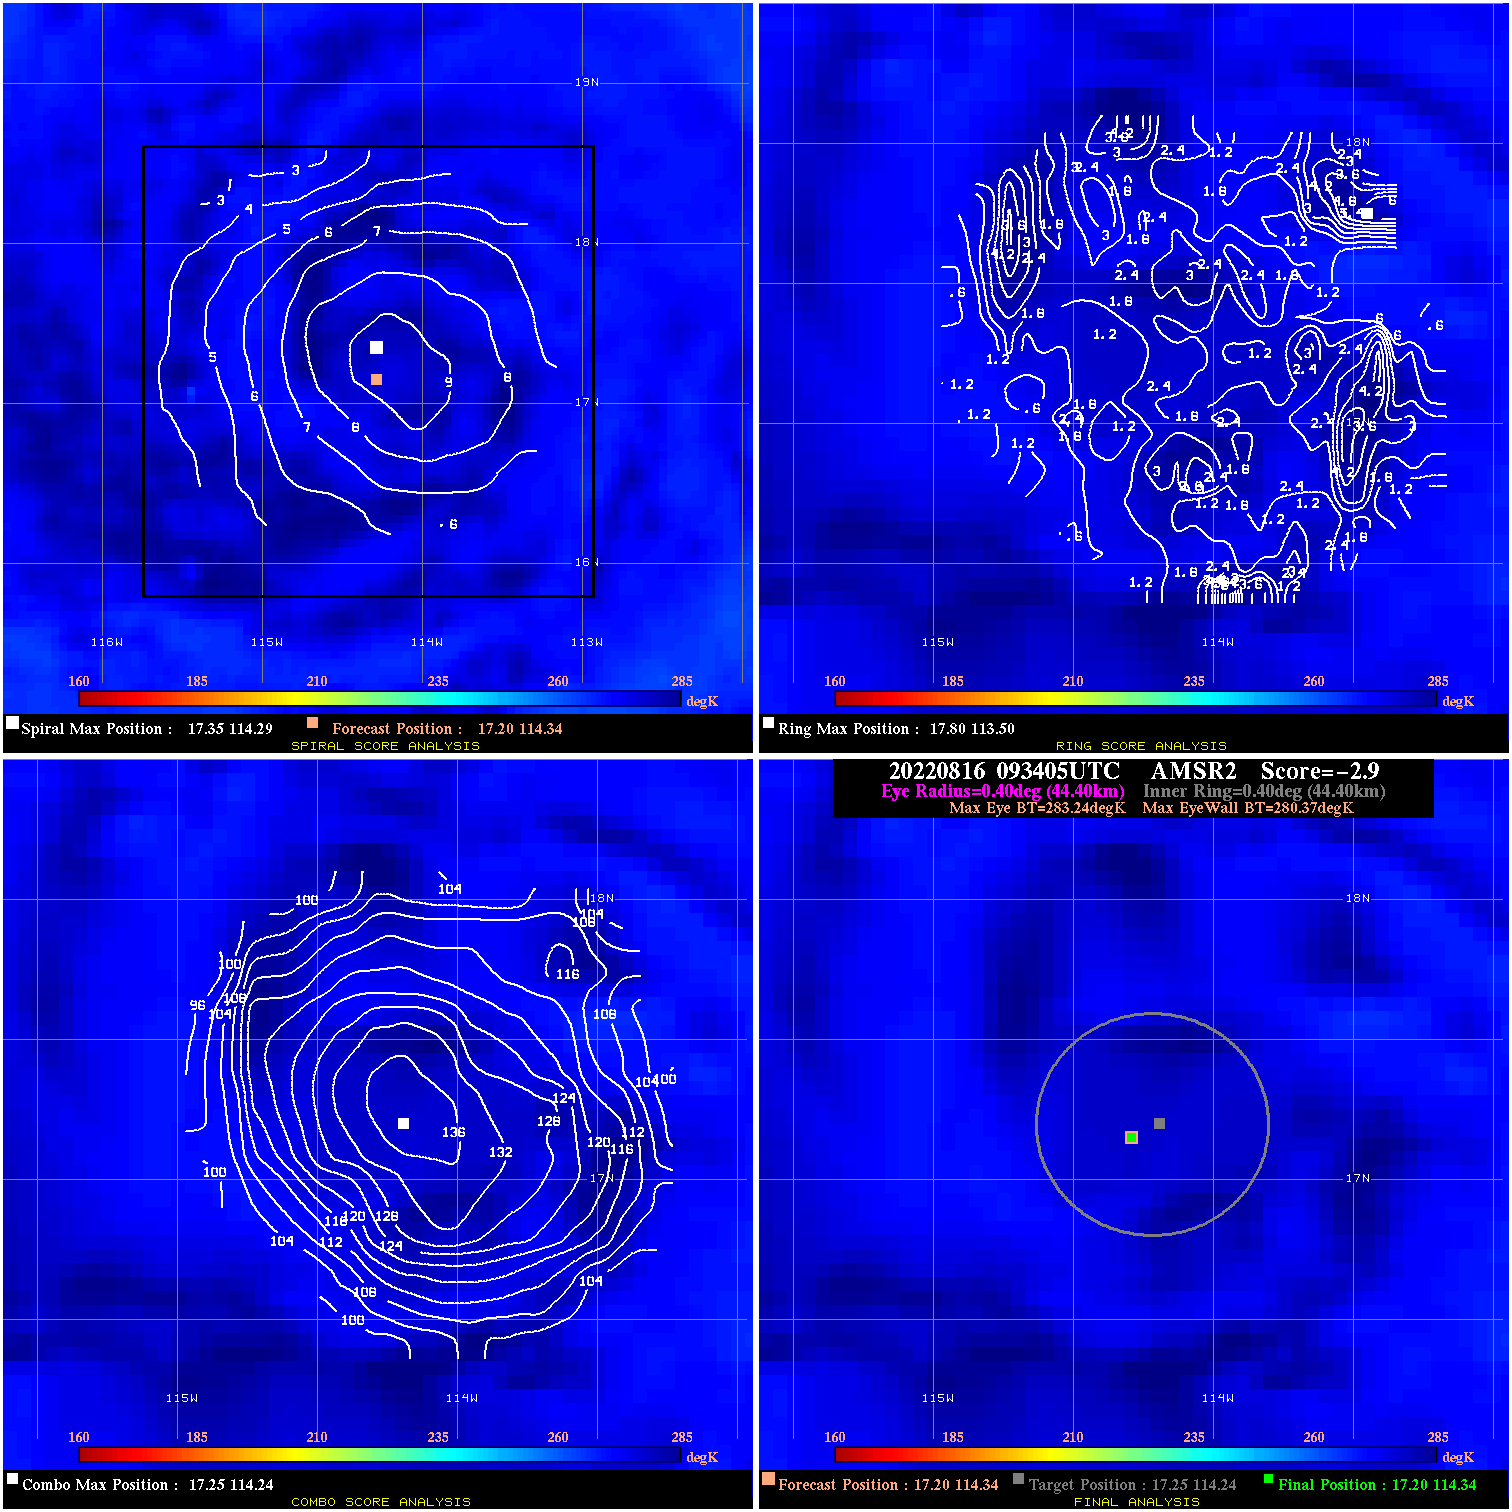
20220816 093405 -2.9 N/A N/A 88.88 2.87 30.0 AMSR2 17.2 114.3 17.2 114.3 17.3 114.2 Analysis Plot
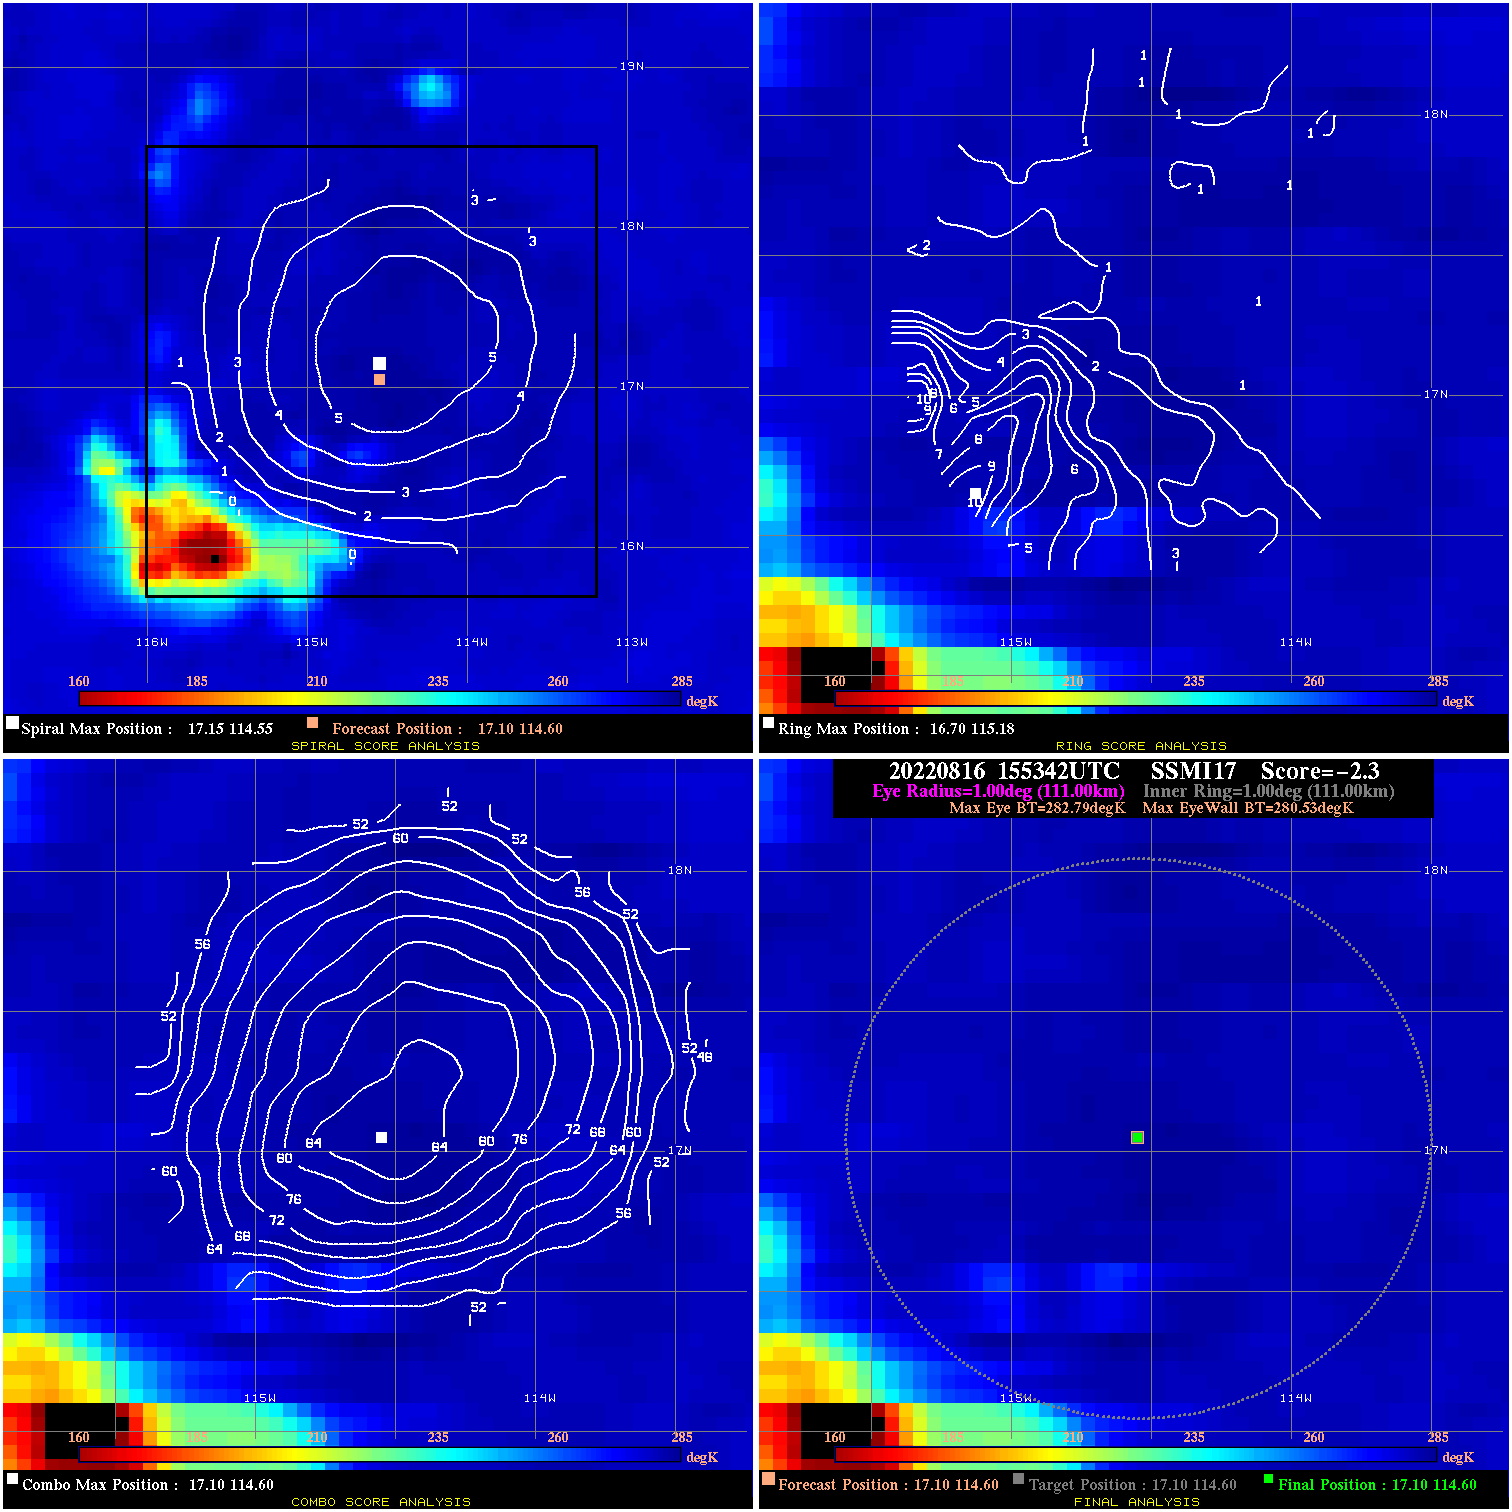
20220816 155342 -2.3 N/A 5.5% 222.20 2.26 30.0 SSMI17 17.1 114.6 17.1 114.6 17.1 114.6 Analysis Plot
|
|
Legend: - Date/Time are determined from PMW imagery at Forecast (initial guess) Lat/Lon position. - Positive/Negative Latitude = North/South Hemisphere; Longitude = Western/Eastern Hemisphere. - "Ring Diam" value indicates the estimated surface eyewall diameter in km (the MI eyewall edge diameter minus 10 km). - "Ring Pct" is the percentage of the "ring" (eyewall inner boundary) that is 1) colder than the "hot spot" (warmest eye pixel) in the eye by 20K, or 2) the percentage that is a) colder than 232K and b) colder than the "hot spot" by 10K, whichever is greater. - Values are red if Ring % <= 65, yellow/brown if Ring % <= 85 and green if Ring % > 85. - "Tb diff" is the difference between the "hot spot" (warmest eye pixel) and the warmest pixel on the eyewall. - Intensity score are listed as negative, and not used, when the JTWC or NHC estimated Vmax is <55 kts in order to rule out weak but highly symmetric TCs. - Error messages in intensity scores: -920 is used when the hottest pixel in the eye is <200K, to prevent false positives; -930 means <85% of eyewall has observations/data. |