Tropical Storm 15W
|
Passive Microwave (PMW) Intensity Information Hurricane Intensity Estimation (HIE) Algorithm Version 9.0 |
Overpass Inten Ring Ring Wind Forecast Final Target
Date Time Score Meaning Pct Diam BTdiff Est Sat Lat Lon Lat Lon Lat Lon
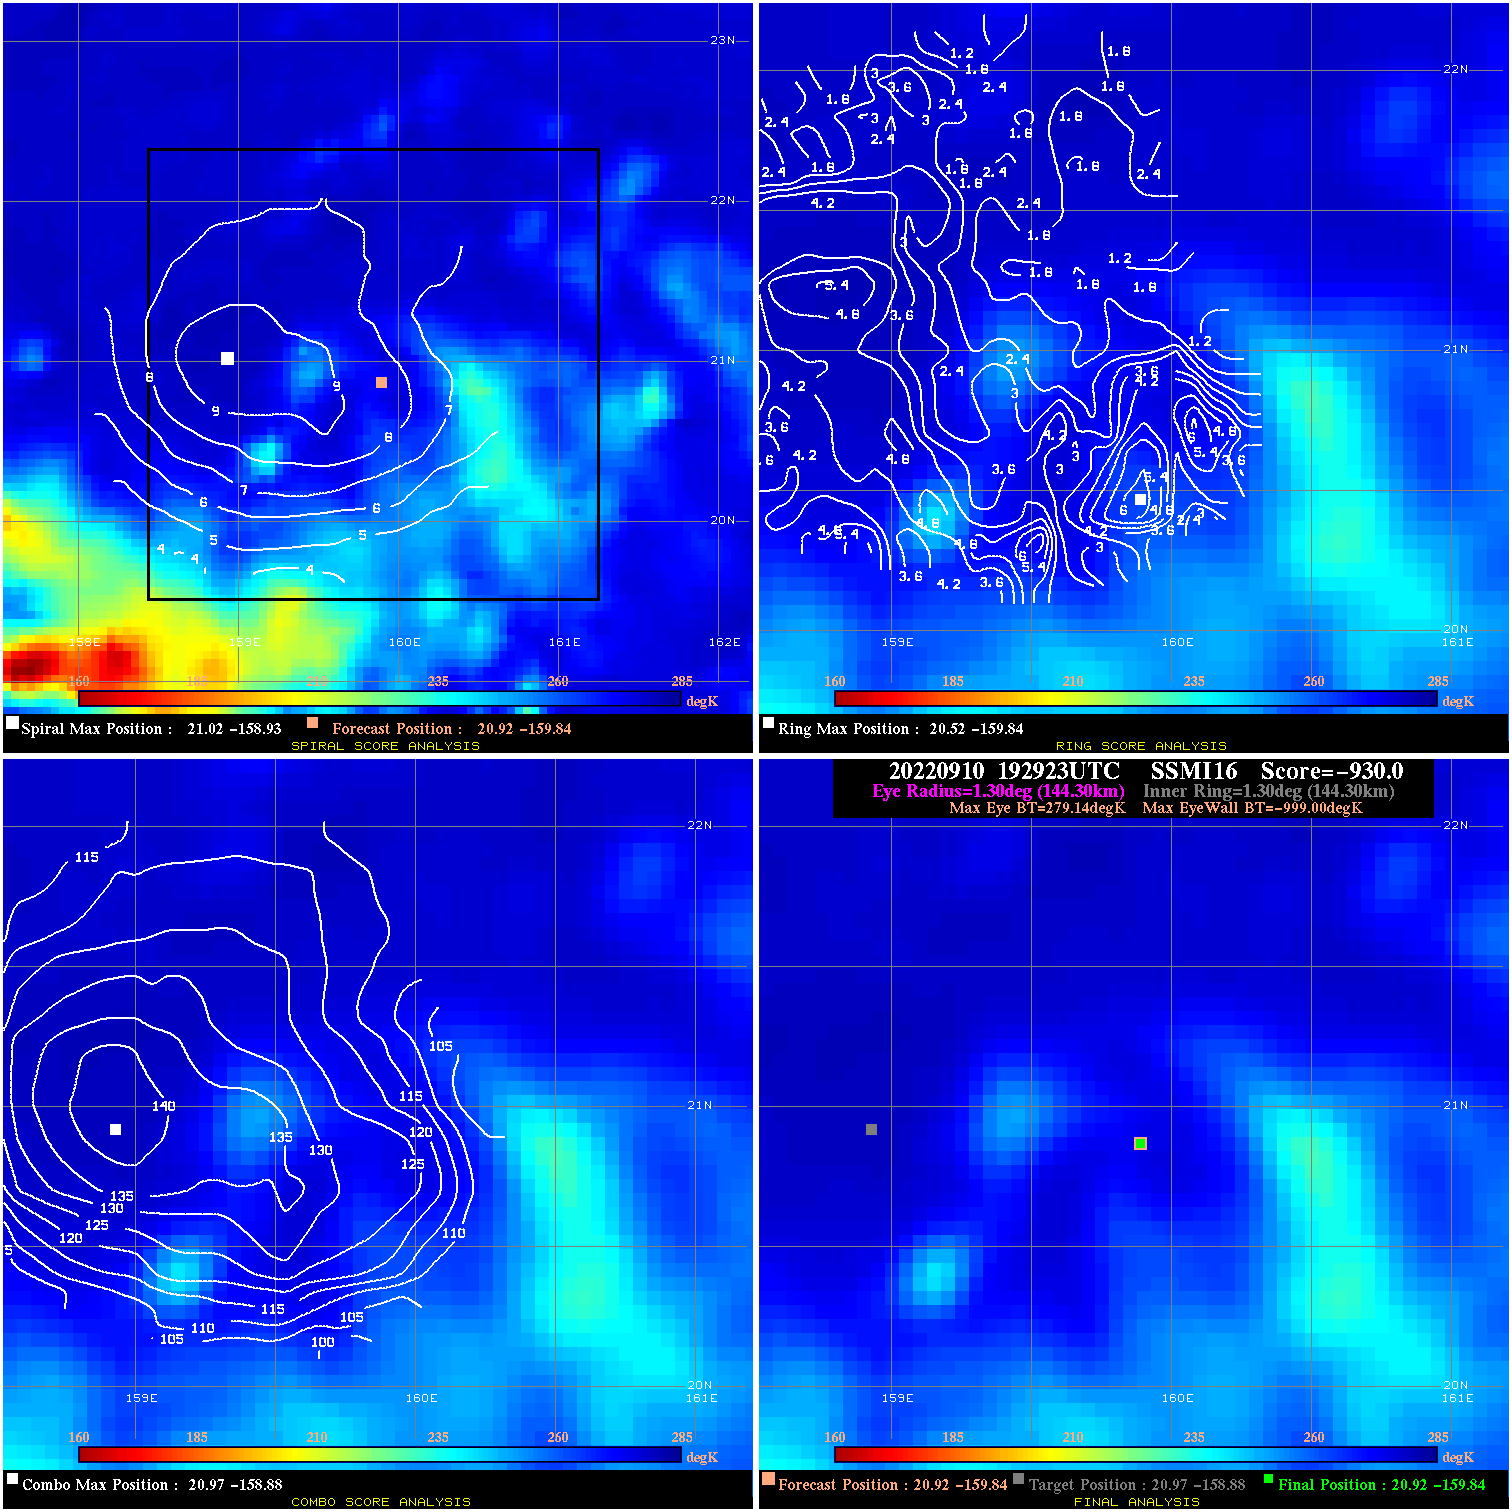
20220910 192923 -930.0 N/A N/A N/A 0.00 30.0 SSMI16 20.9 -159.8 20.9 -159.8 21.0 -158.9 Analysis Plot
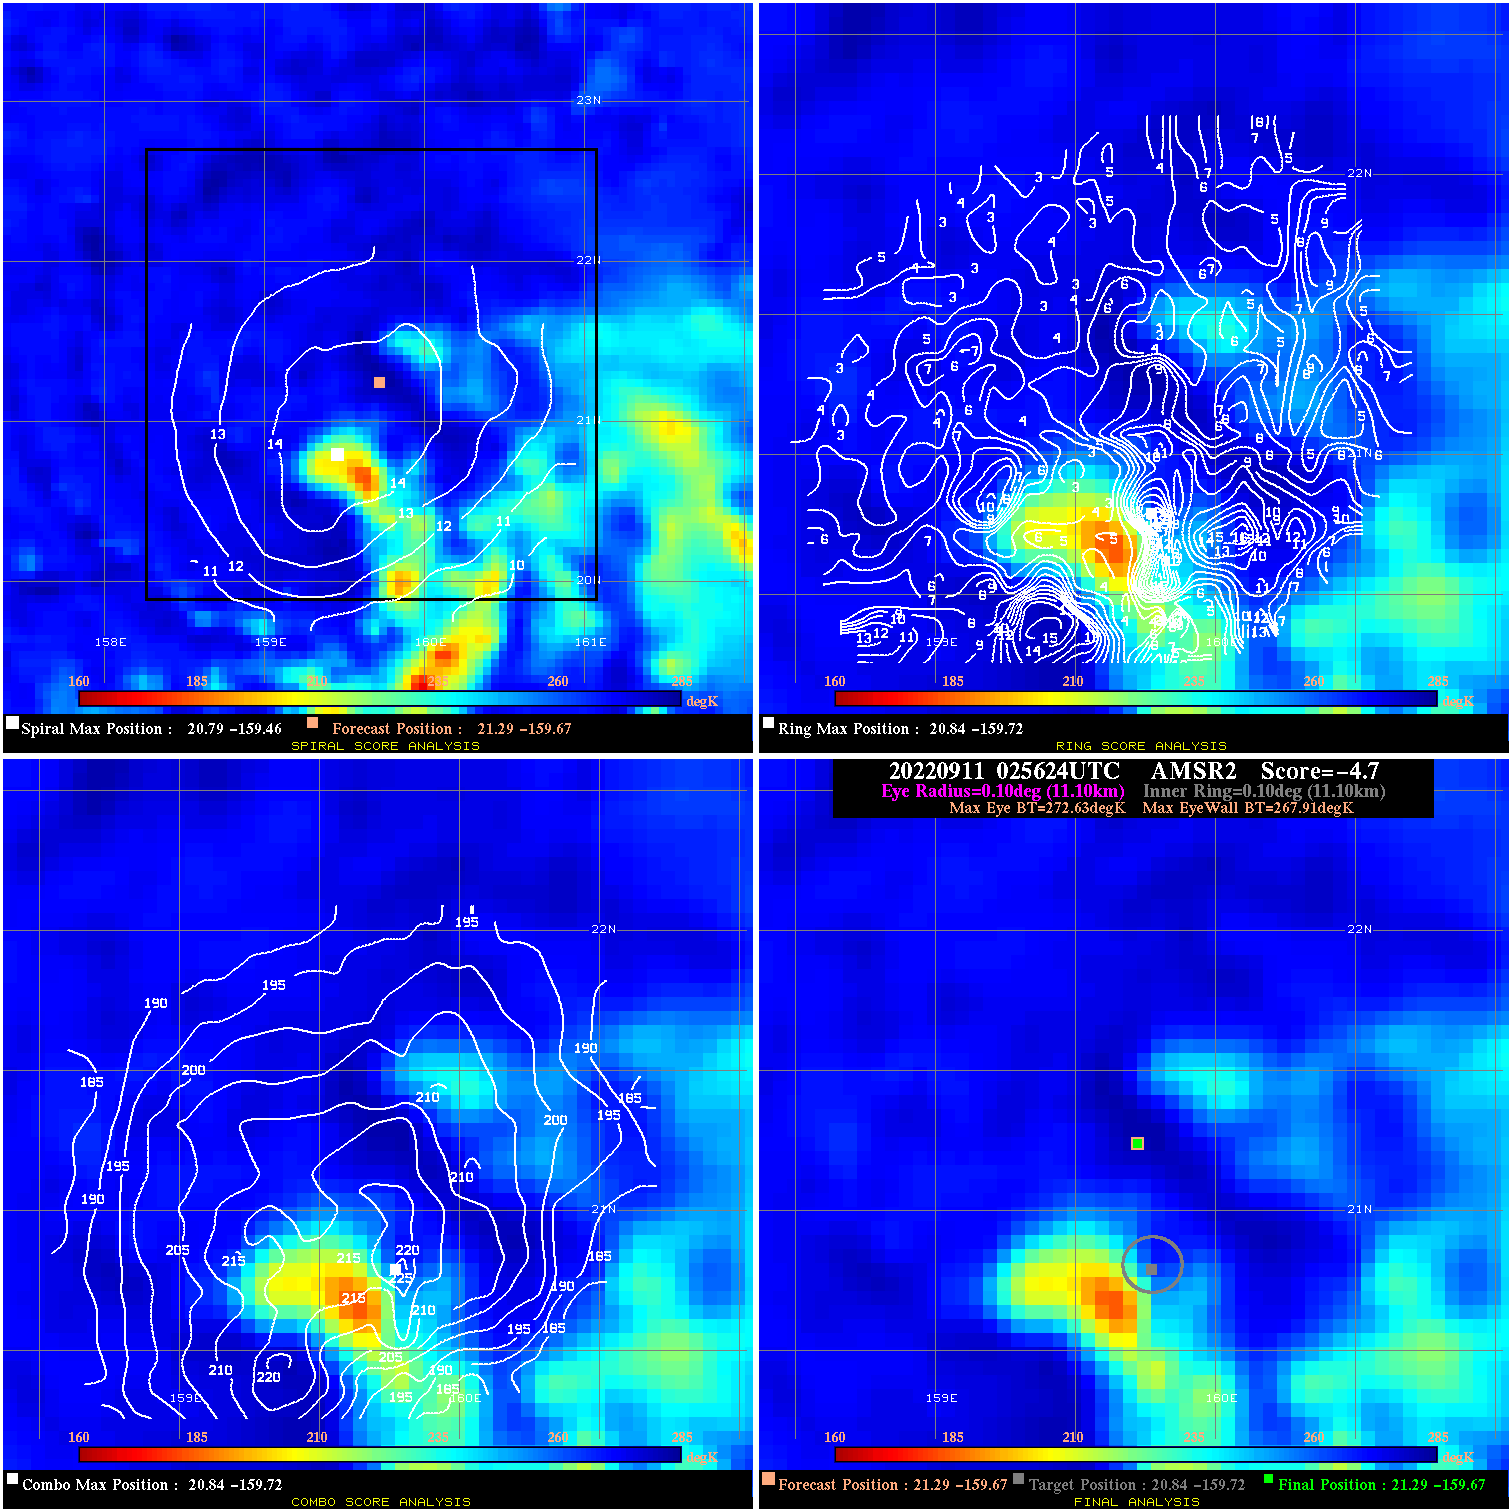
20220911 025624 -4.7 N/A 24.7% 22.22 4.72 30.0 AMSR2 21.3 -159.7 21.3 -159.7 20.8 -159.7 Analysis Plot
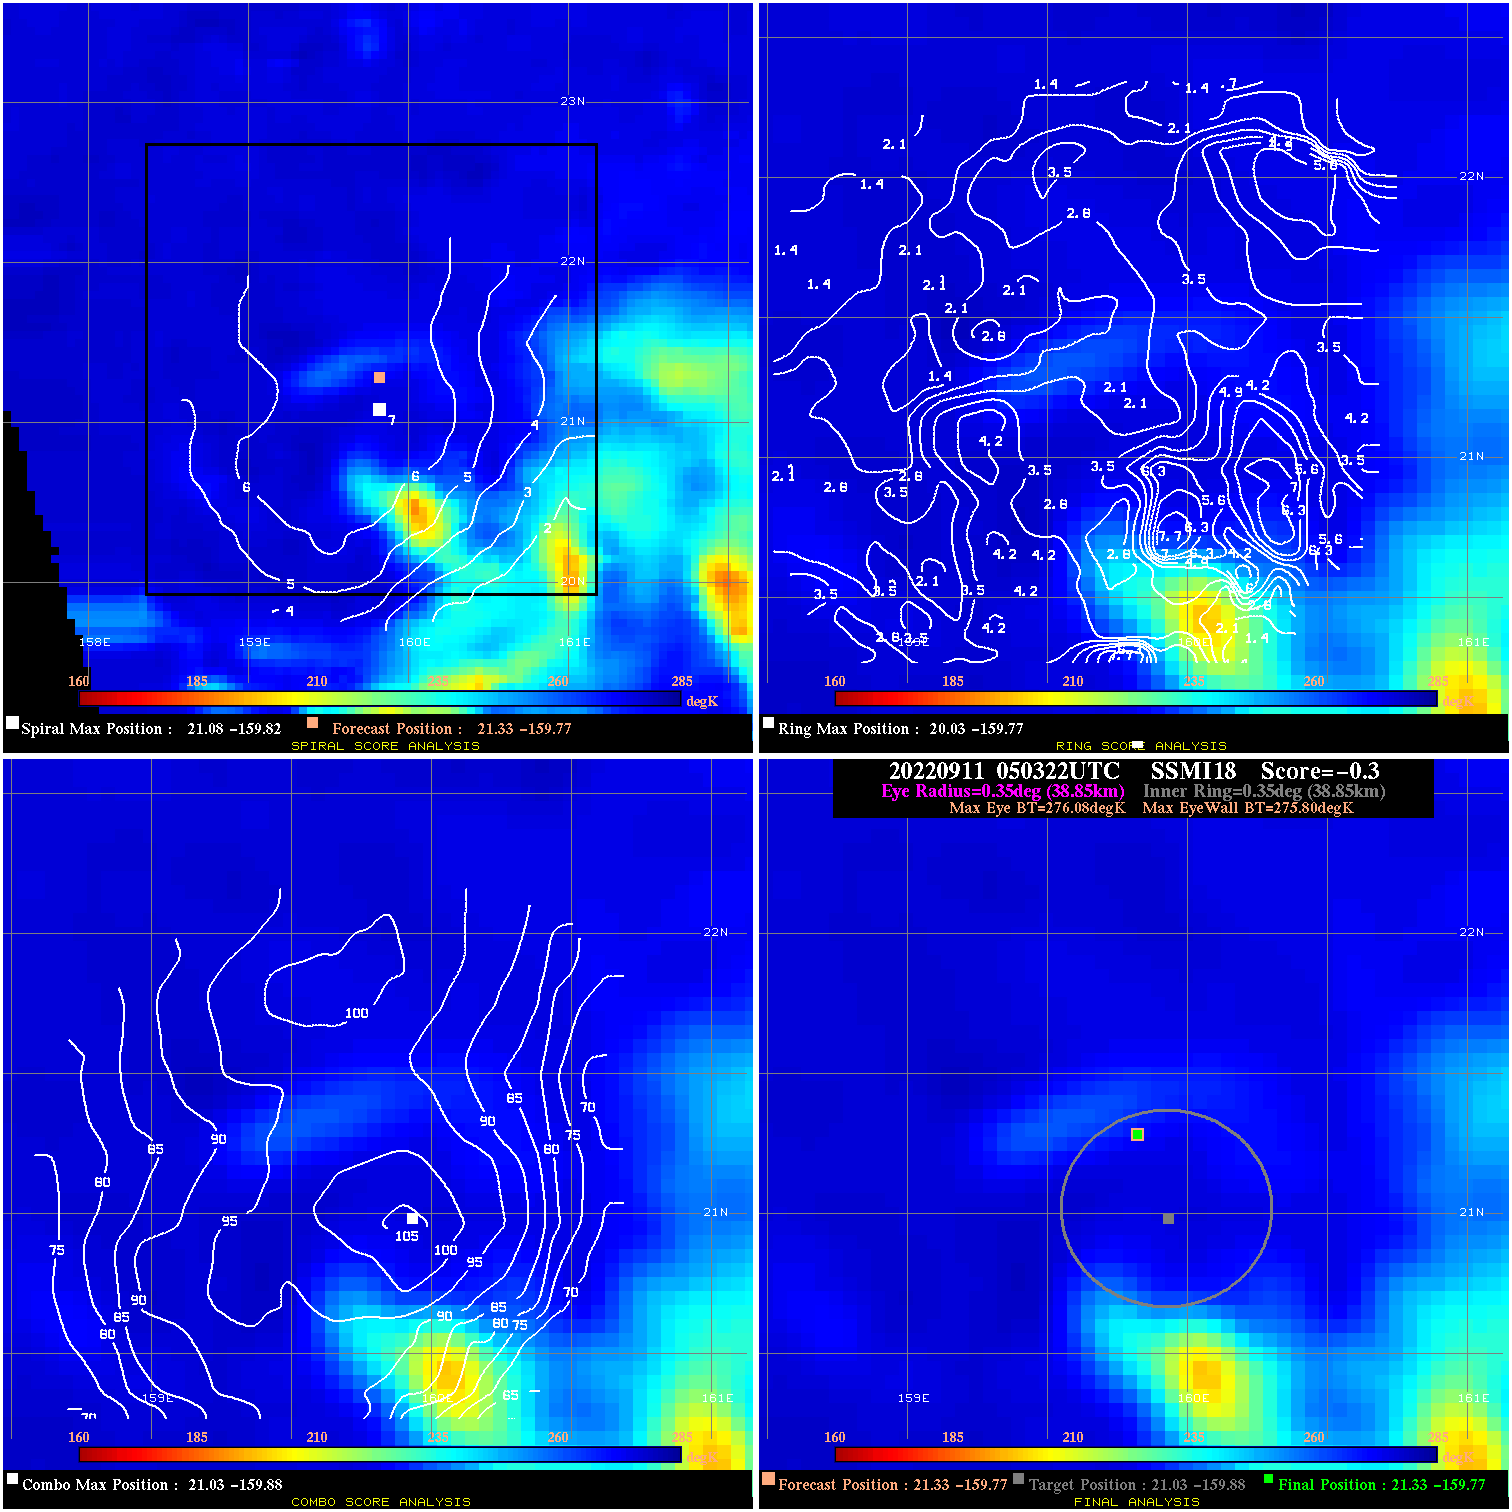
20220911 050322 -0.3 N/A N/A 77.77 .28 30.0 SSMI18 21.3 -159.8 21.3 -159.8 21.0 -159.9 Analysis Plot
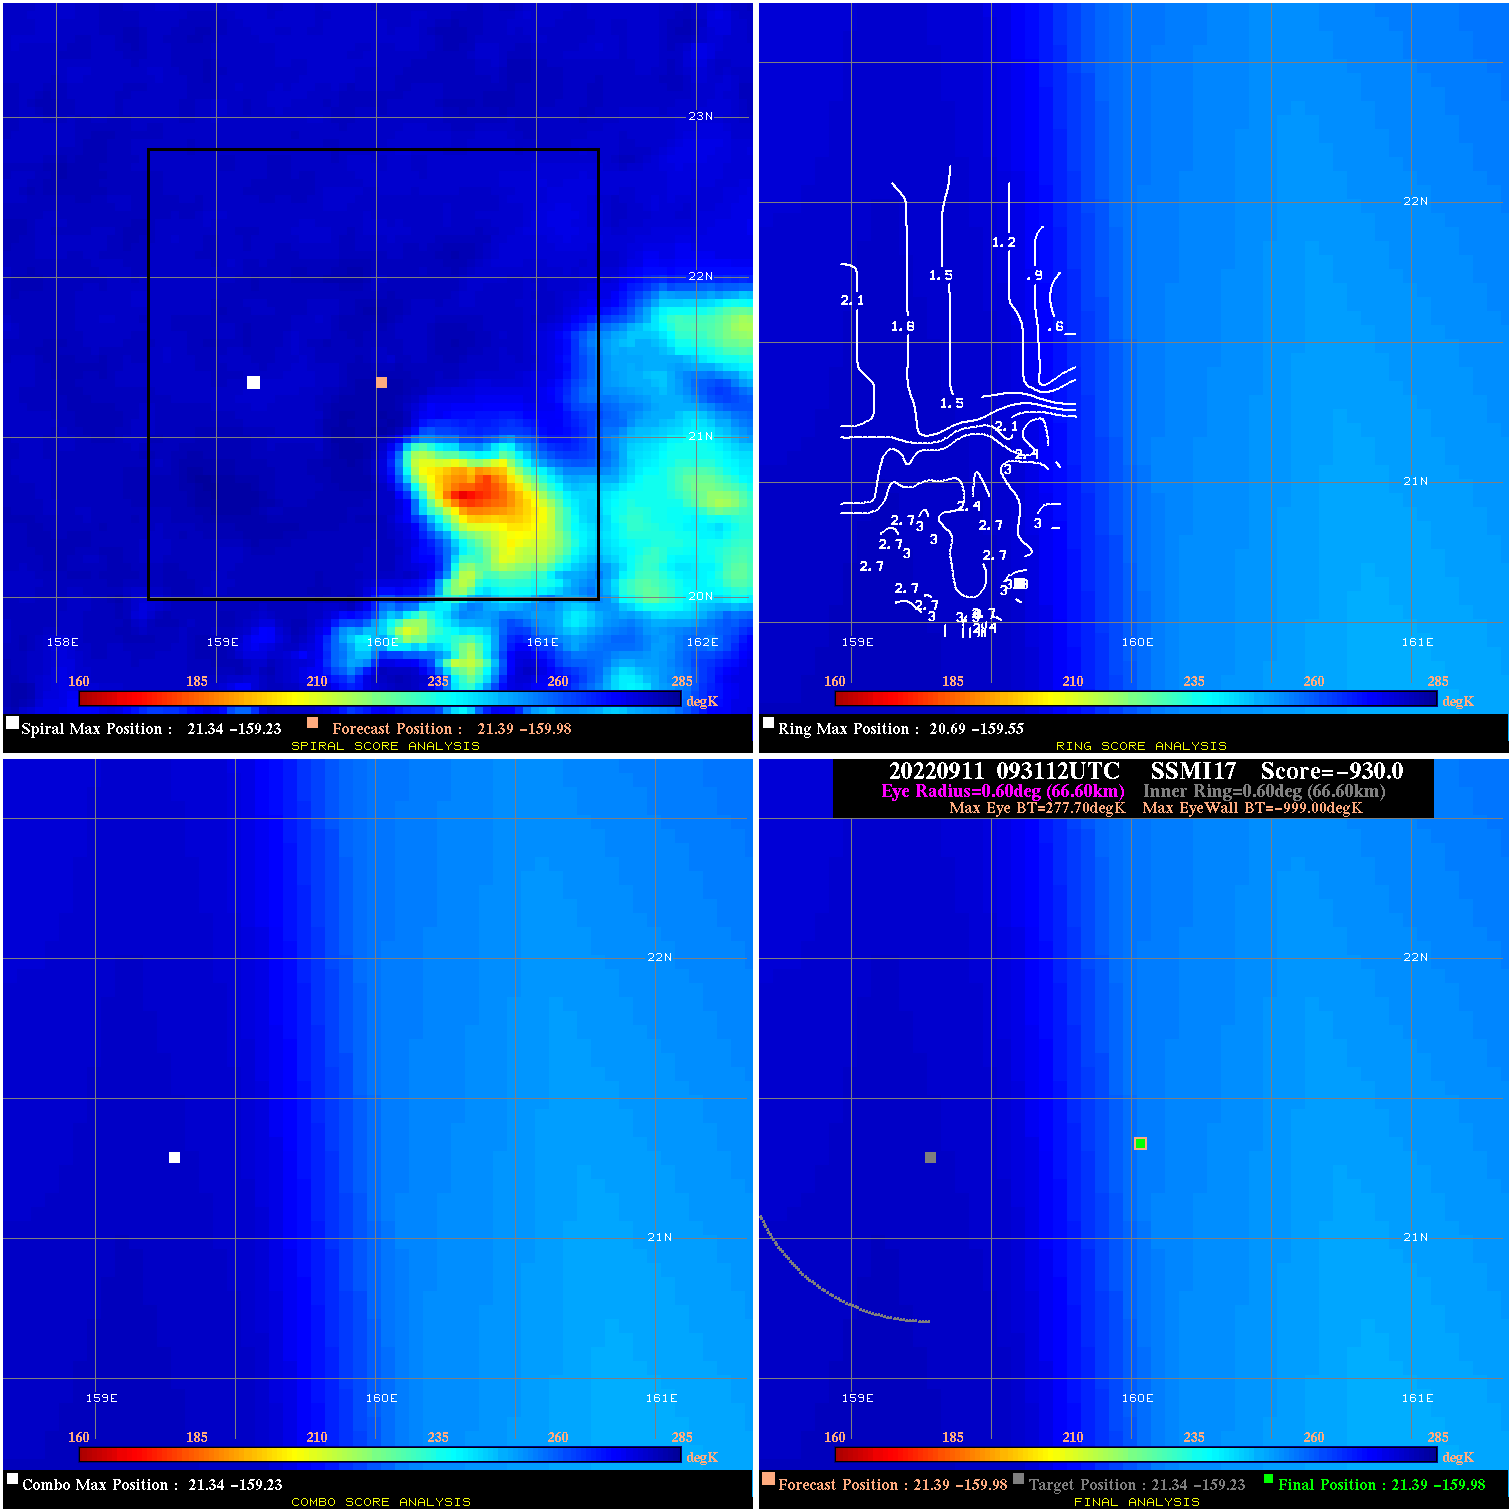
20220911 093112 -930.0 N/A N/A N/A 0.00 30.0 SSMI17 21.4 -160.0 21.4 -160.0 21.3 -159.2 Analysis Plot
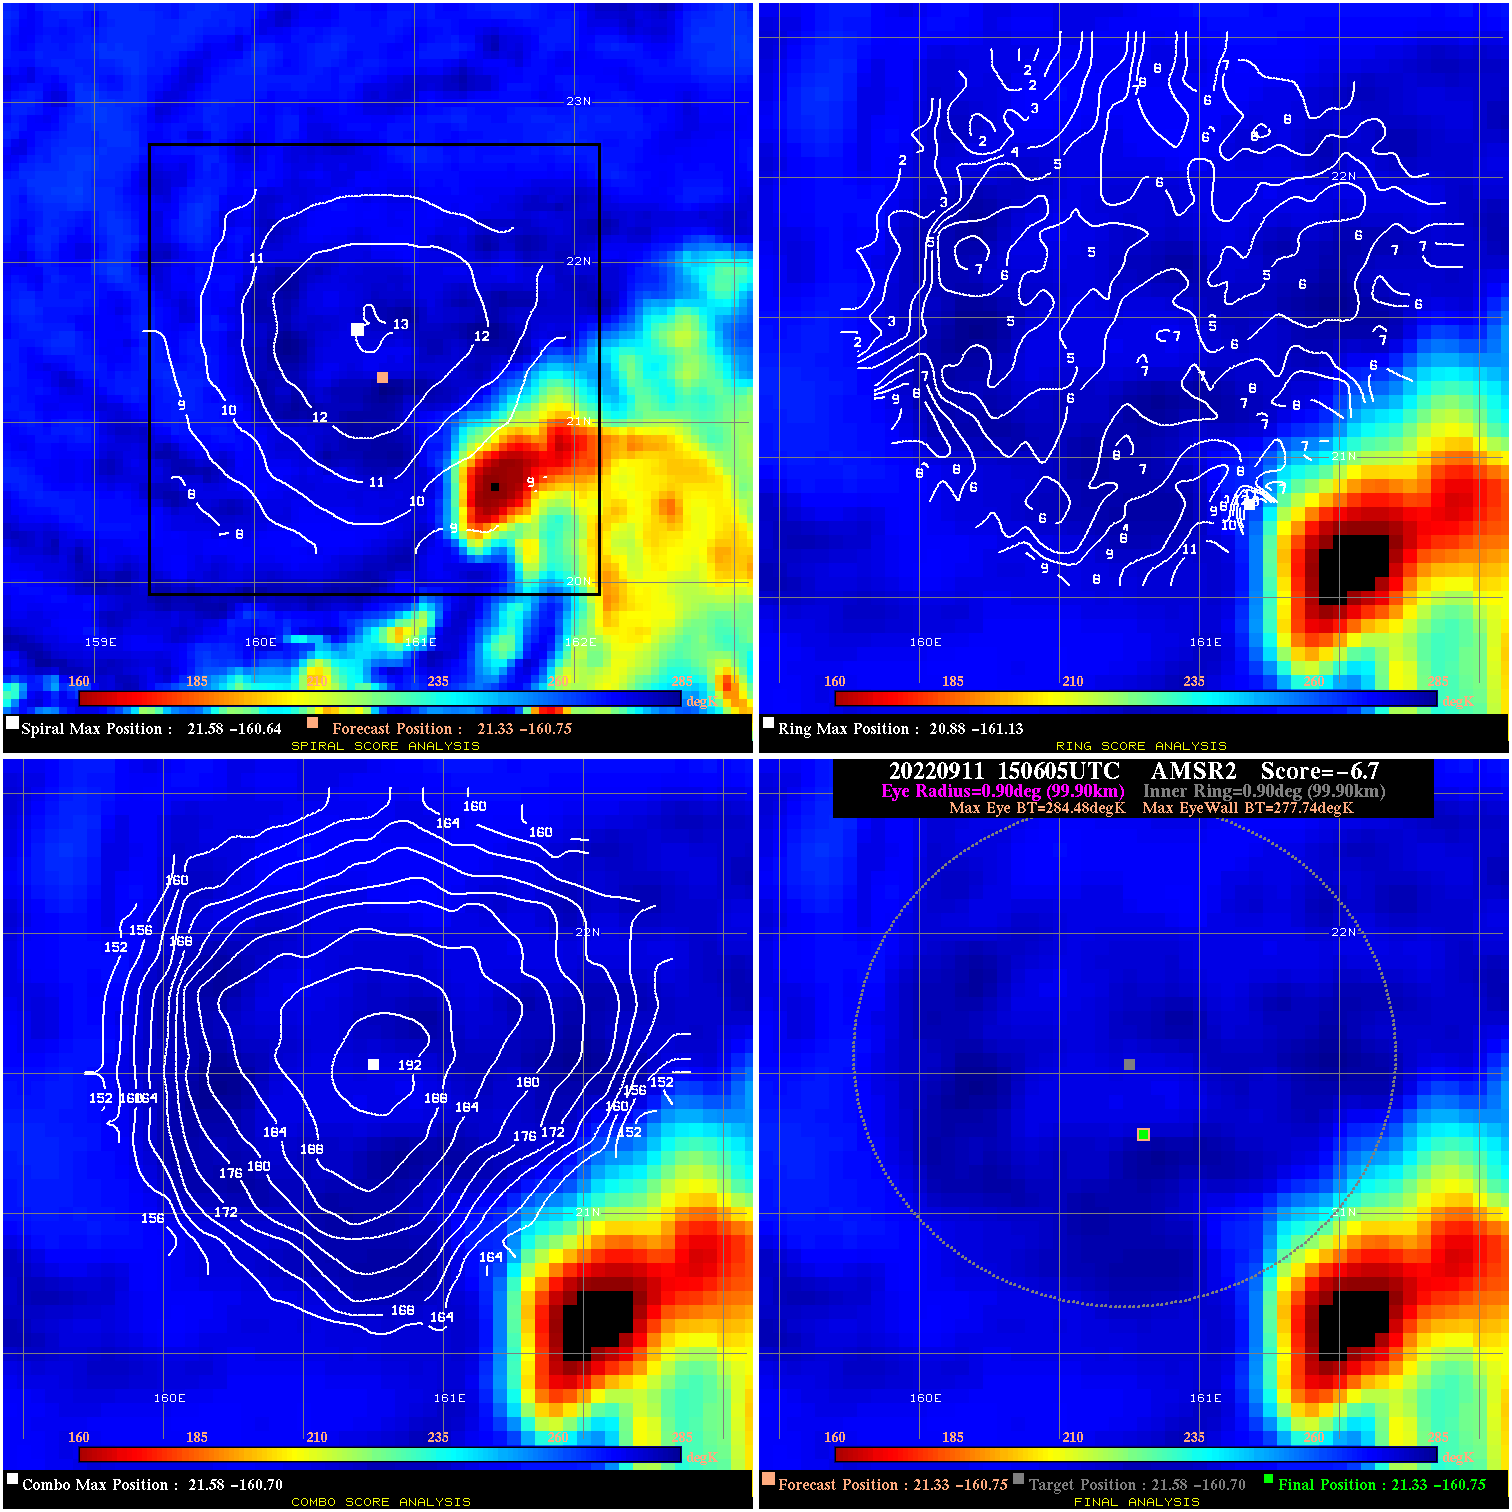
20220911 150605 -6.7 N/A 15.1% 199.98 6.74 35.0 AMSR2 21.3 -160.8 21.3 -160.8 21.6 -160.7 Analysis Plot
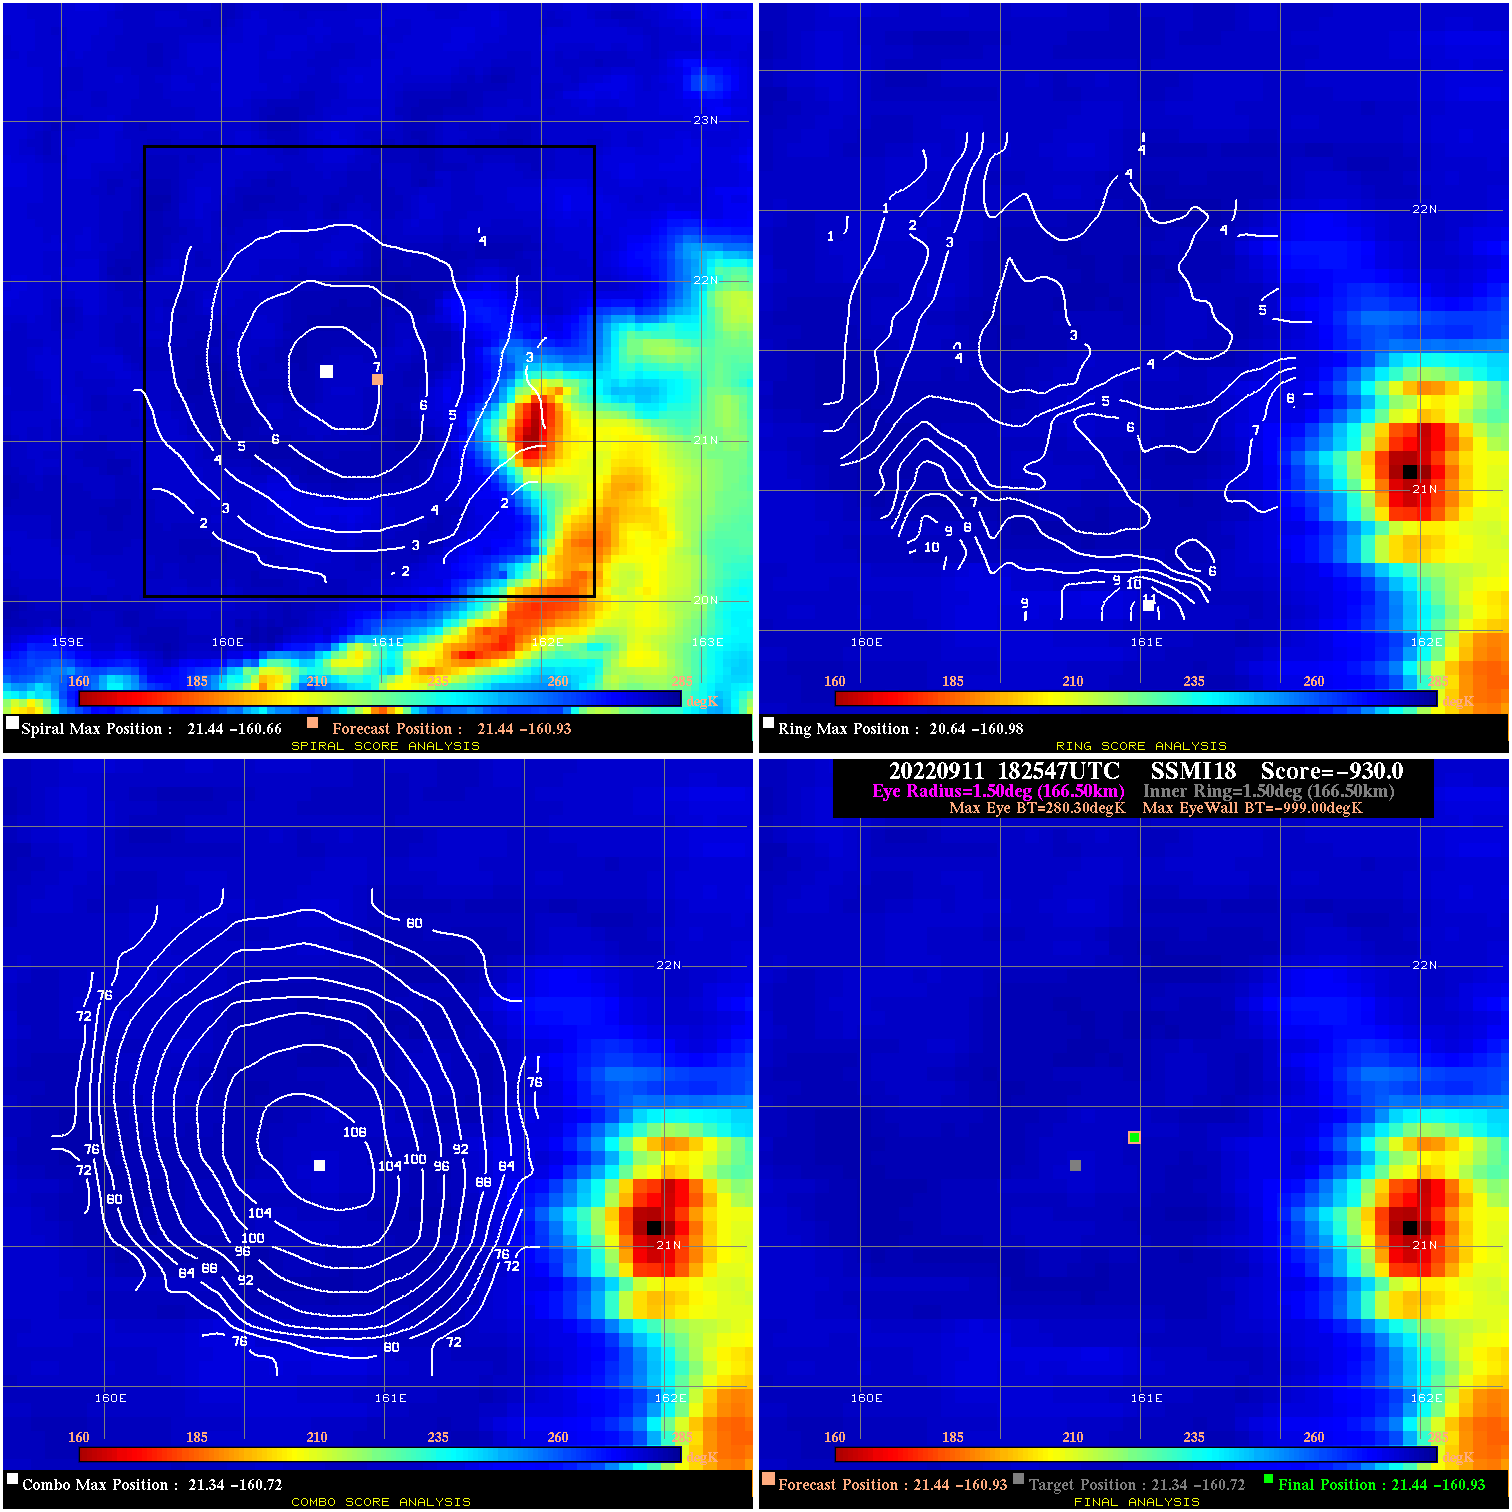
20220911 182547 -930.0 N/A N/A N/A 0.00 35.0 SSMI18 21.4 -160.9 21.4 -160.9 21.3 -160.7 Analysis Plot
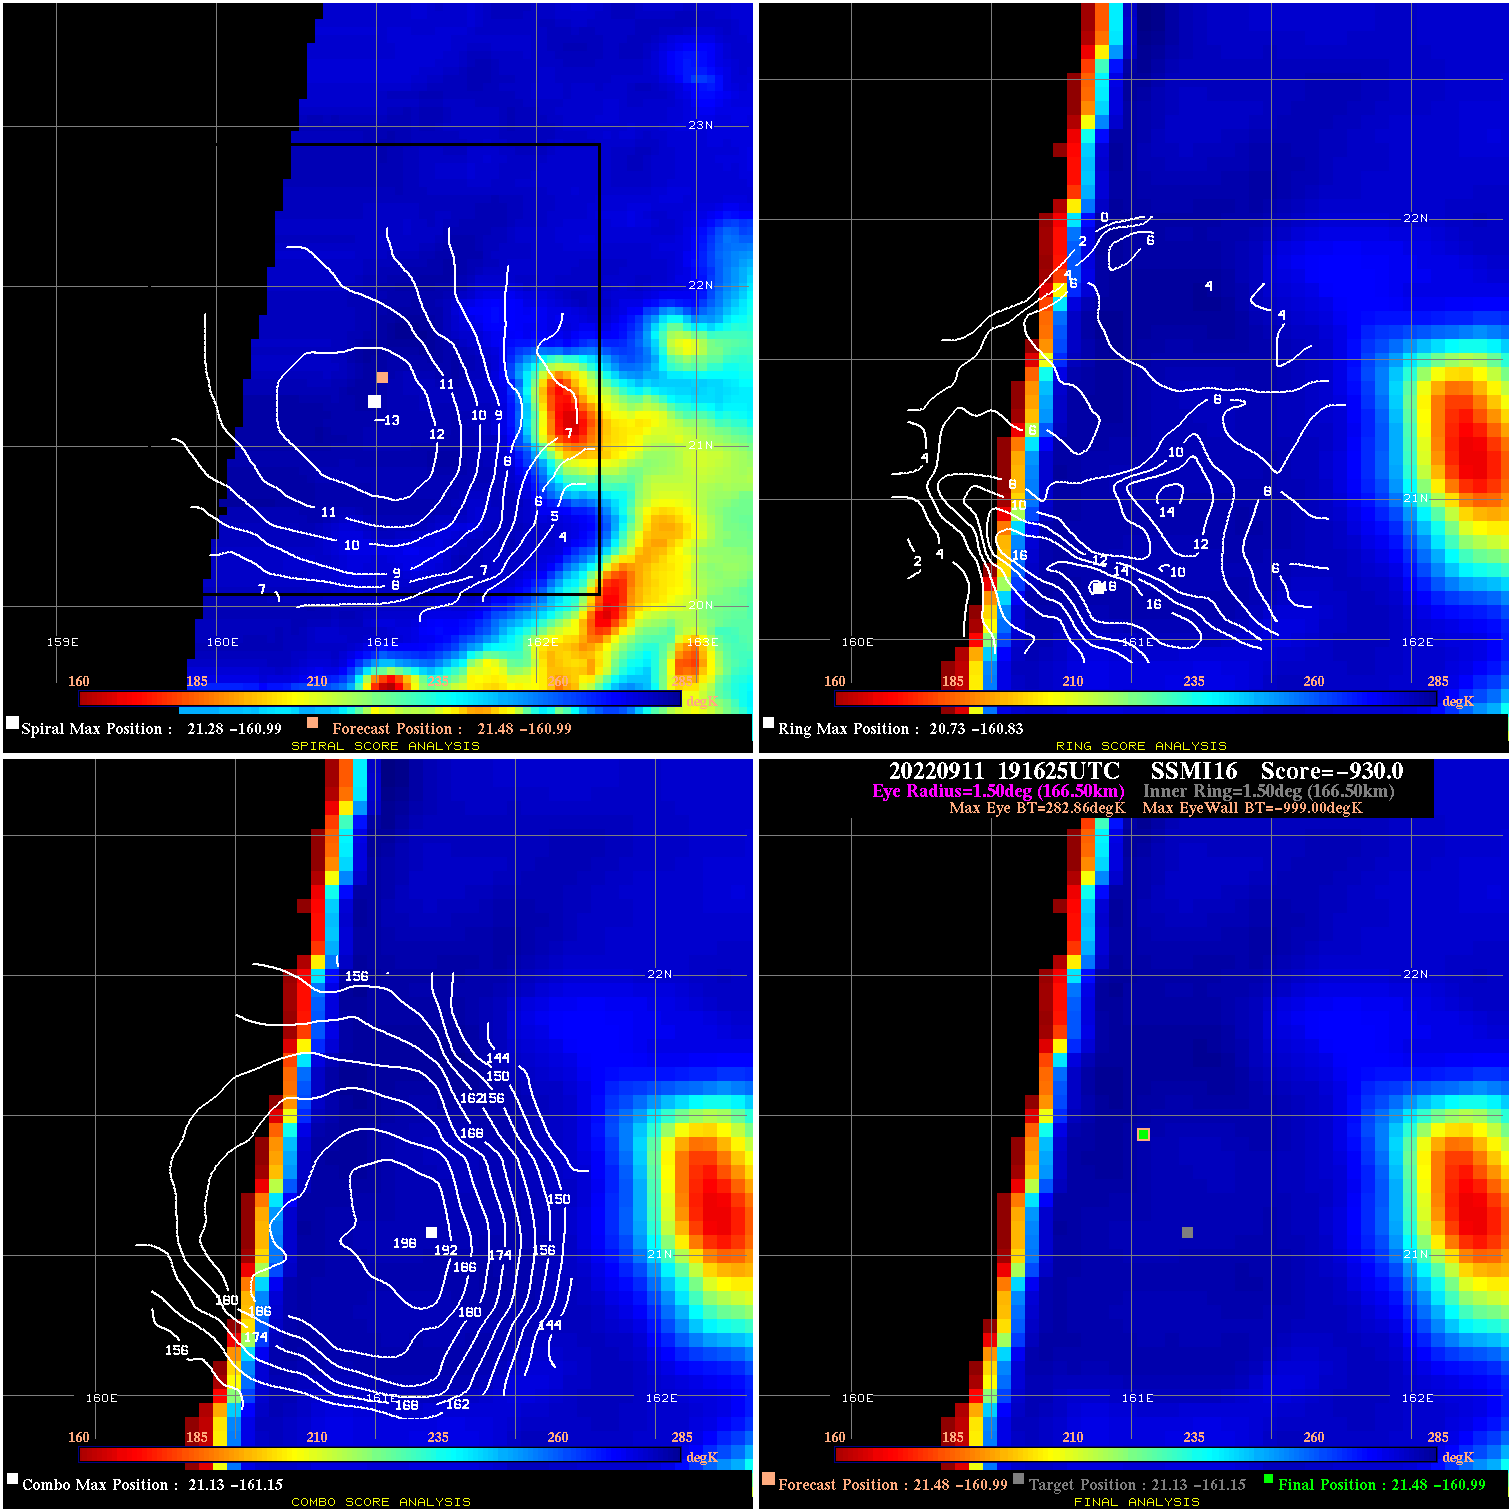
20220911 191625 -930.0 N/A N/A N/A 0.00 35.0 SSMI16 21.5 -161.0 21.5 -161.0 21.1 -161.1 Analysis Plot
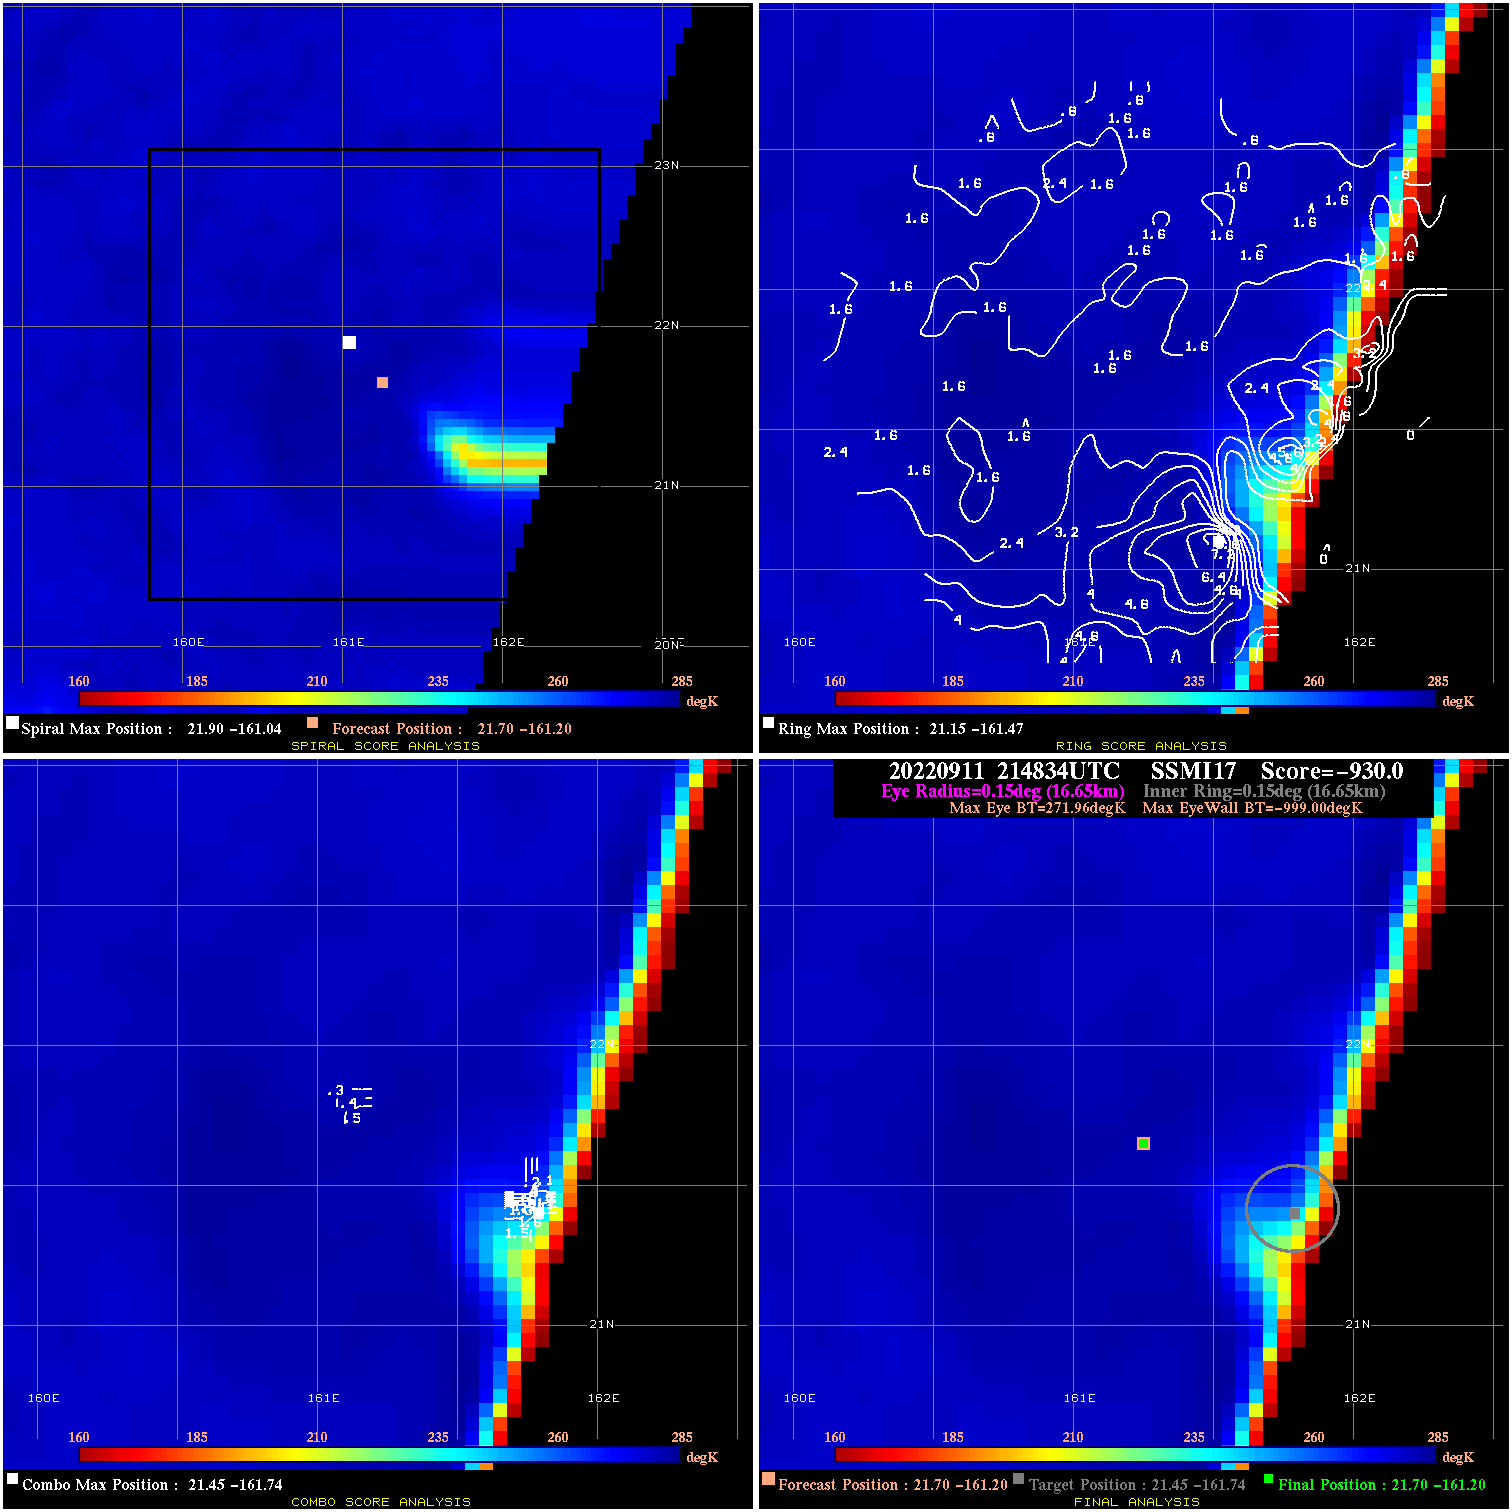
20220911 214834 -930.0 N/A N/A N/A 0.00 35.0 SSMI17 21.7 -161.2 21.7 -161.2 21.5 -161.7 Analysis Plot
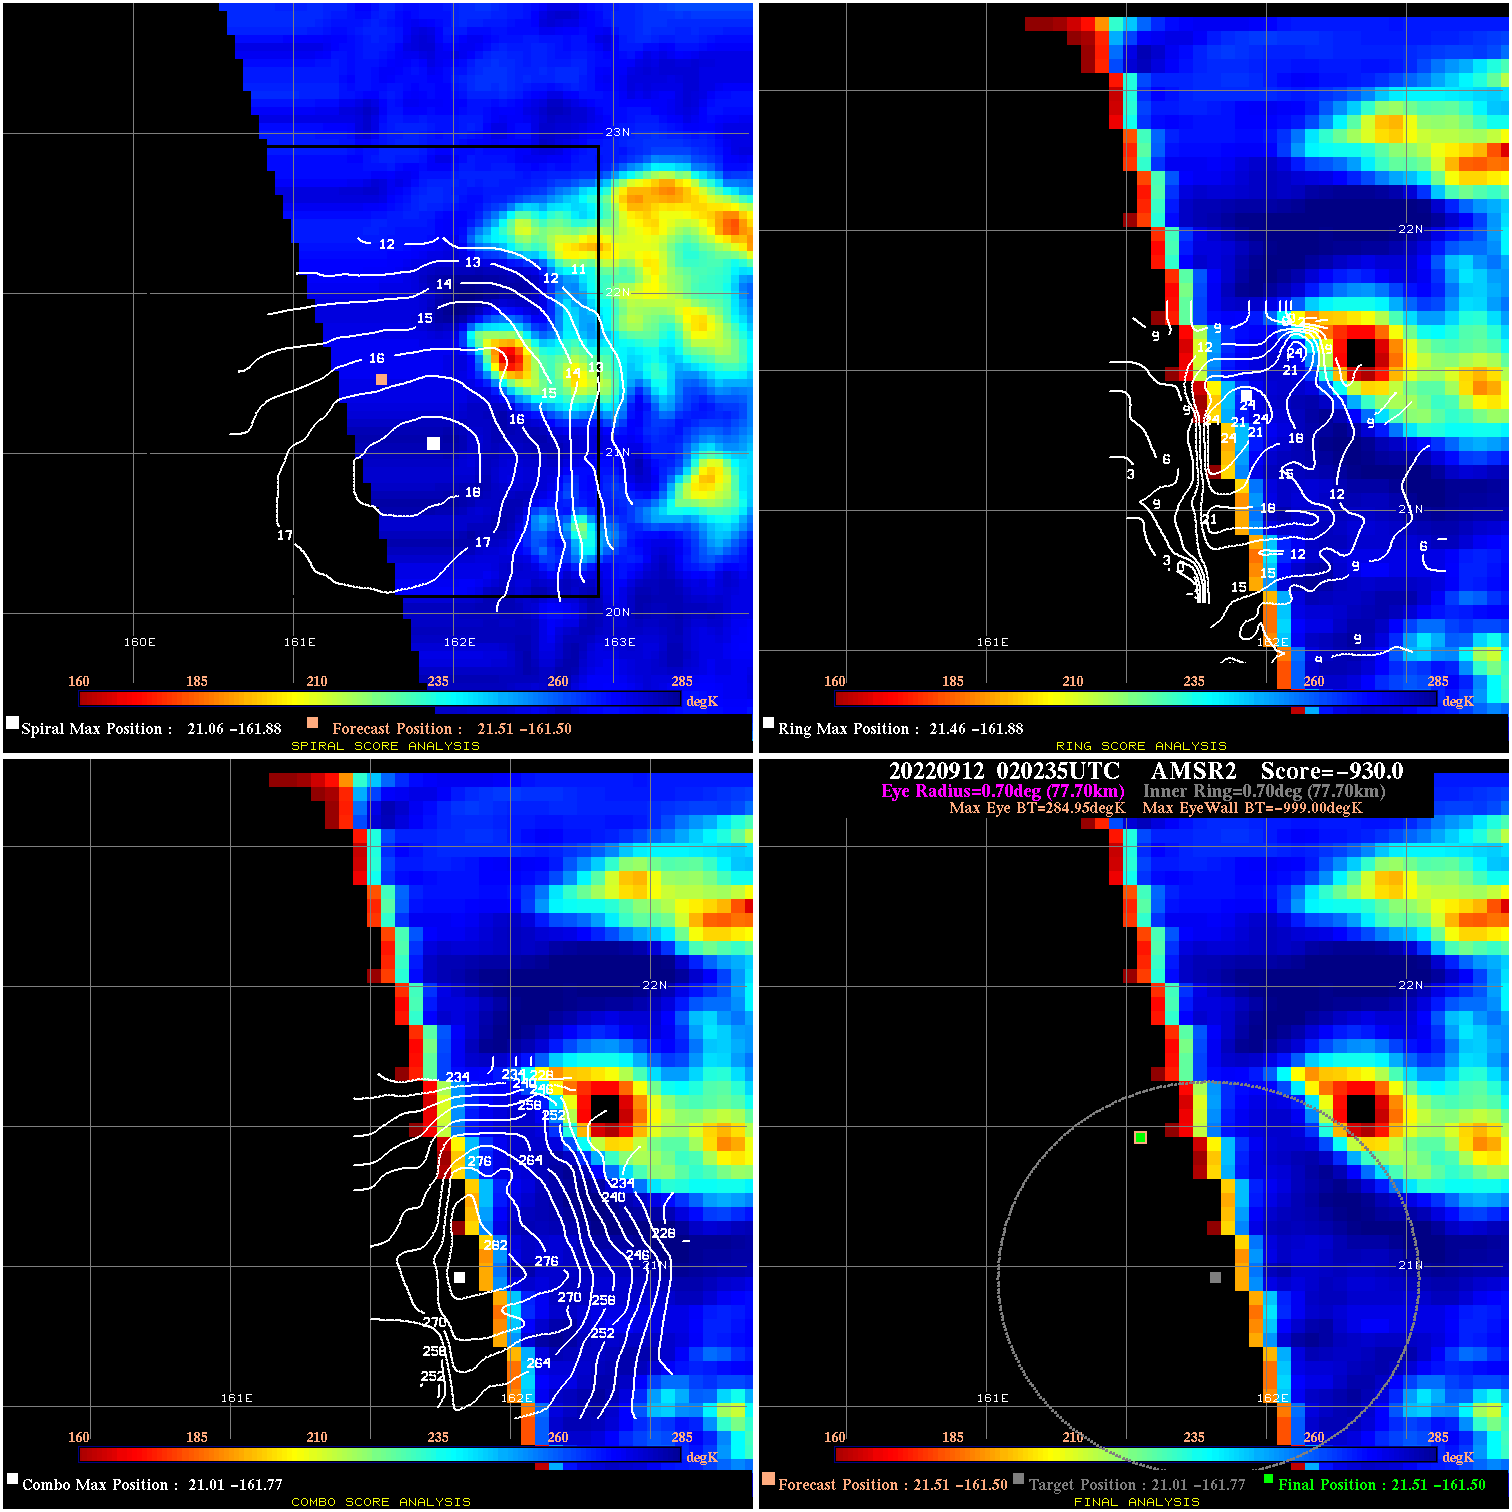
20220912 020235 -930.0 N/A N/A N/A 0.00 35.0 AMSR2 21.5 -161.5 21.5 -161.5 21.0 -161.8 Analysis Plot
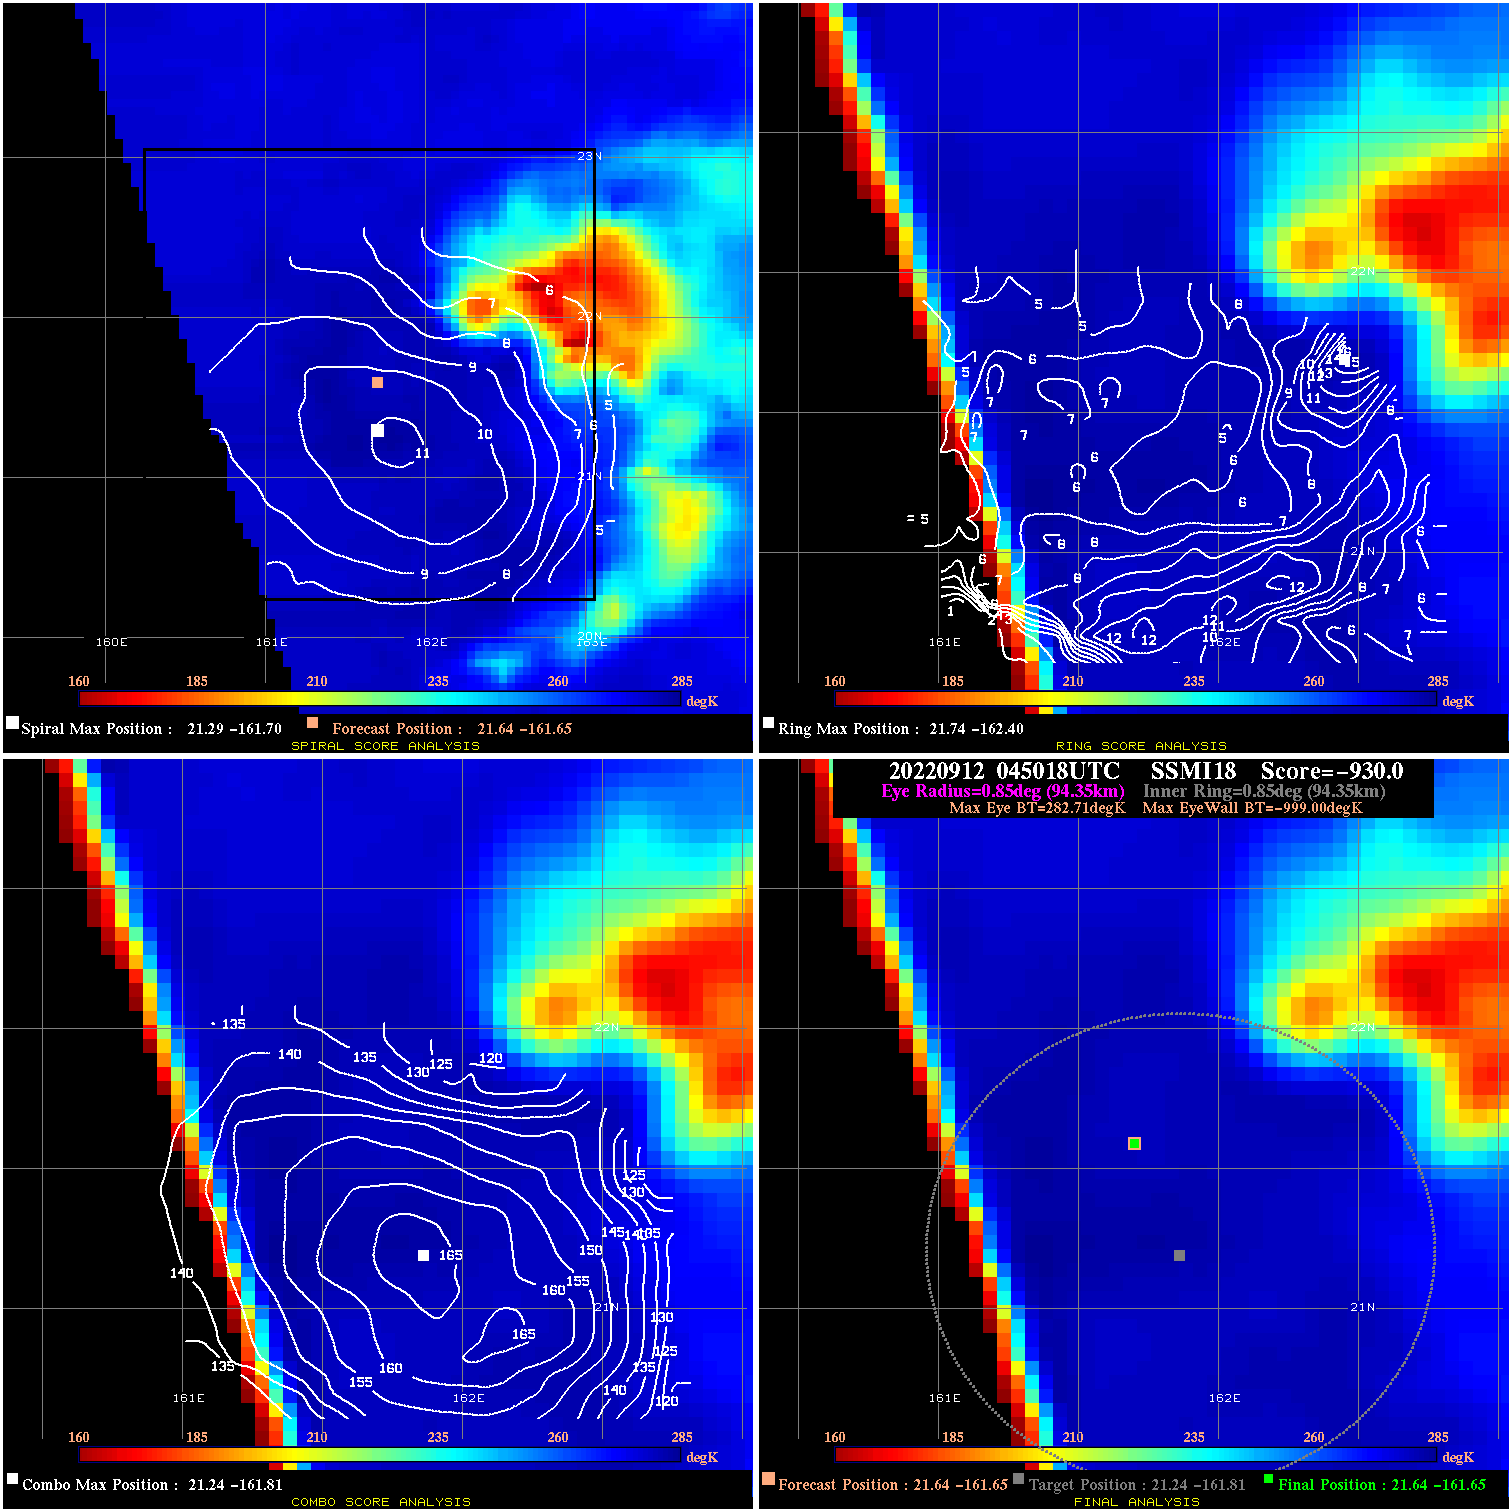
20220912 045018 -930.0 N/A N/A N/A 0.00 35.0 SSMI18 21.6 -161.6 21.6 -161.6 21.2 -161.8 Analysis Plot
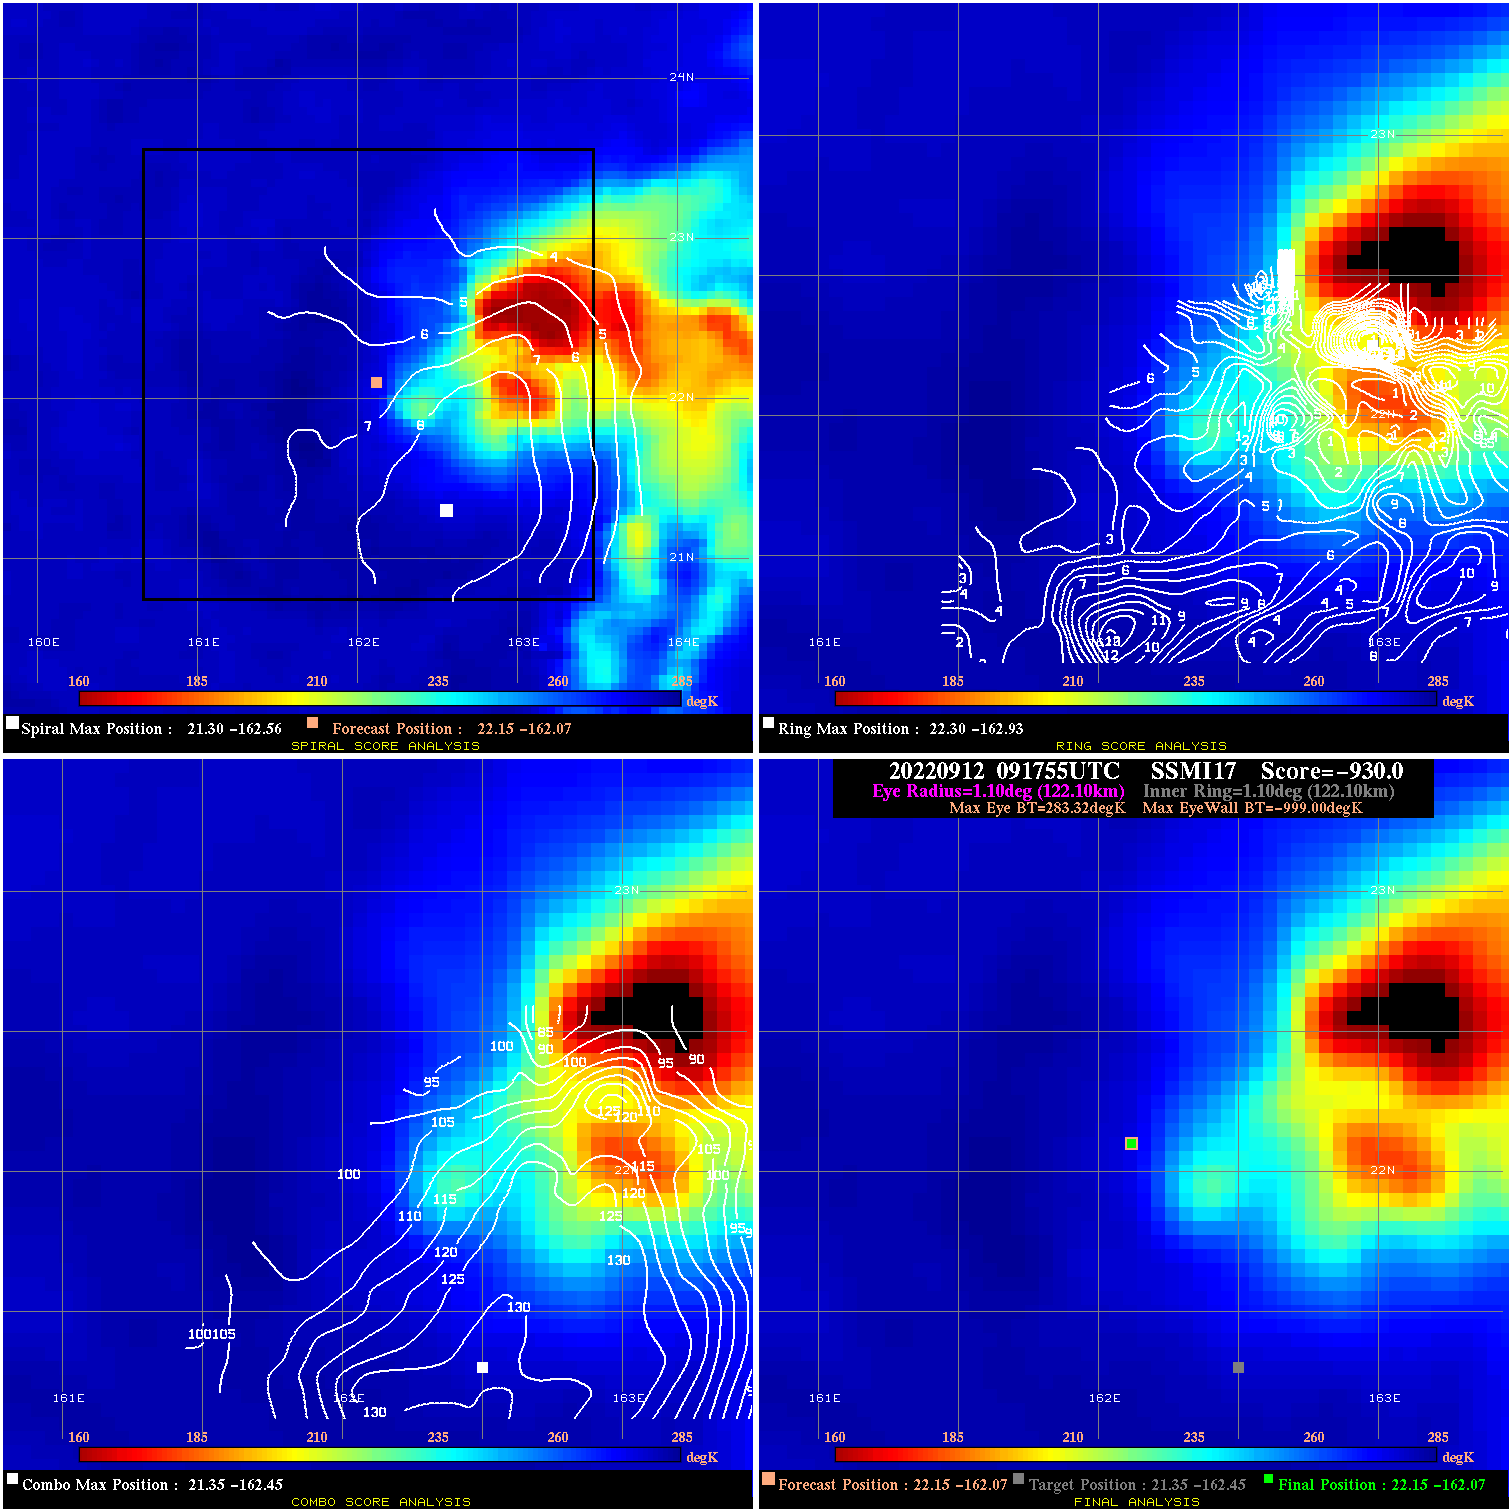
20220912 091755 -930.0 N/A N/A N/A 0.00 35.0 SSMI17 22.1 -162.1 22.1 -162.1 21.4 -162.4 Analysis Plot
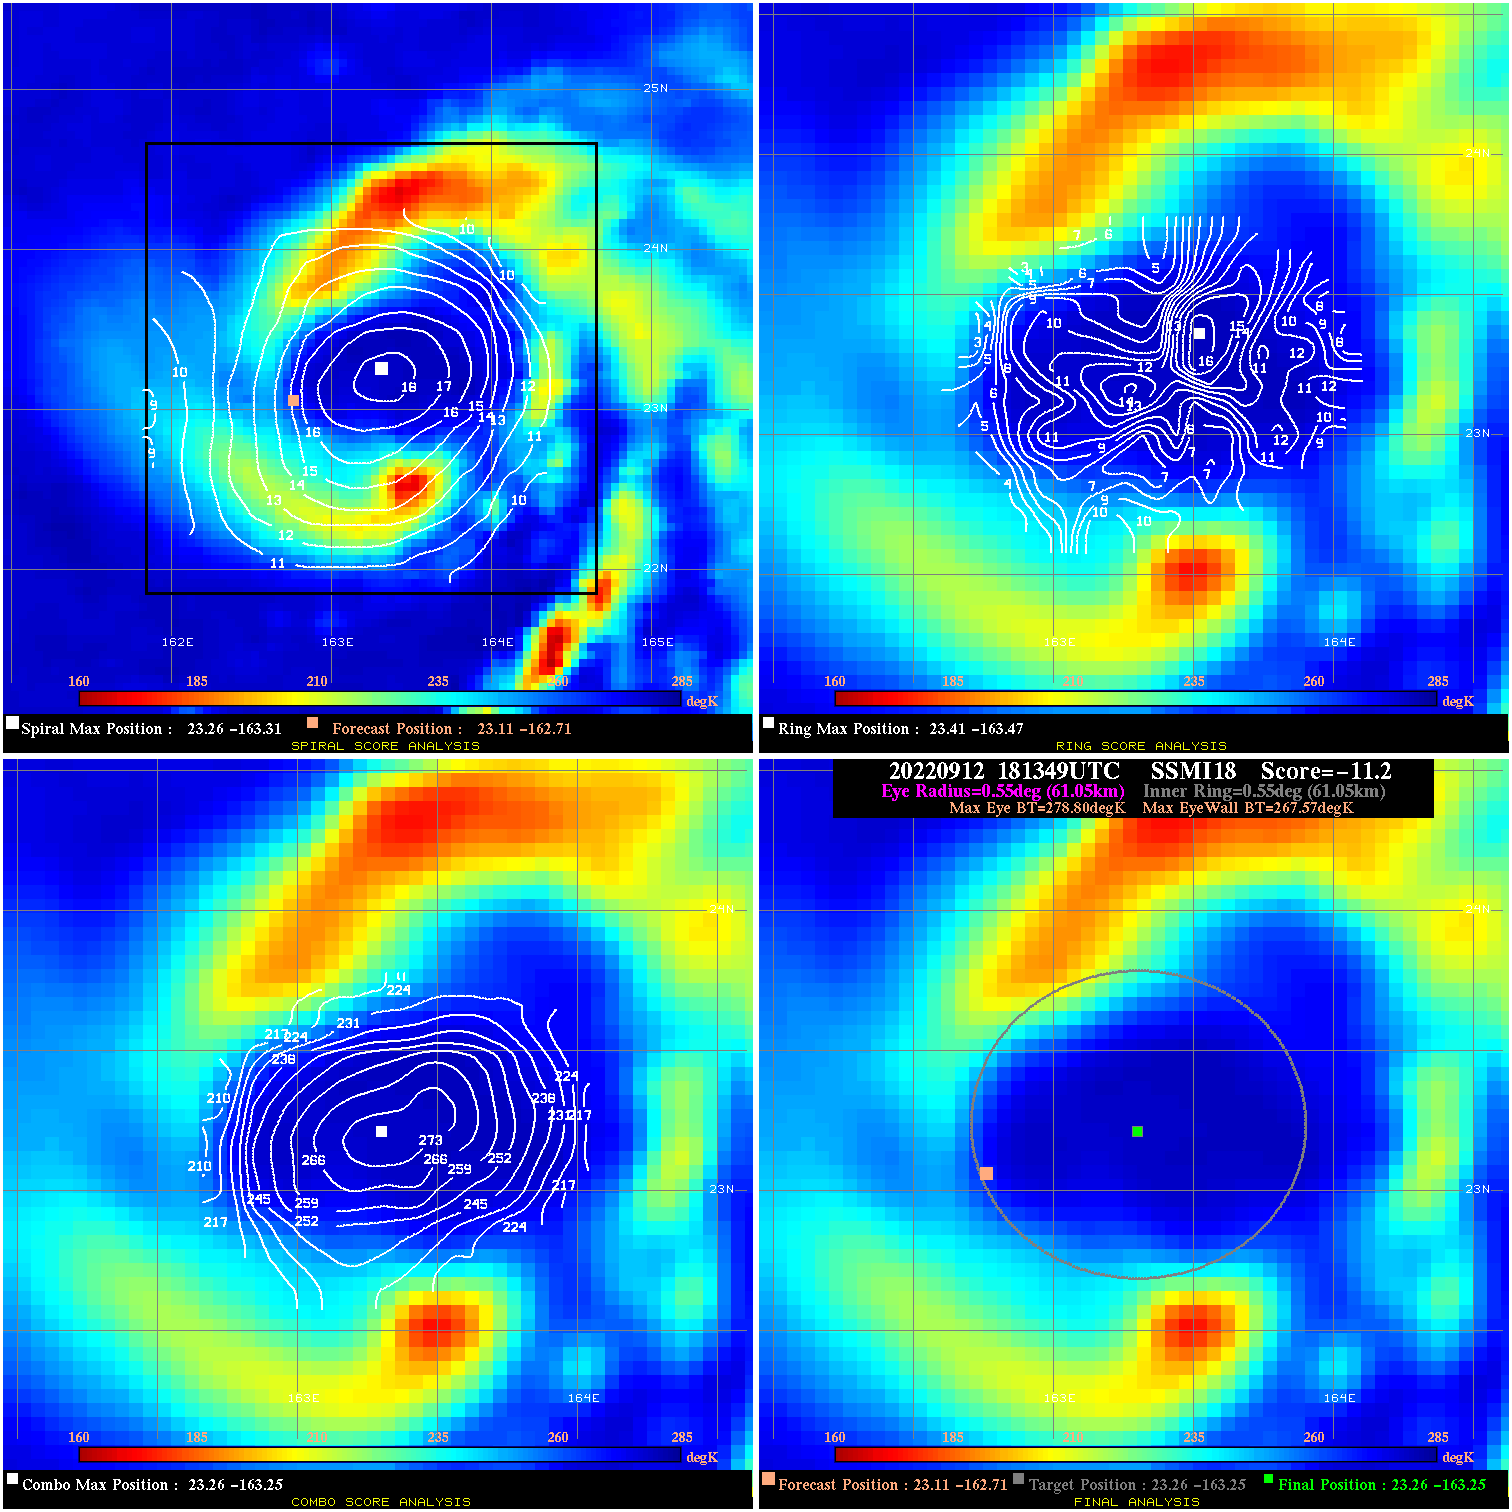
20220912 181349 -11.2 N/A 45.2% 122.21 11.23 45.0 SSMI18 23.1 -162.7 23.3 -163.3 23.3 -163.3 Analysis Plot
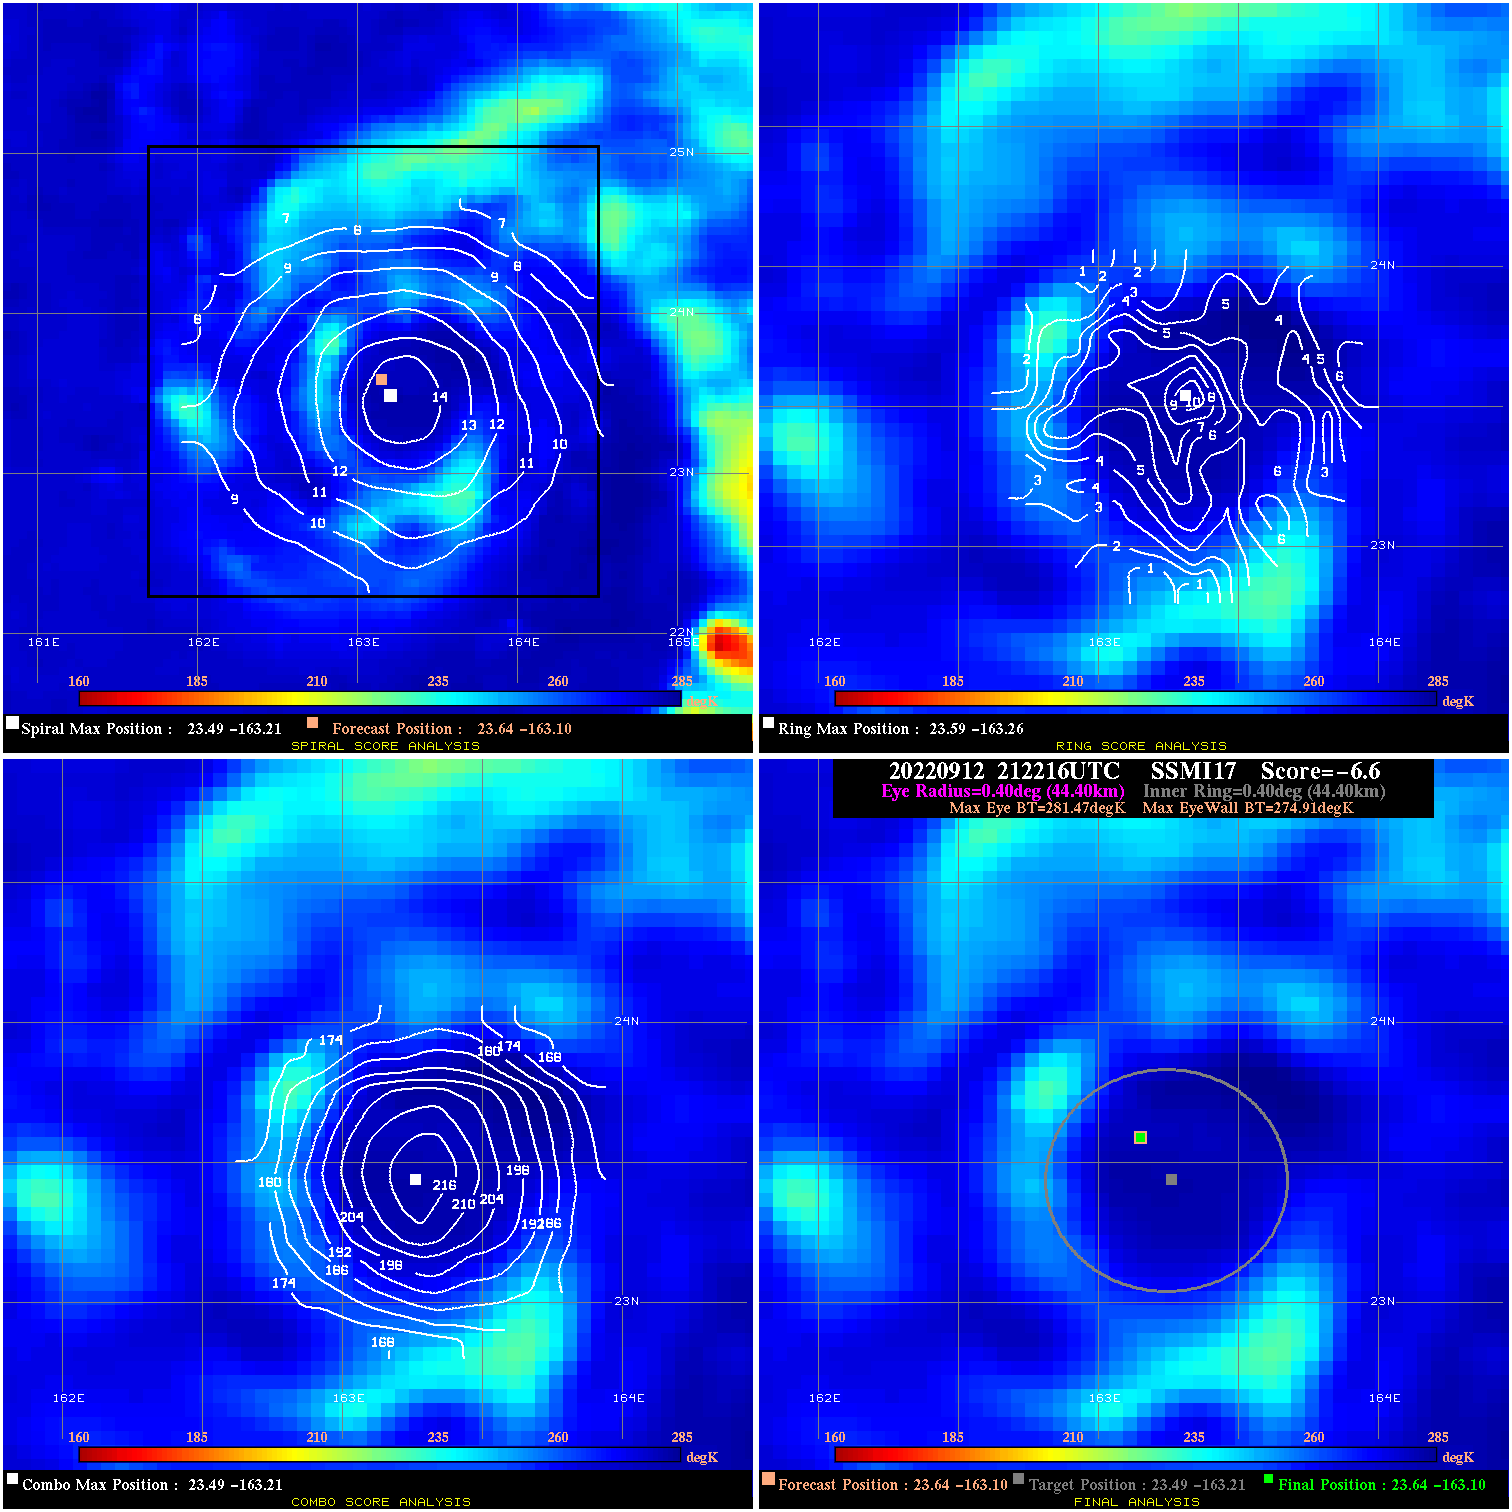
20220912 212216 -6.6 N/A N/A 88.88 6.56 50.0 SSMI17 23.6 -163.1 23.6 -163.1 23.5 -163.2 Analysis Plot
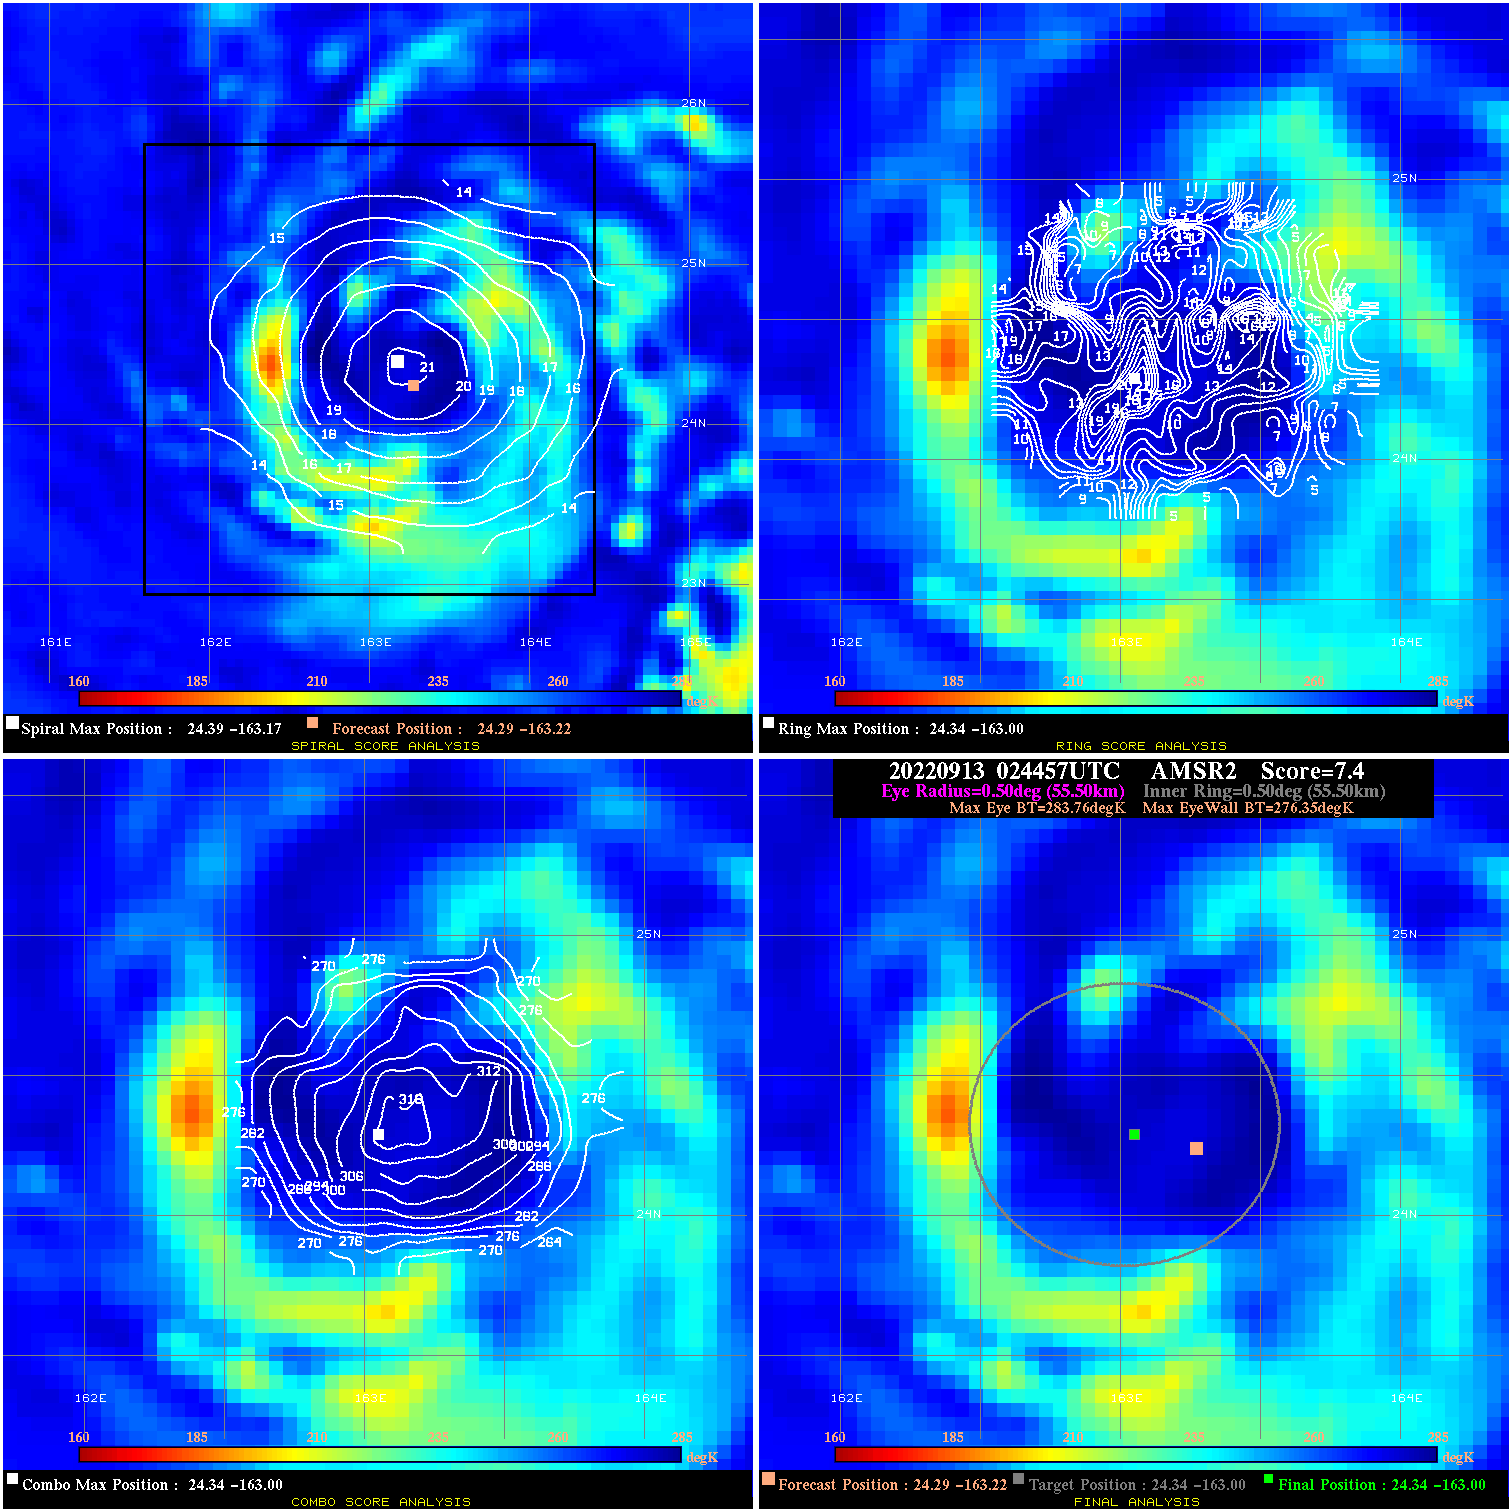
20220913 024457 7.4 N/A 17.8% 111.10 7.41 55.0 AMSR2 24.3 -163.2 24.3 -163.0 24.3 -163.0 Analysis Plot
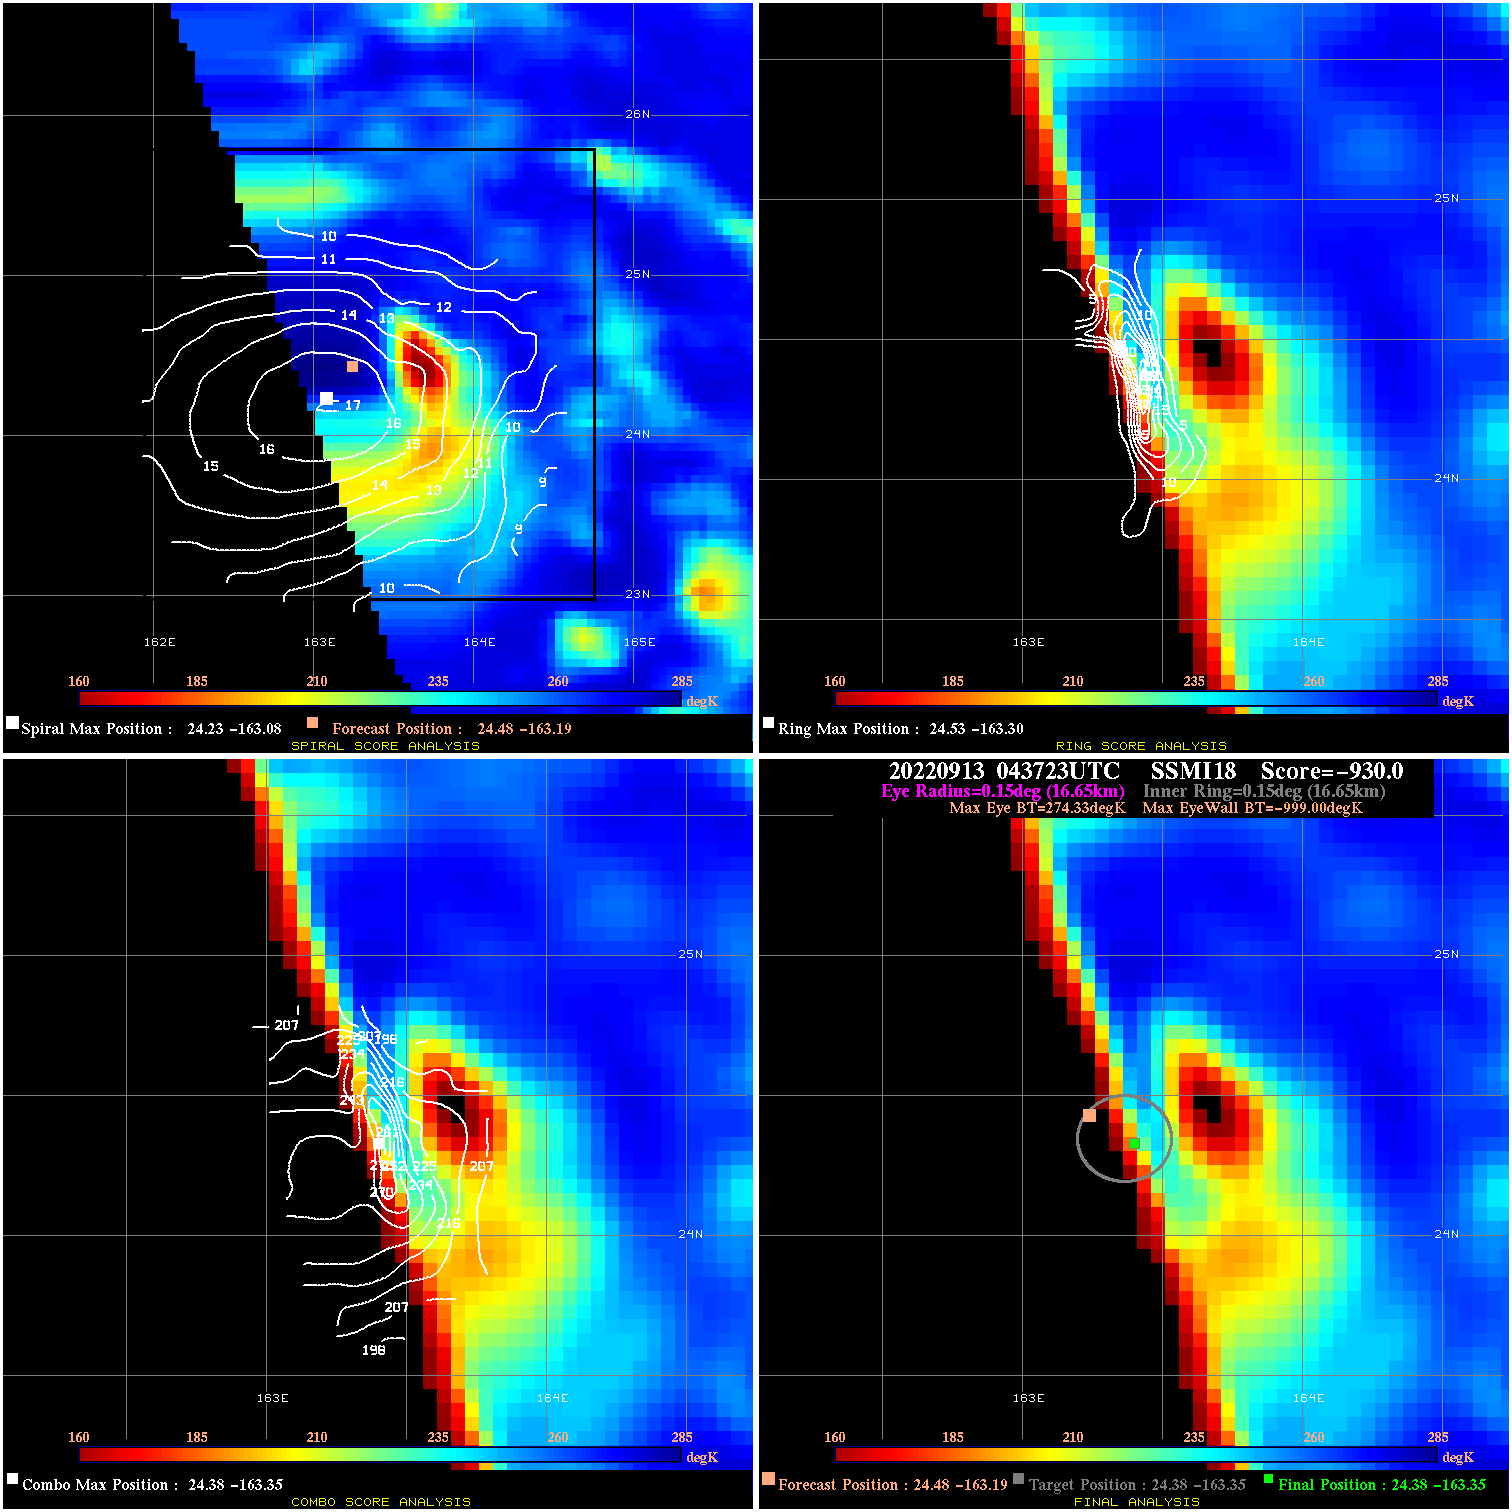
20220913 043723 -930.0 N/A N/A N/A 0.00 55.0 SSMI18 24.5 -163.2 24.4 -163.4 24.4 -163.4 Analysis Plot
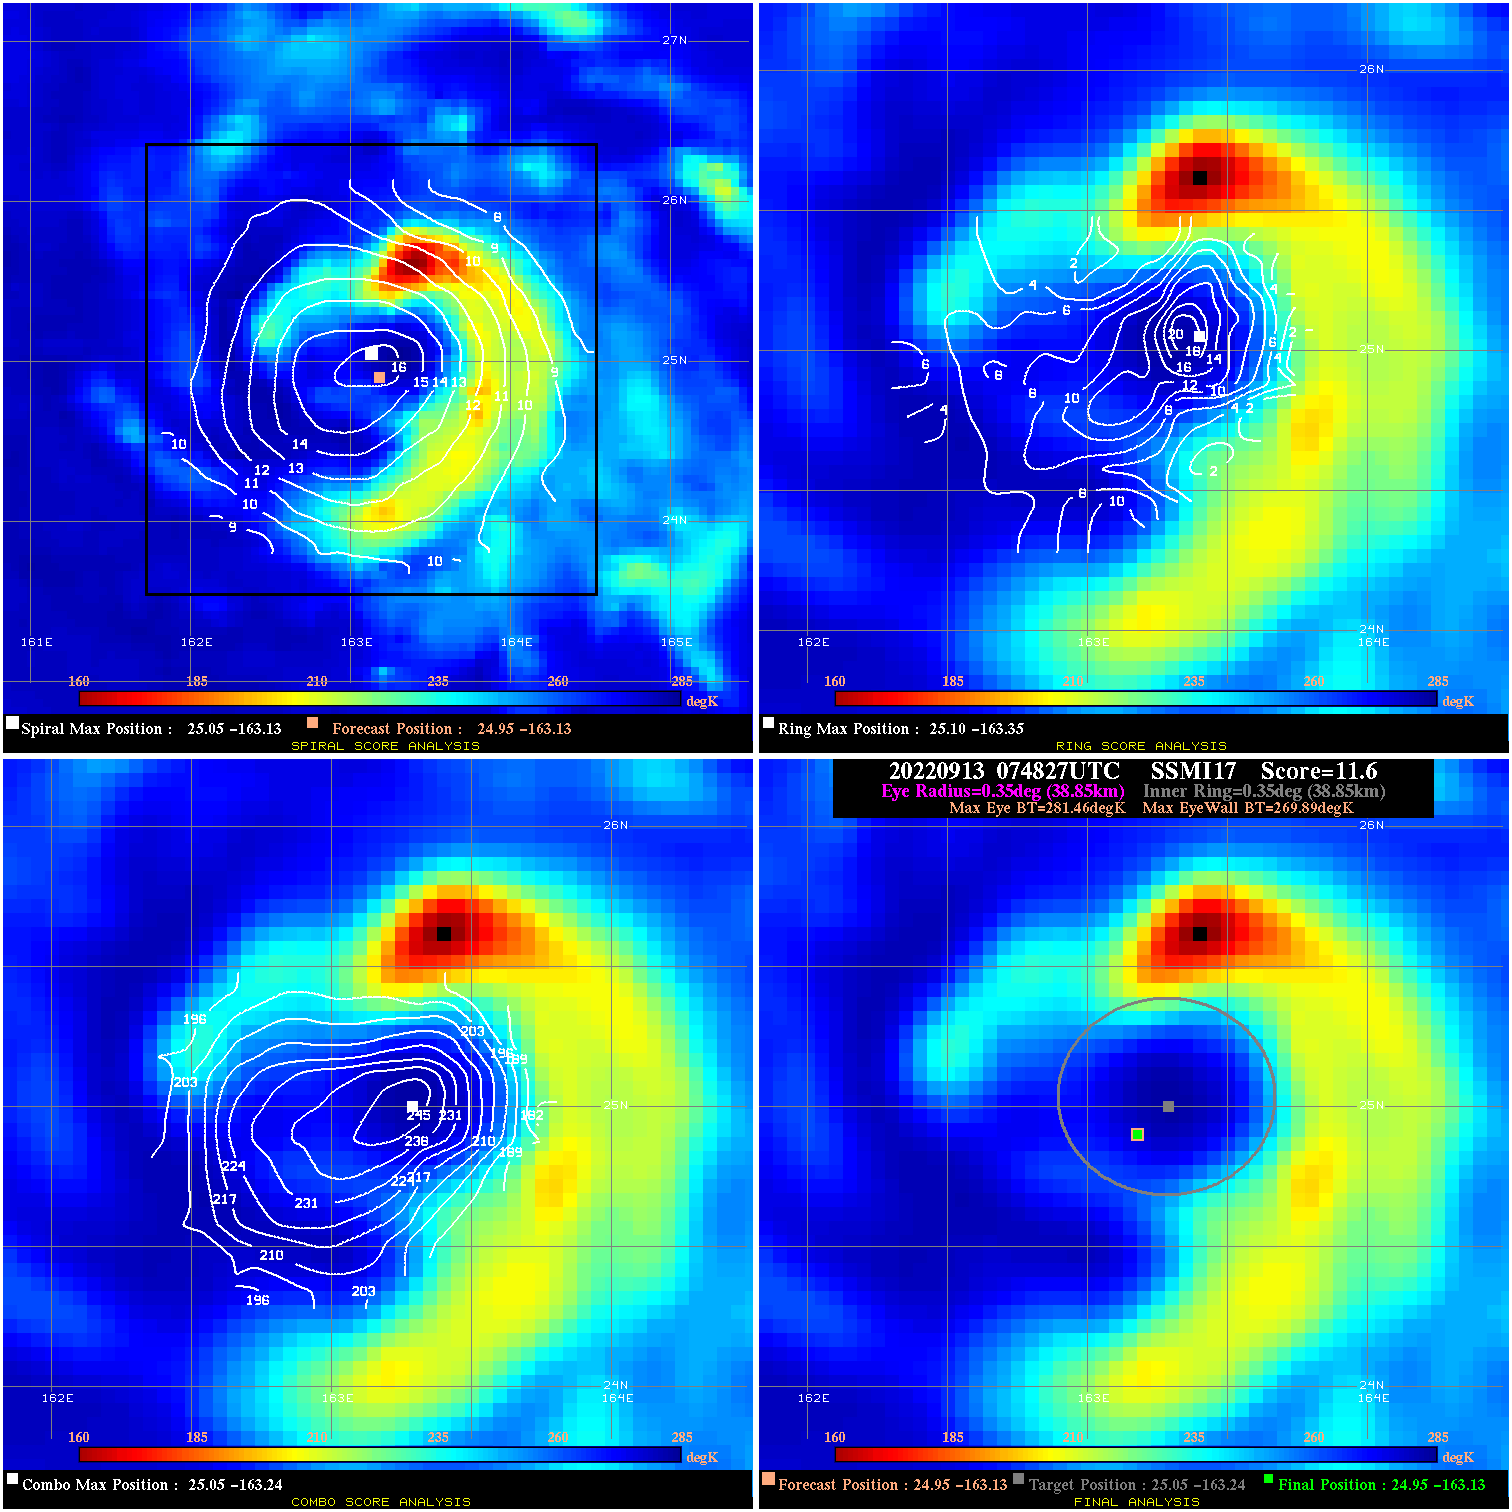
20220913 074827 11.6 N/A 9.6% 77.77 11.57 55.0 SSMI17 25.0 -163.1 25.0 -163.1 25.0 -163.2 Analysis Plot
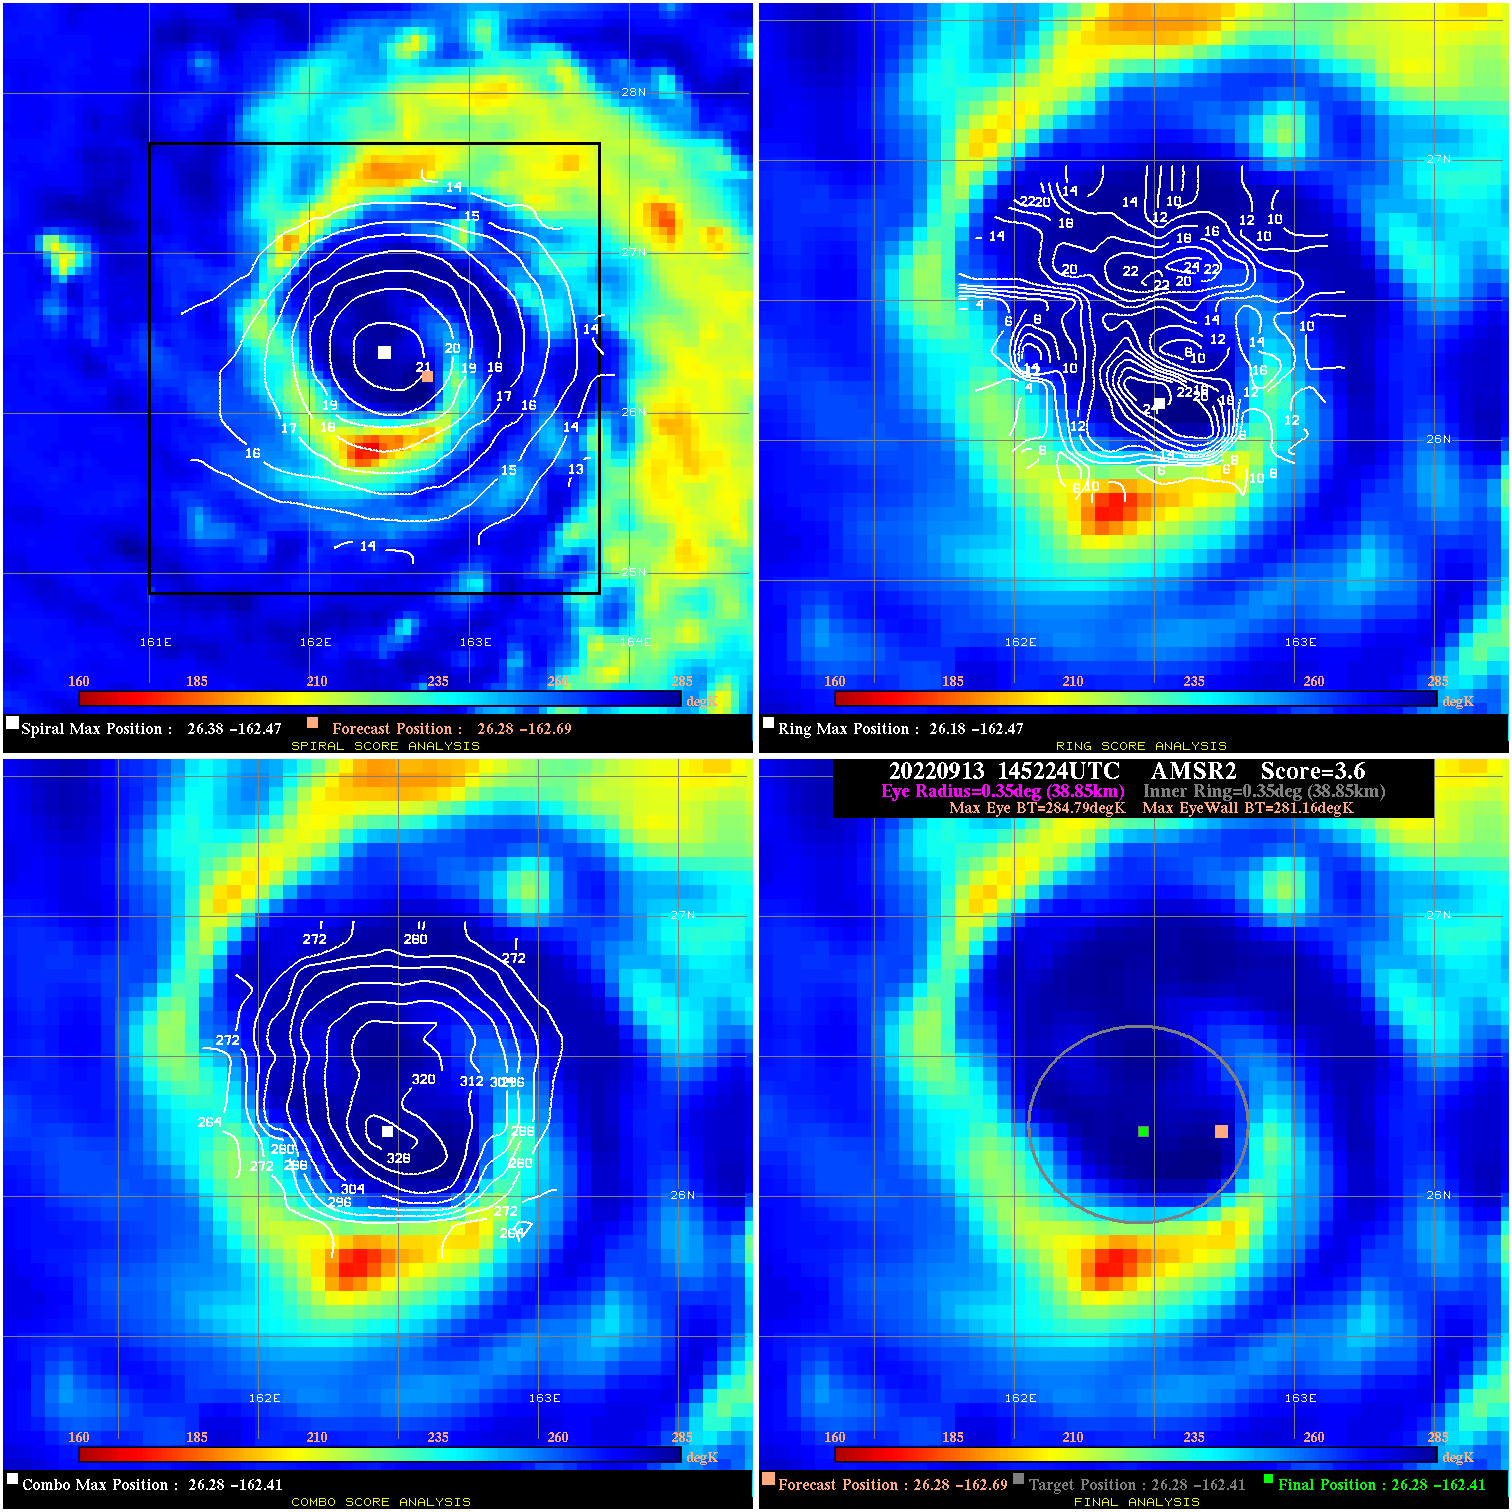
20220913 145224 3.6 N/A 42.5% 77.77 3.63 60.0 AMSR2 26.3 -162.7 26.3 -162.4 26.3 -162.4 Analysis Plot
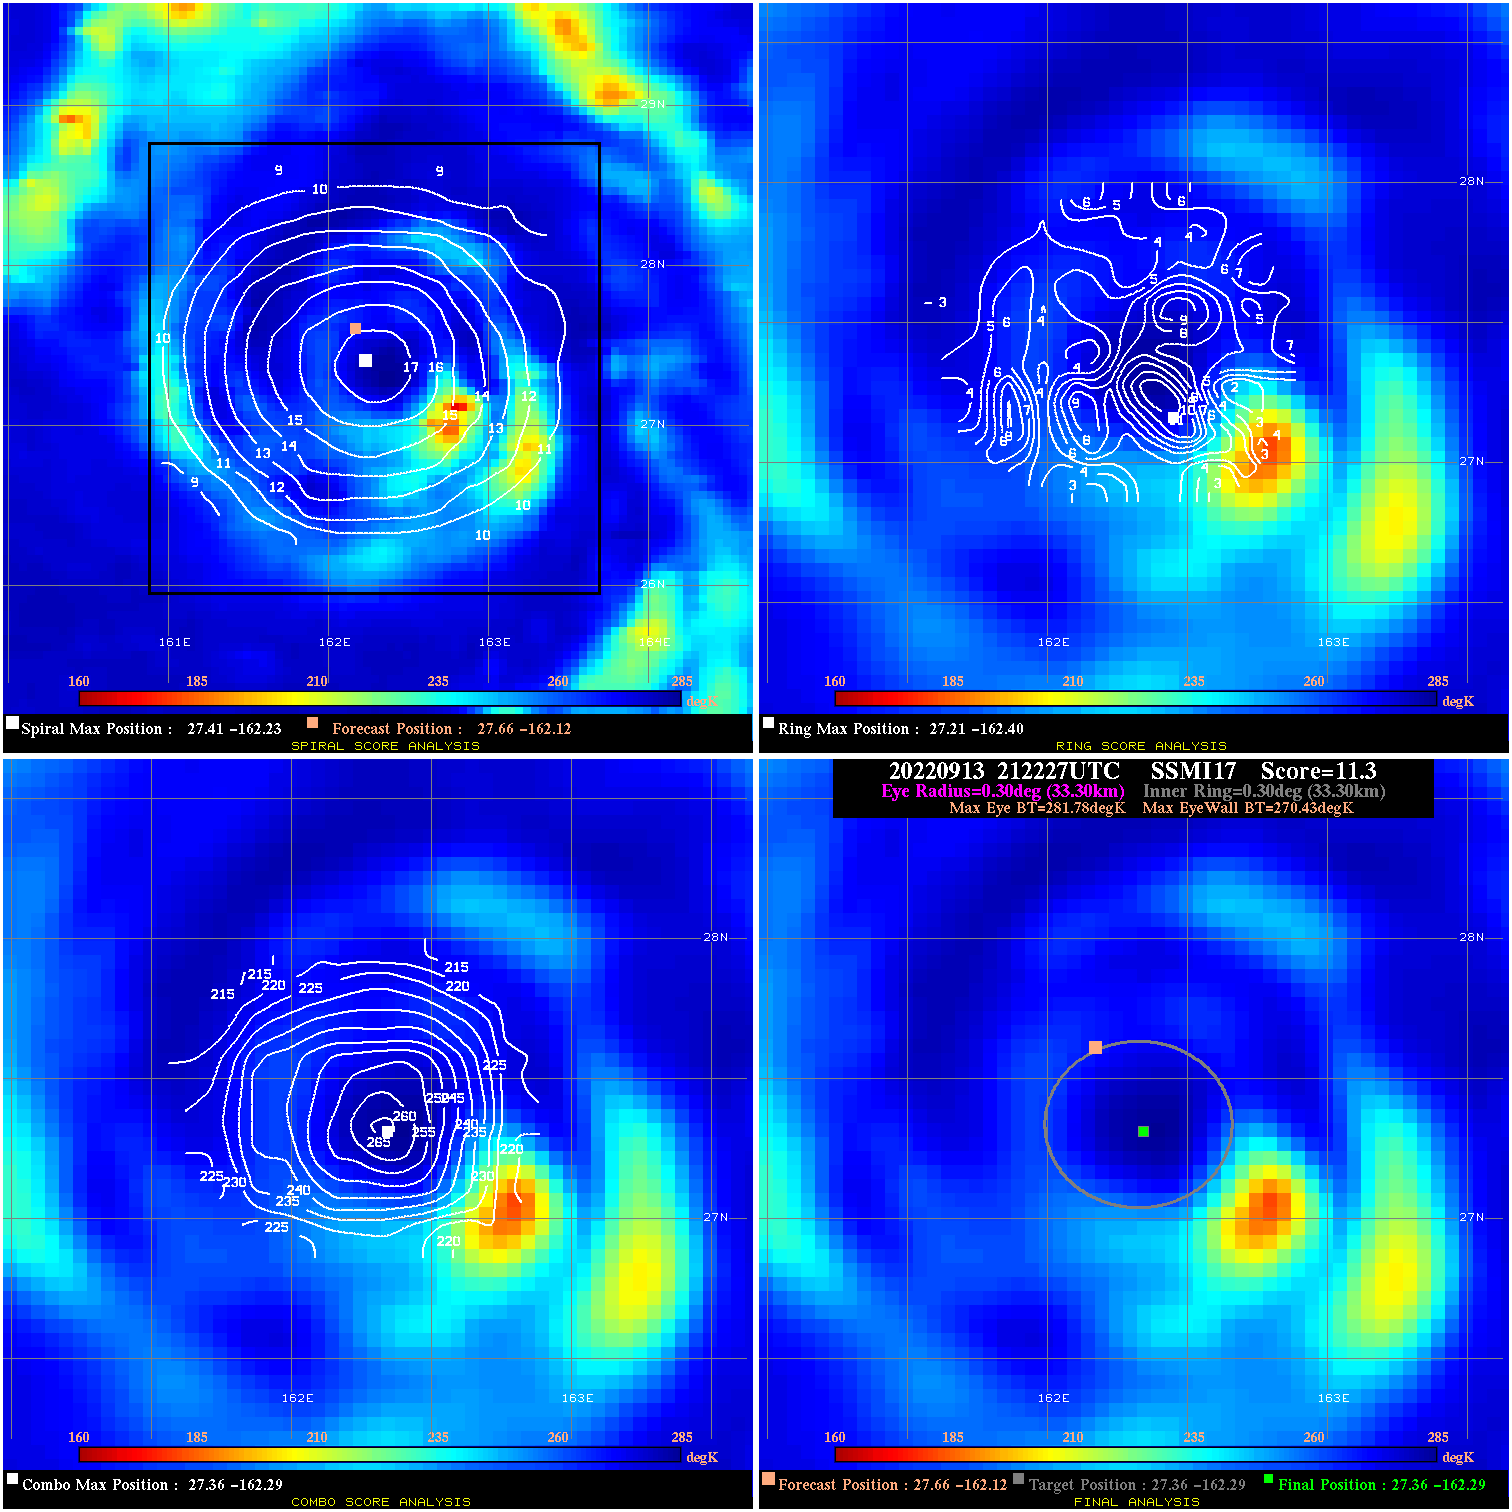
20220913 212227 11.3 N/A 9.6% 66.66 11.35 65.0 SSMI17 27.7 -162.1 27.4 -162.3 27.4 -162.3 Analysis Plot
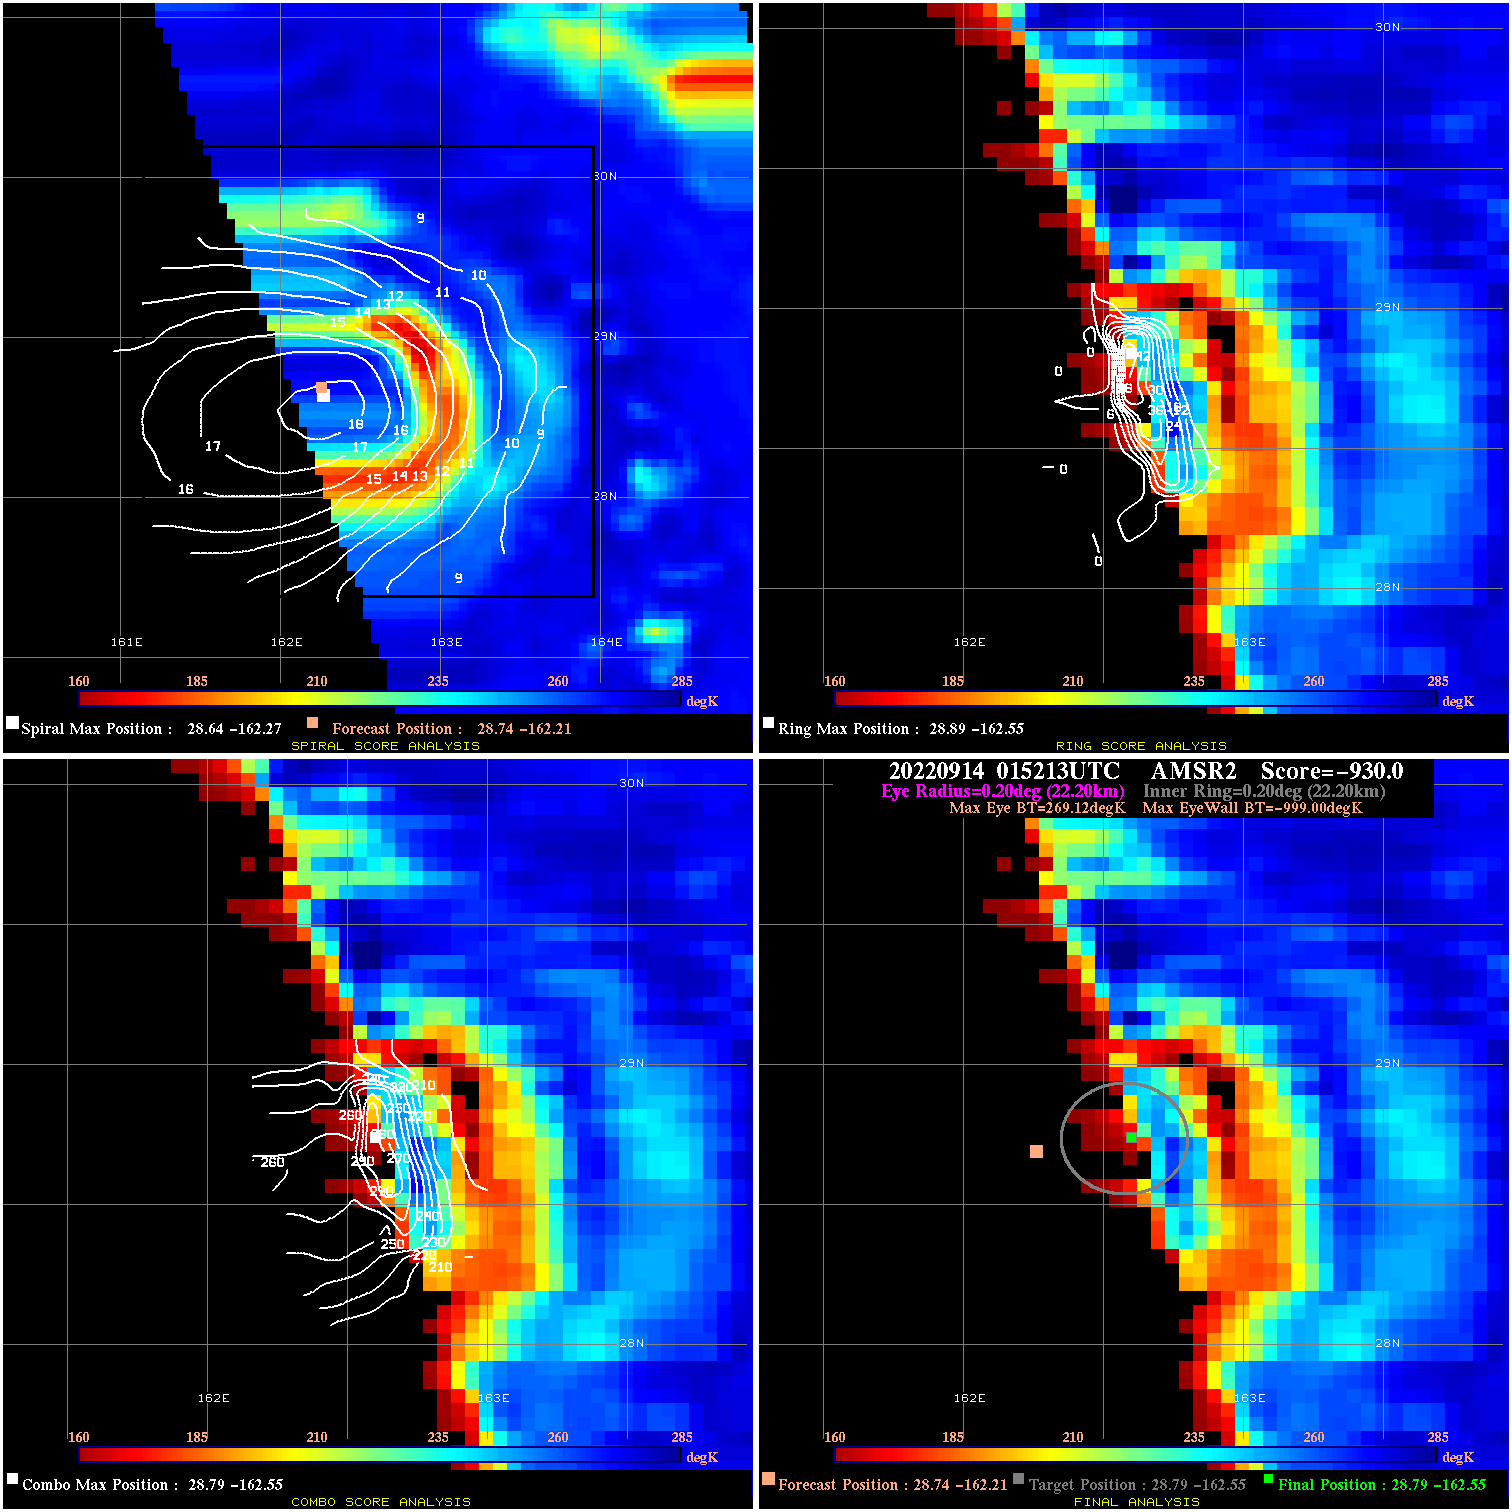
20220914 015213 -930.0 N/A N/A N/A 0.00 65.0 AMSR2 28.7 -162.2 28.8 -162.6 28.8 -162.6 Analysis Plot
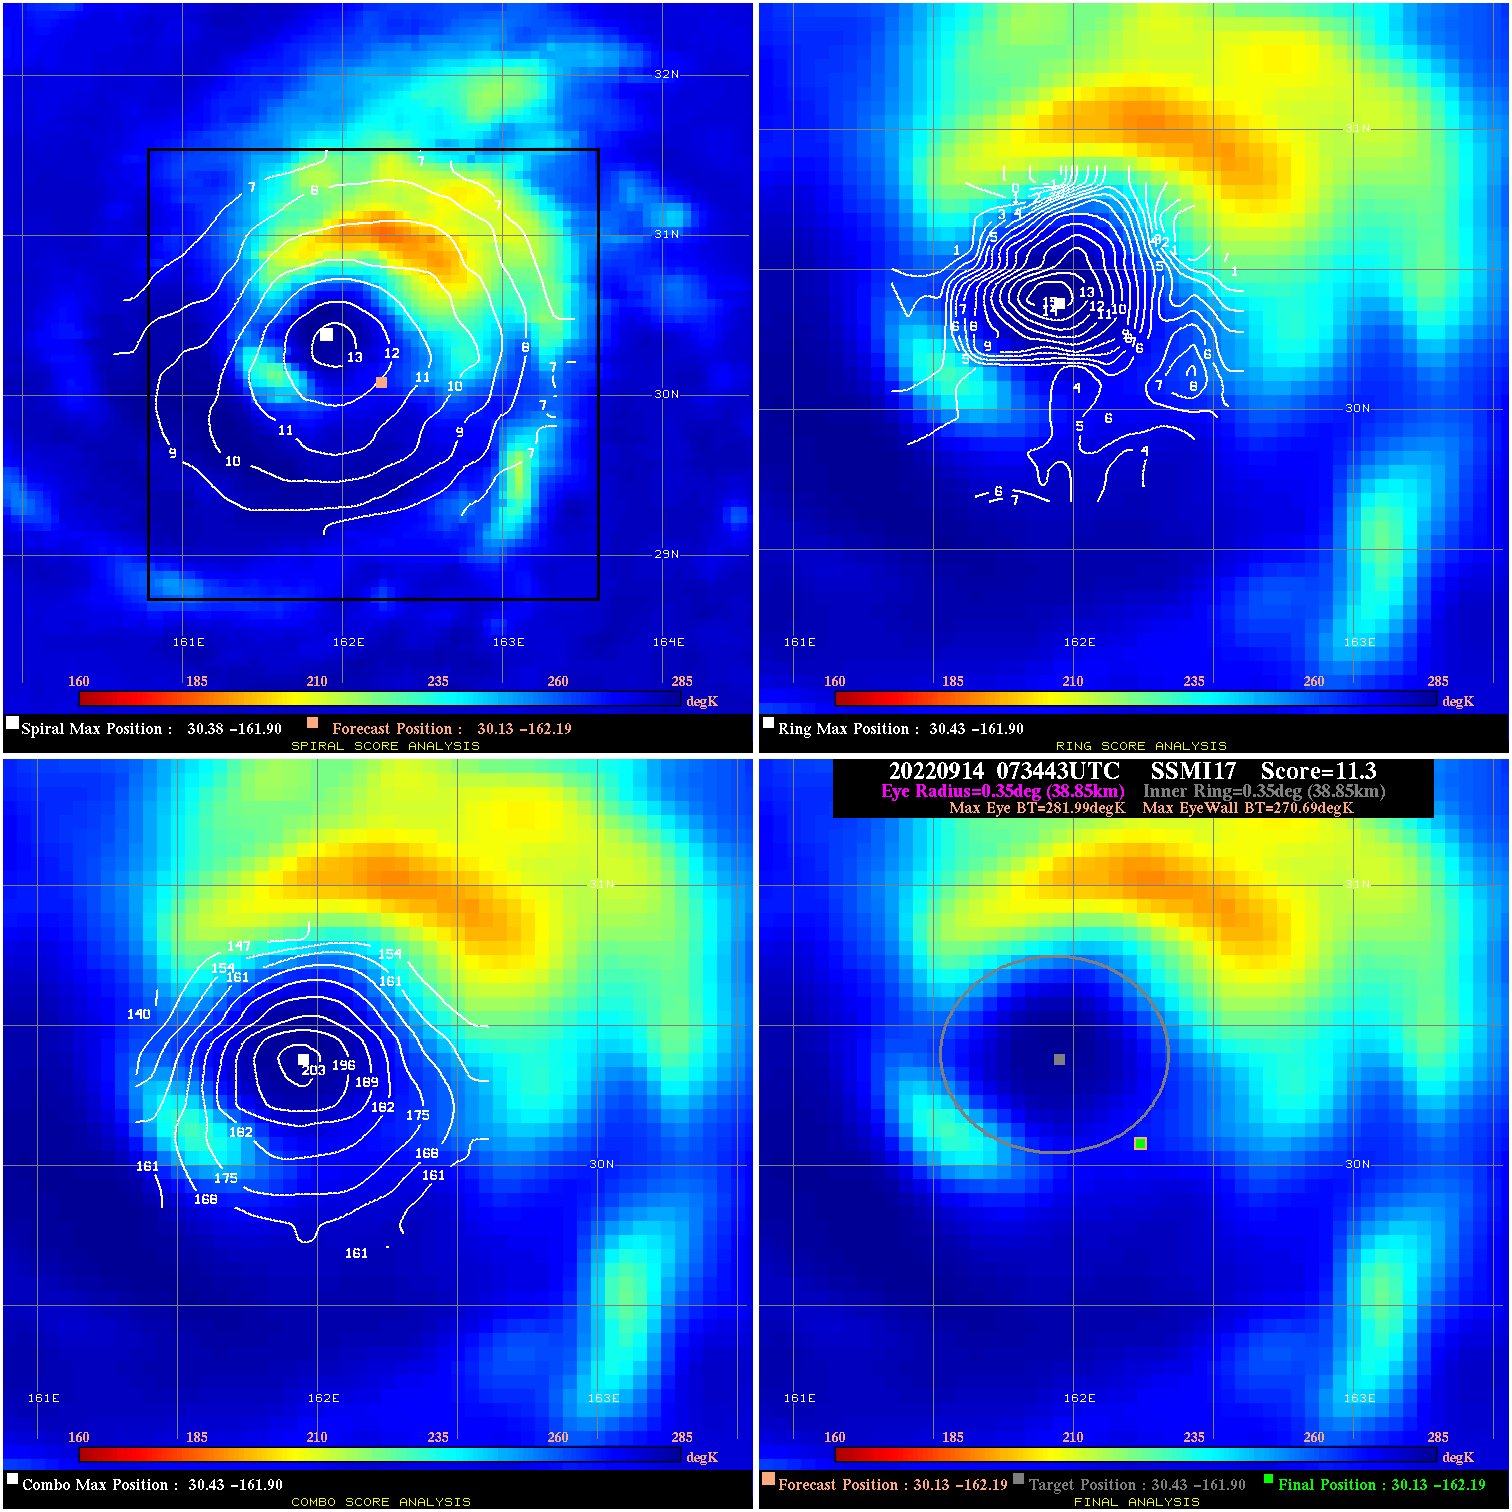
20220914 073443 11.3 N/A 19.2% 77.77 11.30 65.0 SSMI17 30.1 -162.2 30.1 -162.2 30.4 -161.9 Analysis Plot
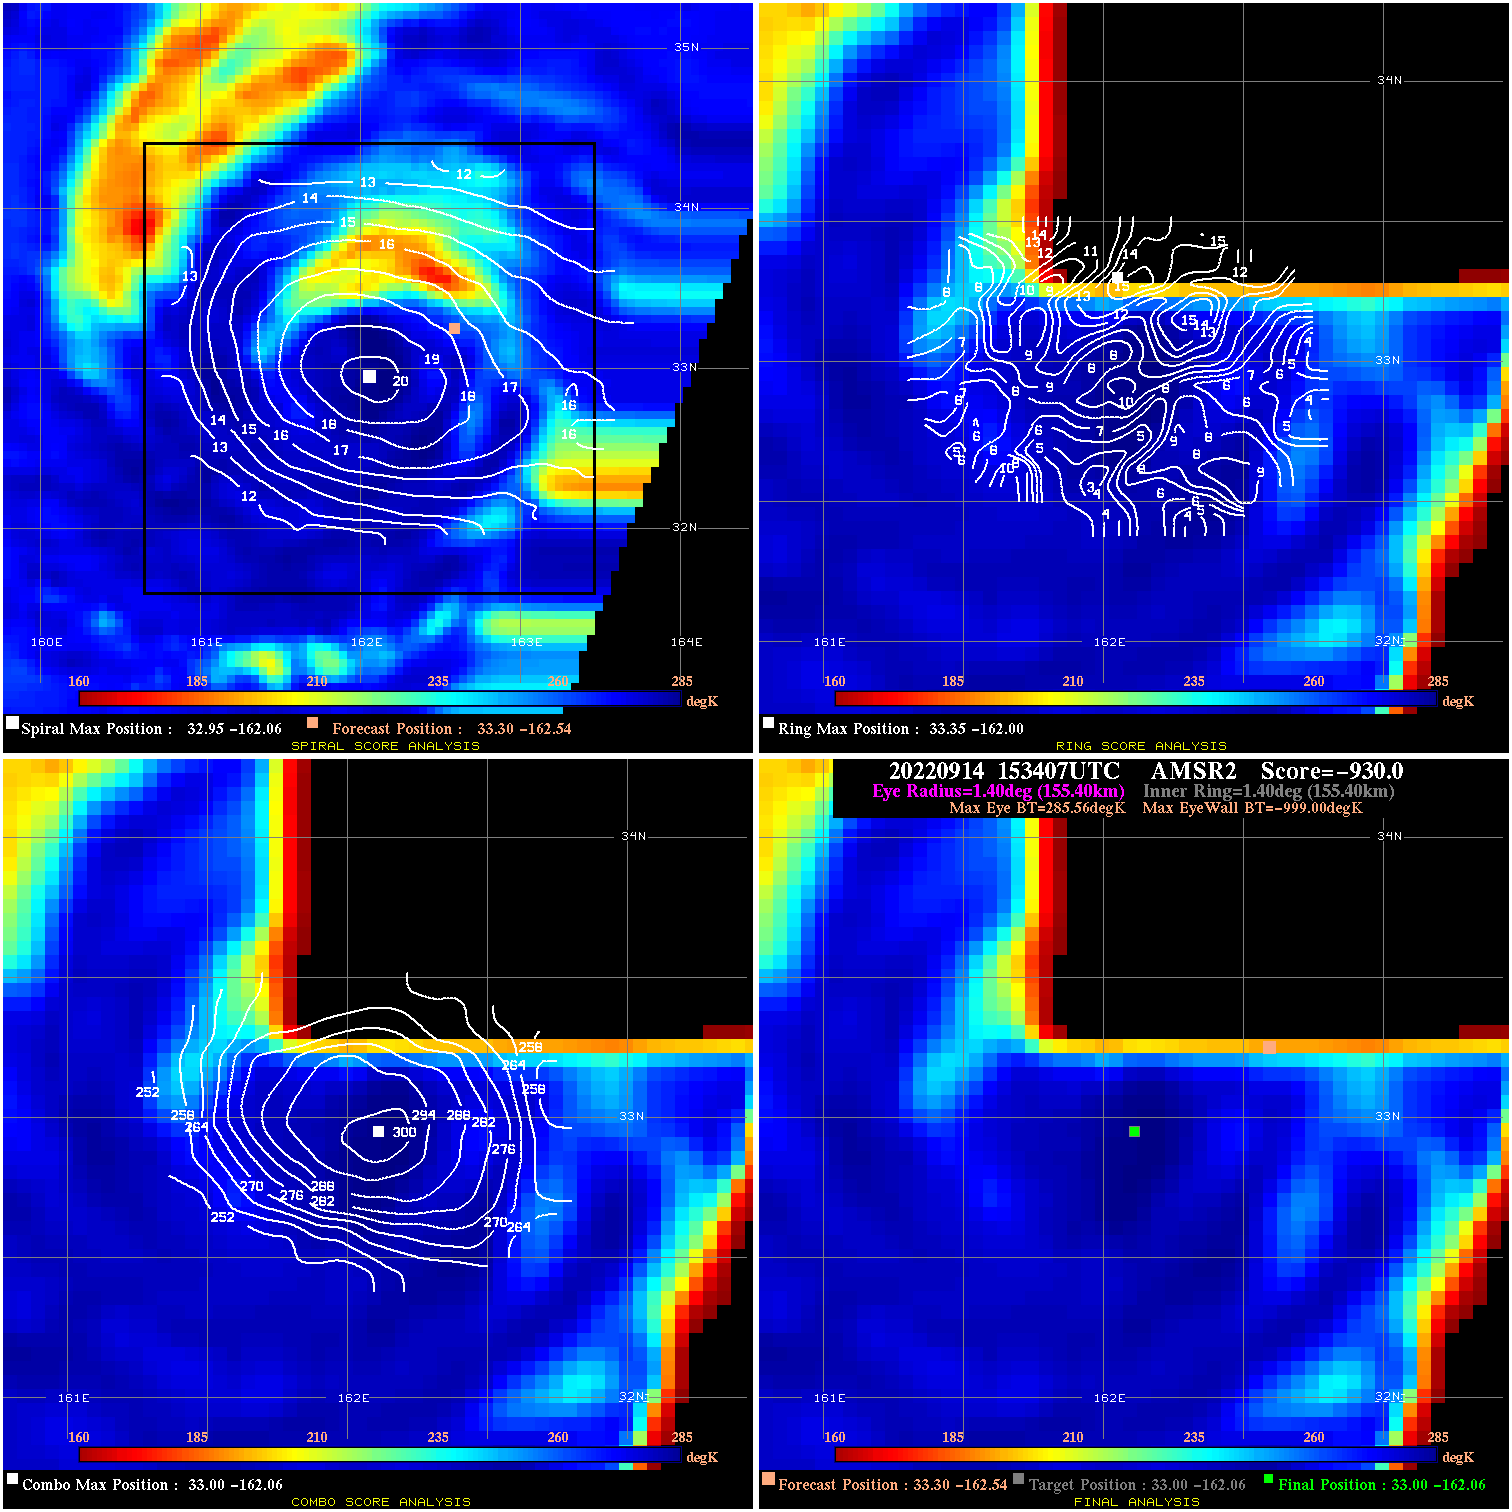
20220914 153407 -930.0 N/A N/A N/A 0.00 70.0 AMSR2 33.3 -162.5 33.0 -162.1 33.0 -162.1 Analysis Plot
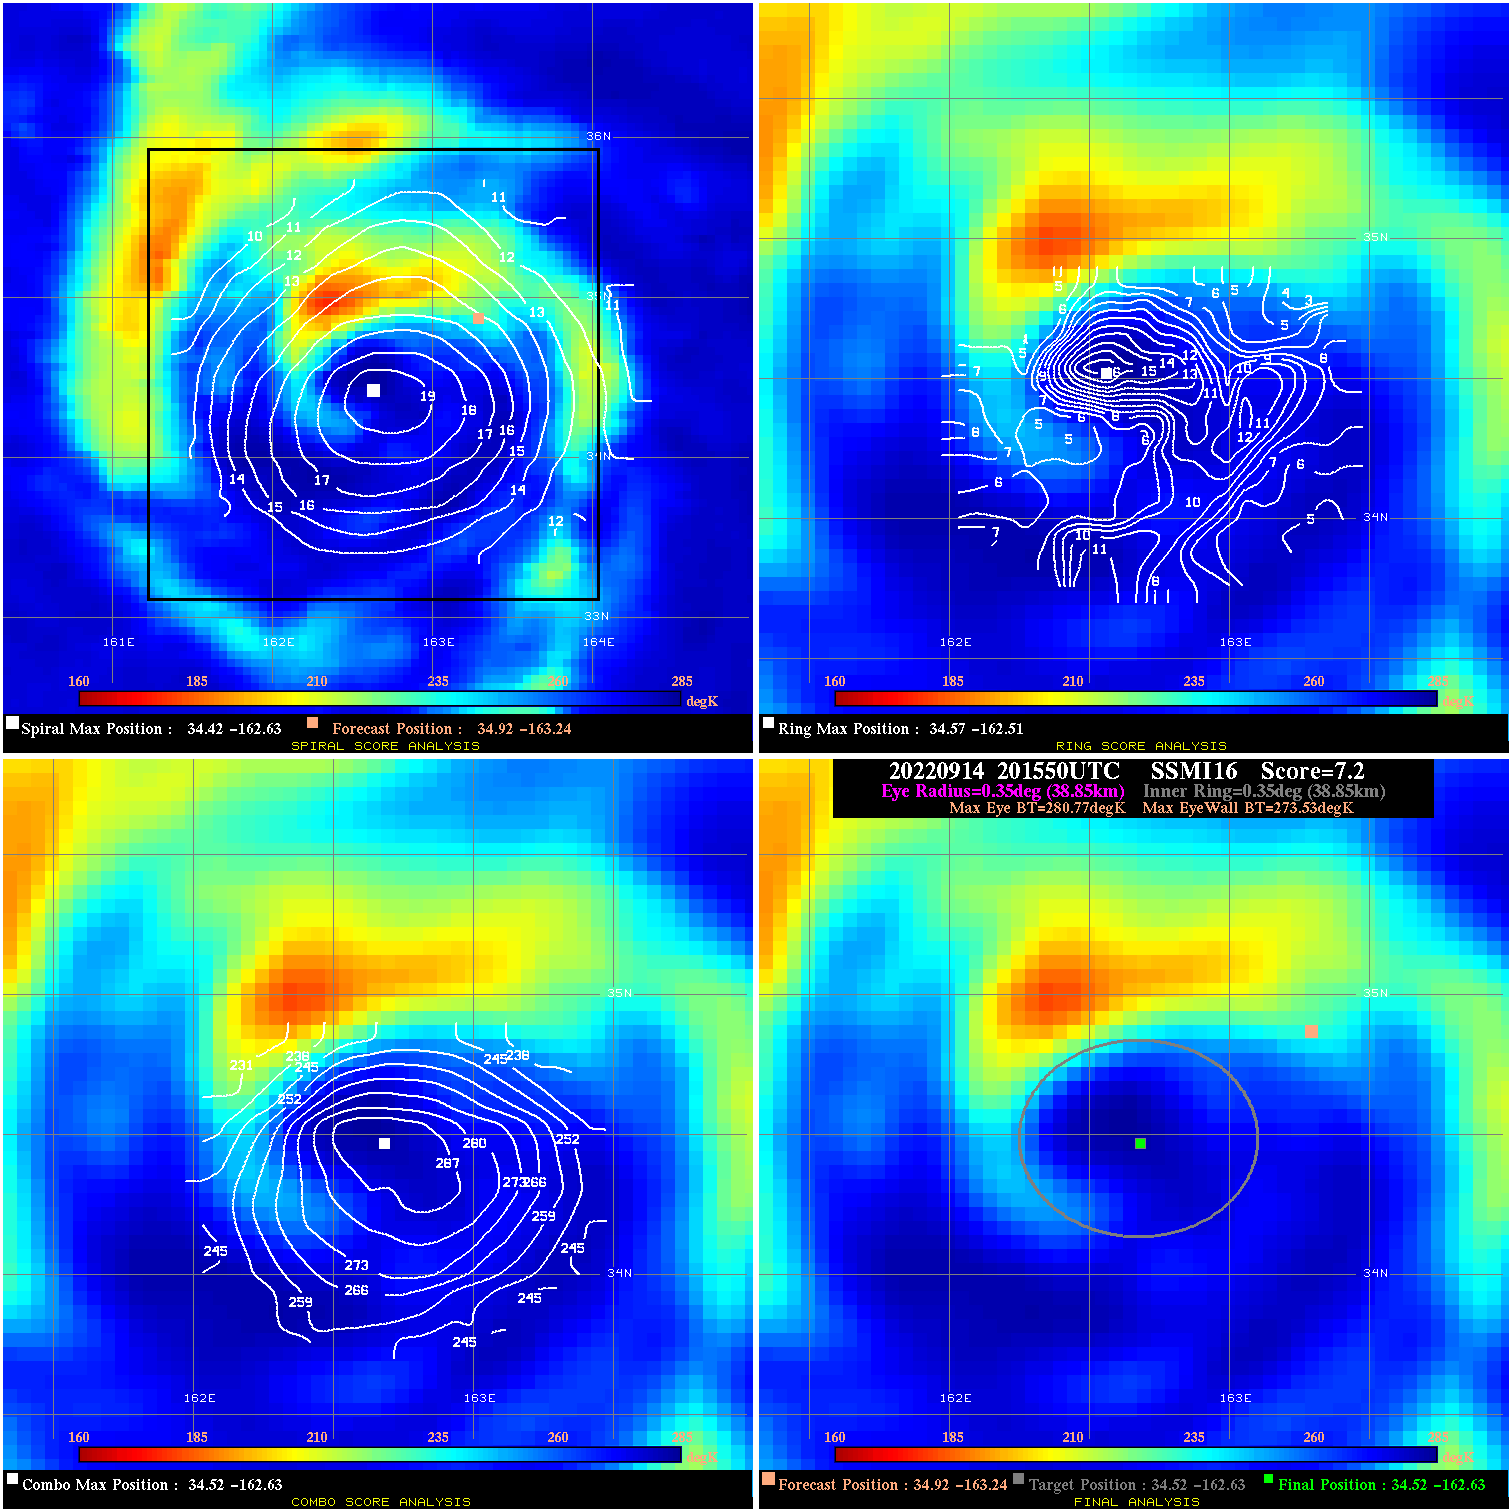
20220914 201550 7.2 N/A 30.1% 77.77 7.24 70.0 SSMI16 34.9 -163.2 34.5 -162.6 34.5 -162.6 Analysis Plot
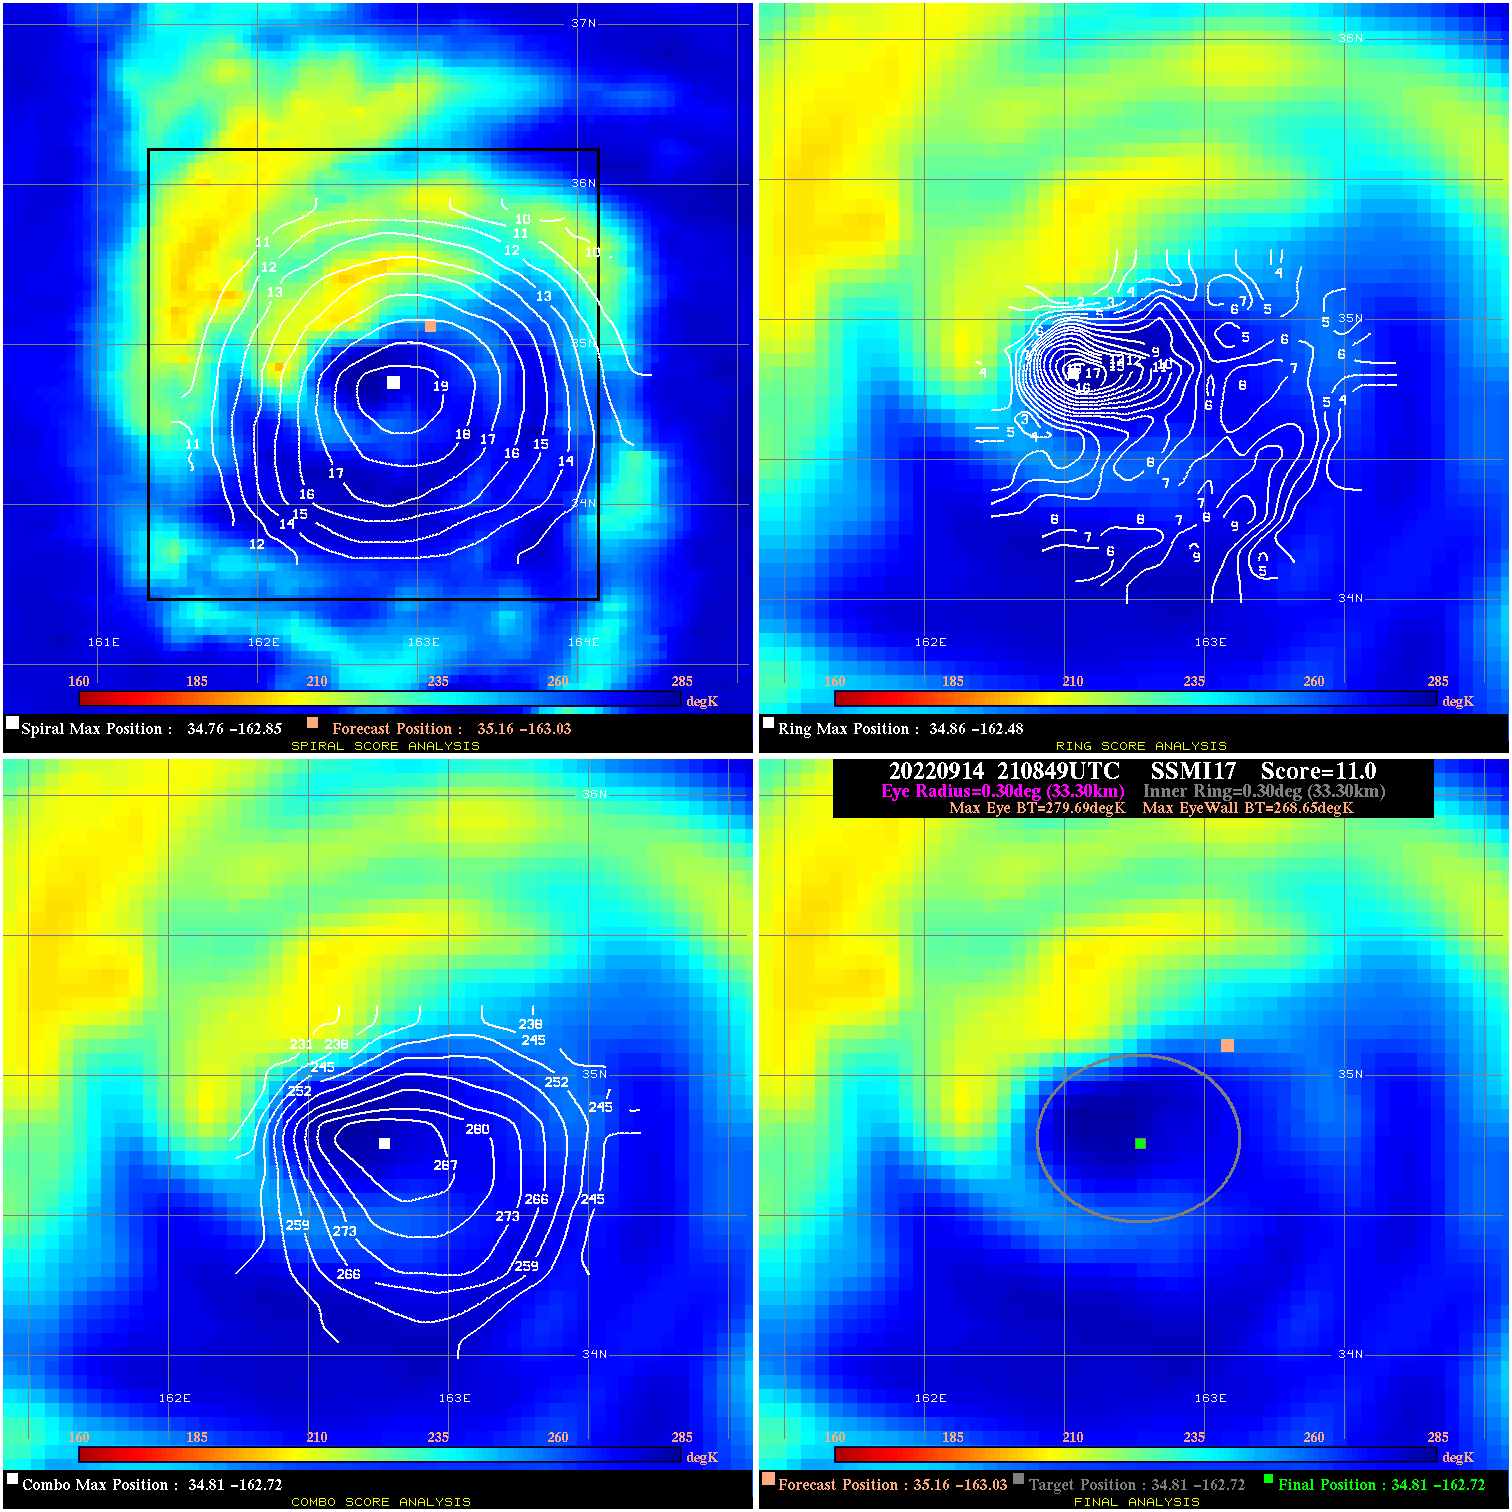
20220914 210849 11.0 N/A 16.4% 66.66 11.04 65.0 SSMI17 35.2 -163.0 34.8 -162.7 34.8 -162.7 Analysis Plot
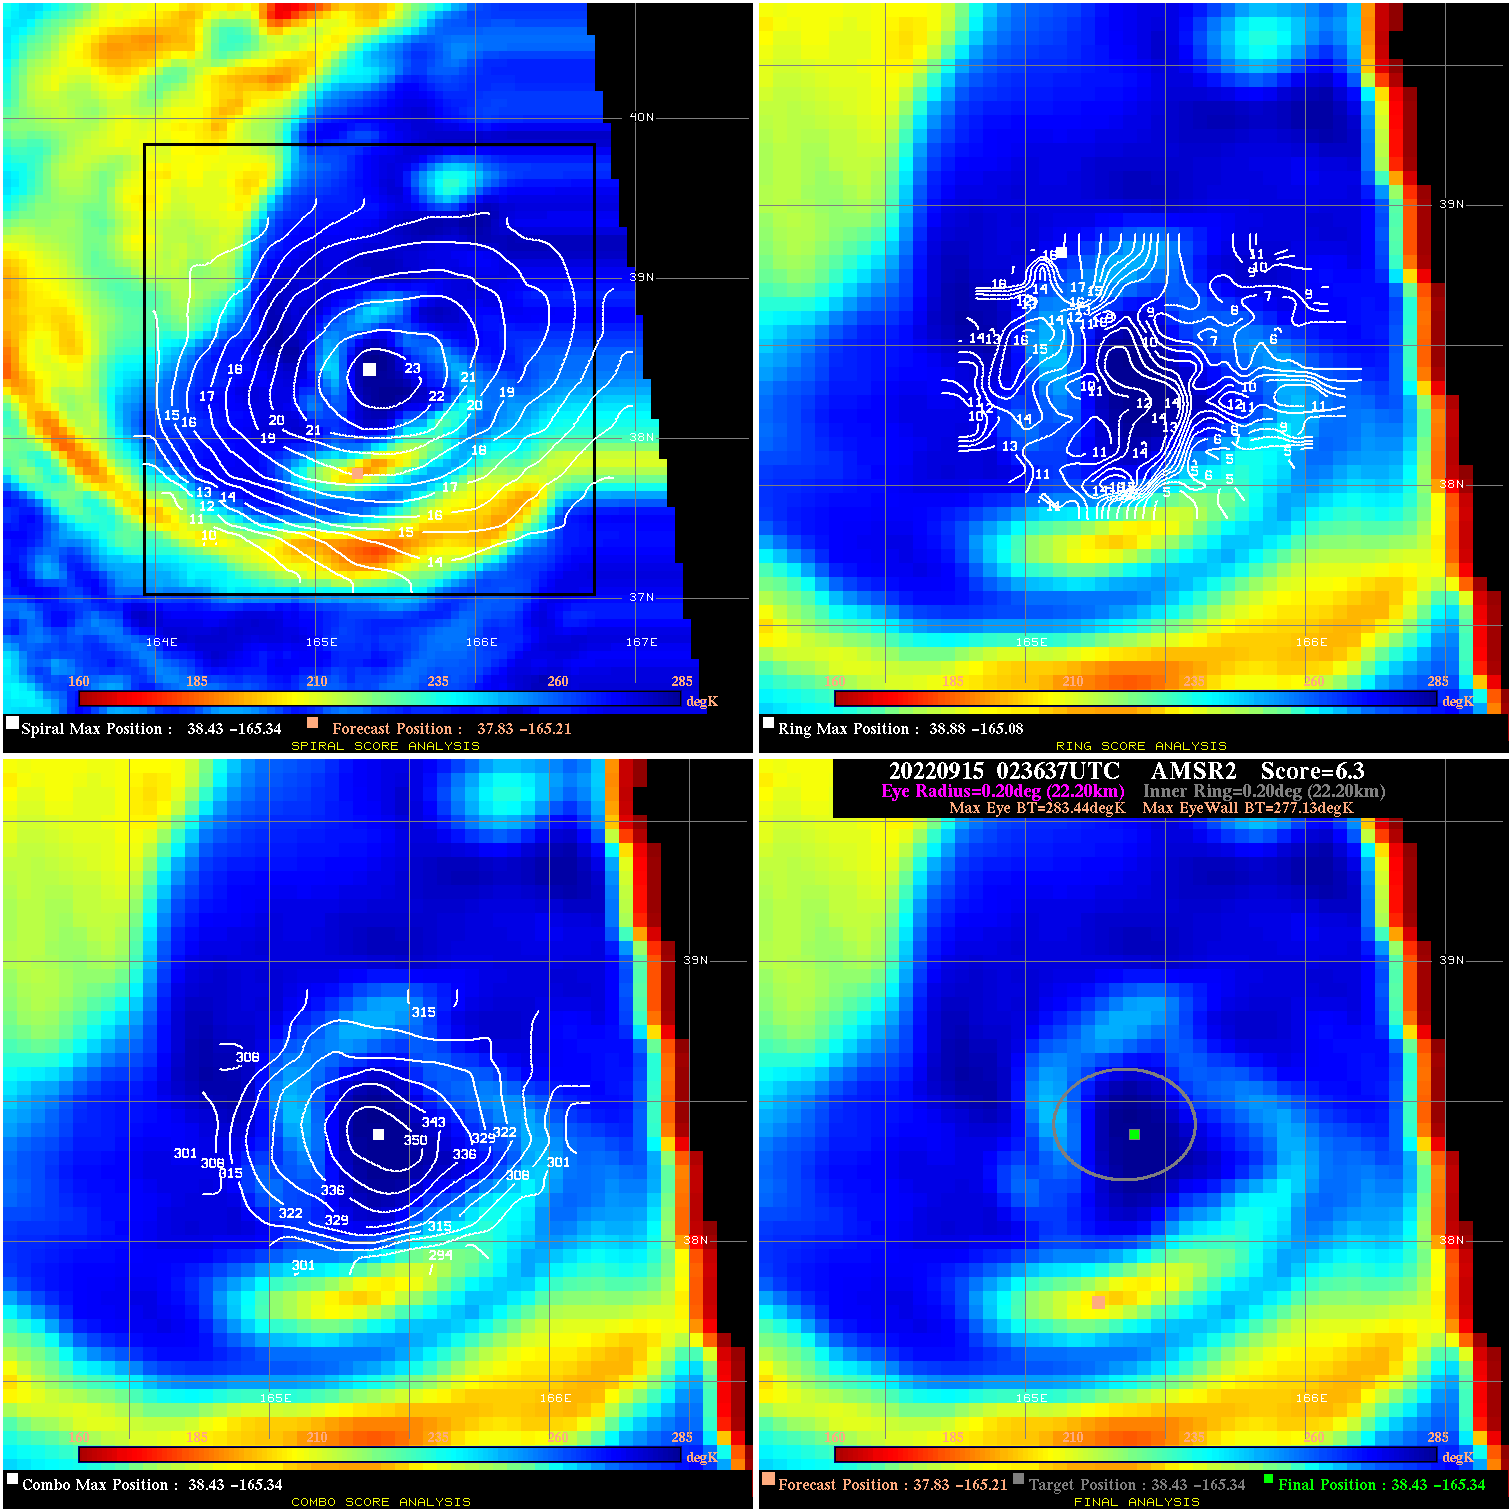
20220915 023637 6.3 N/A N/A 44.44 6.31 65.0 AMSR2 37.8 -165.2 38.4 -165.3 38.4 -165.3 Analysis Plot
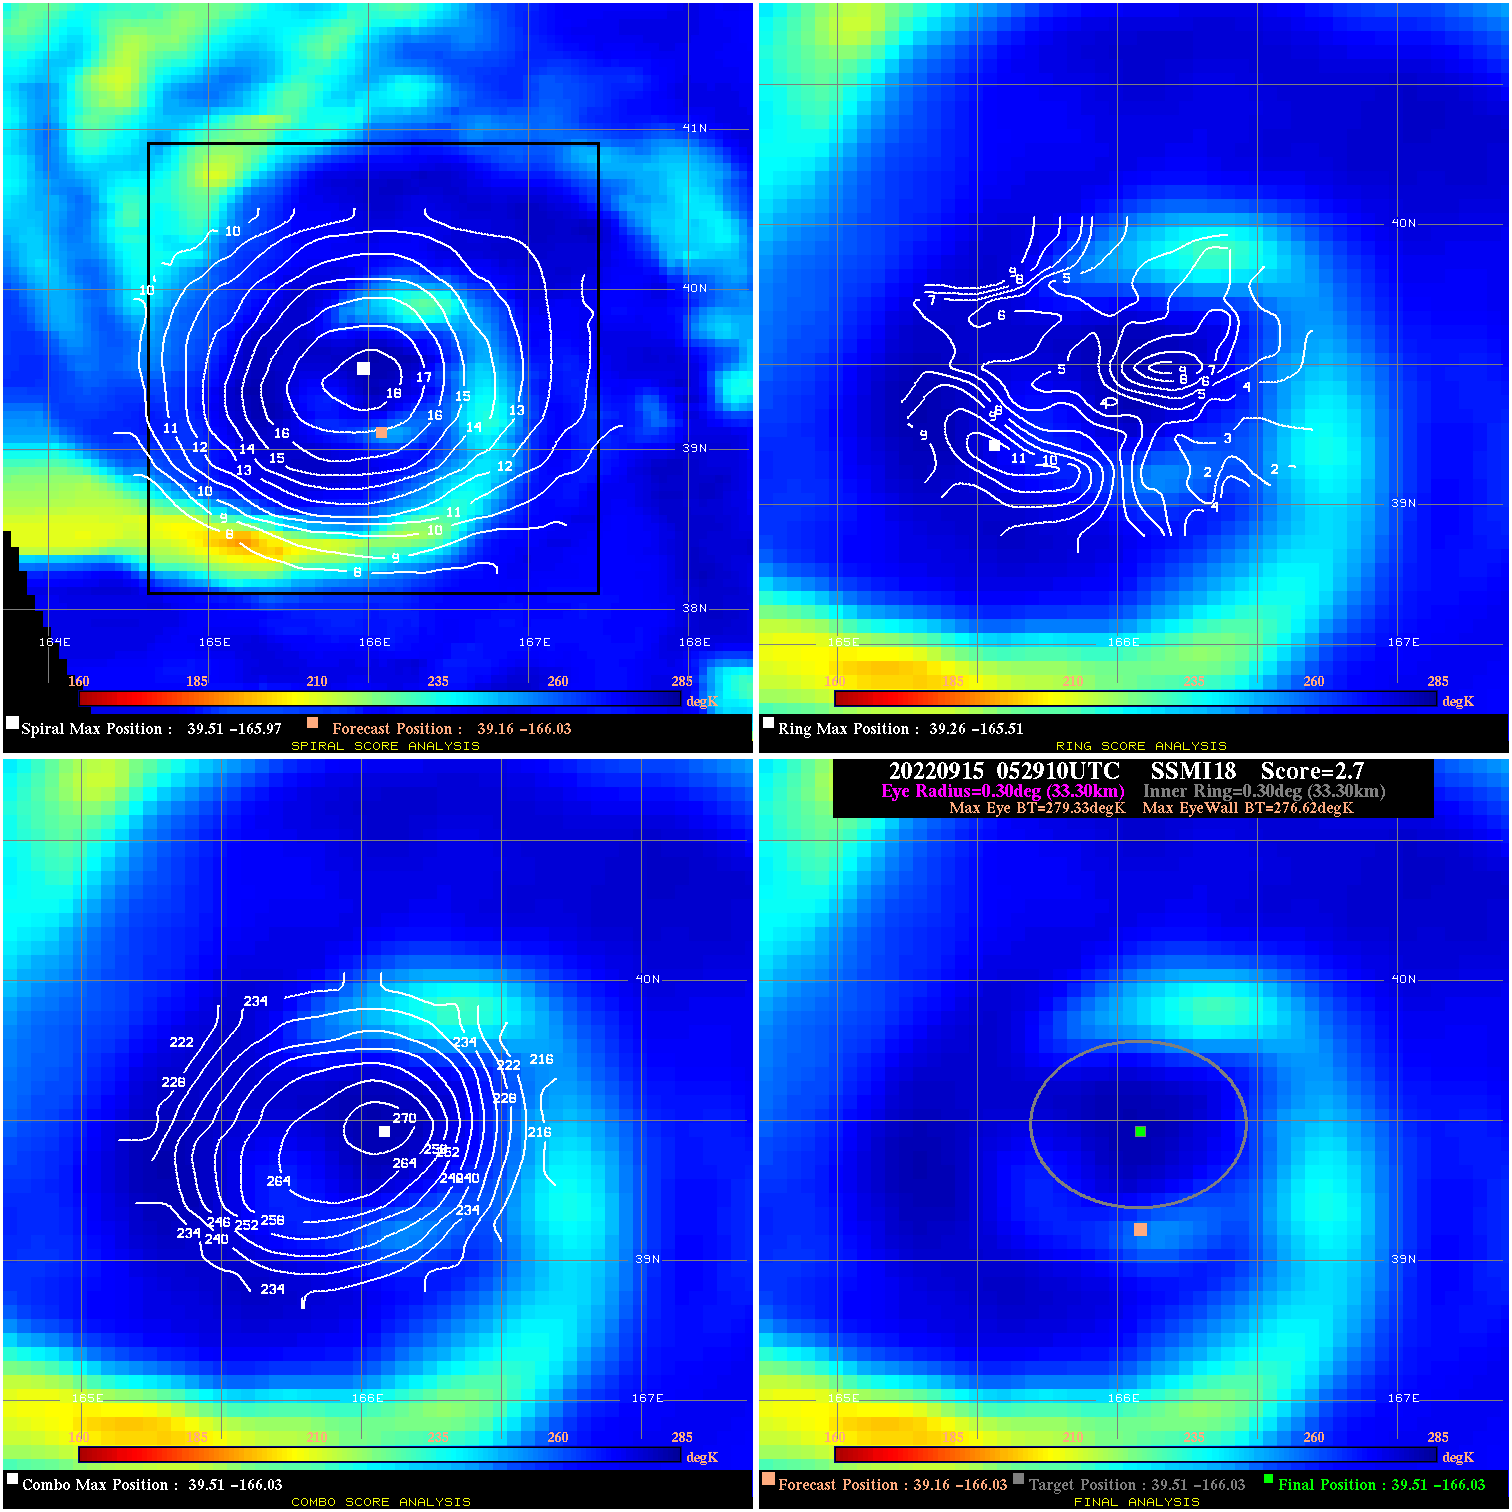
20220915 052910 2.7 N/A N/A 66.66 2.71 65.0 SSMI18 39.2 -166.0 39.5 -166.0 39.5 -166.0 Analysis Plot
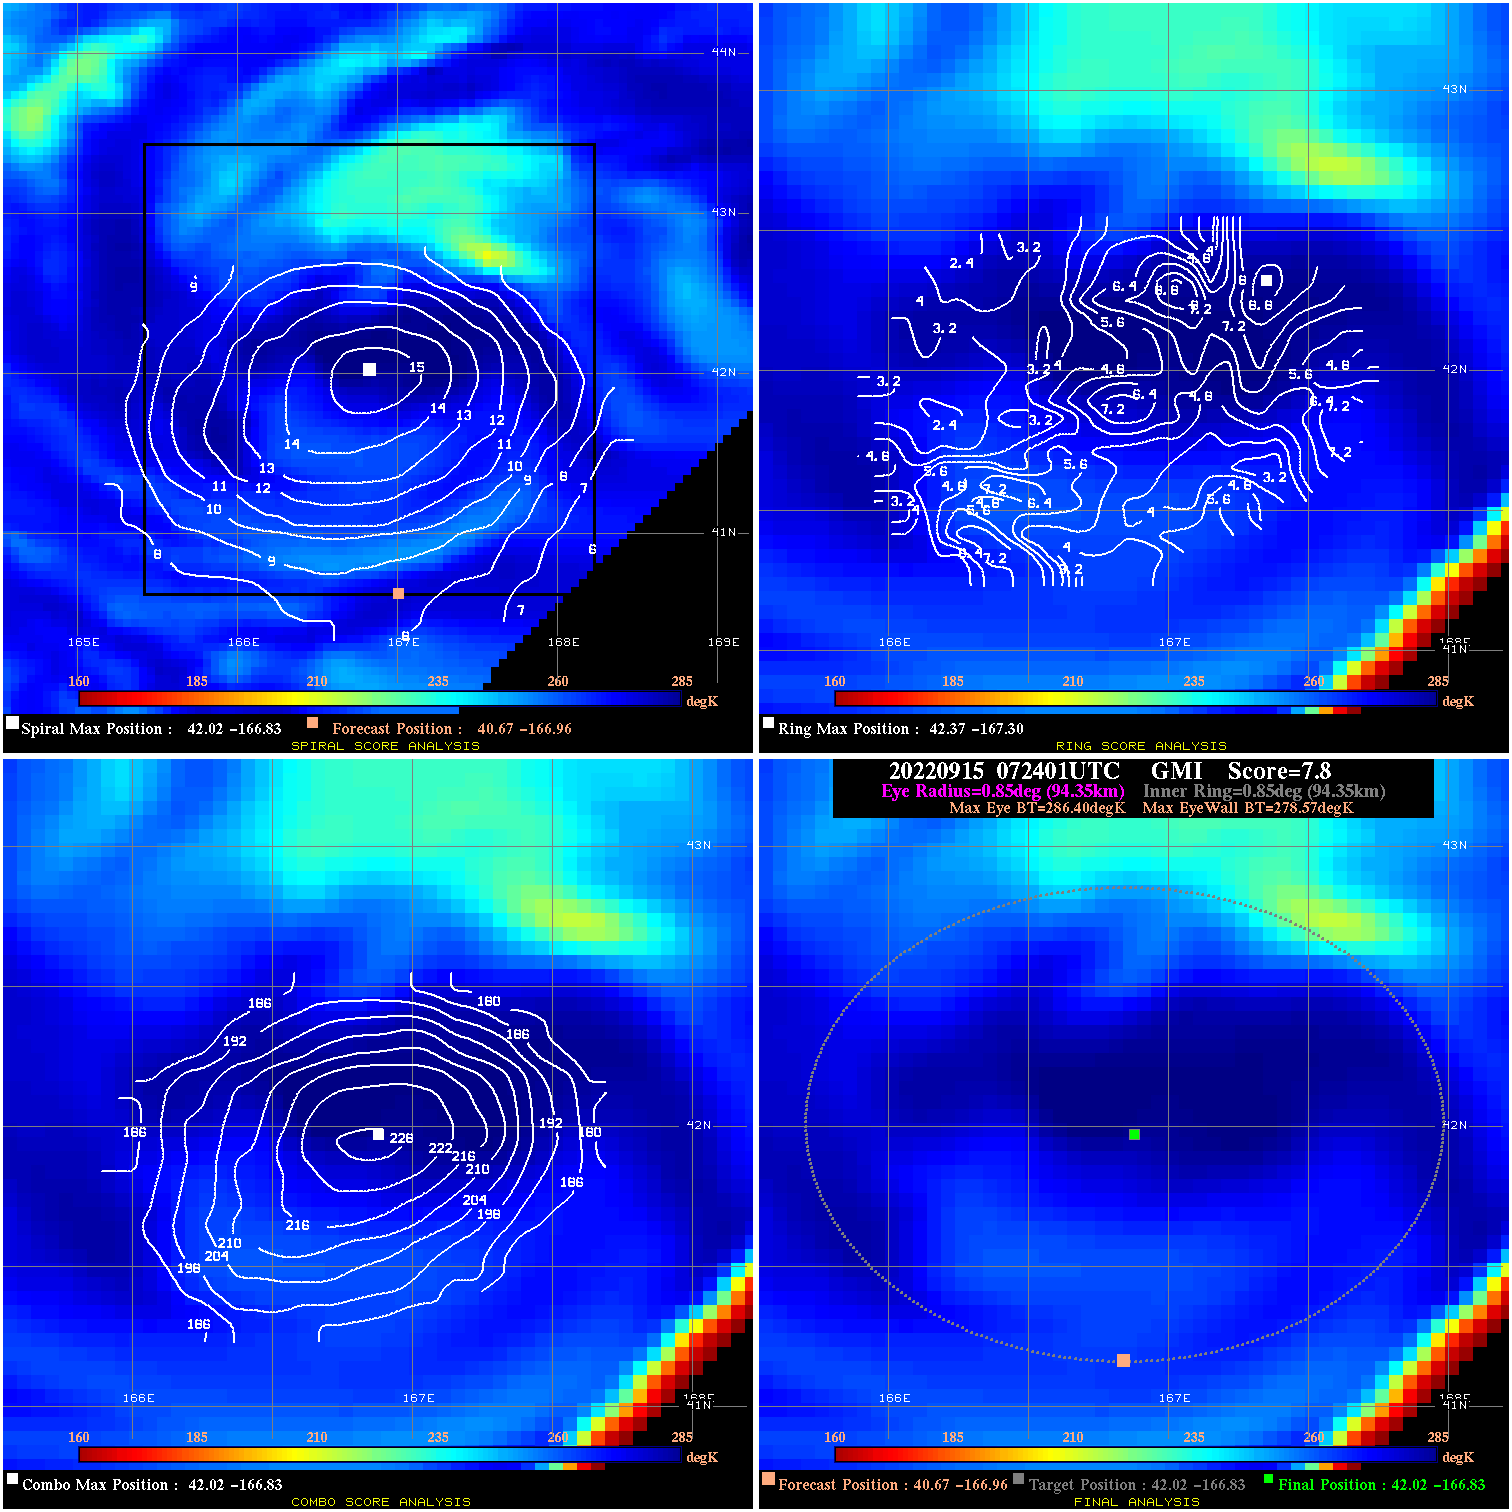
20220915 072401 7.8 N/A 5.5% 188.87 7.83 65.0 GMI 40.7 -167.0 42.0 -166.8 42.0 -166.8 Analysis Plot
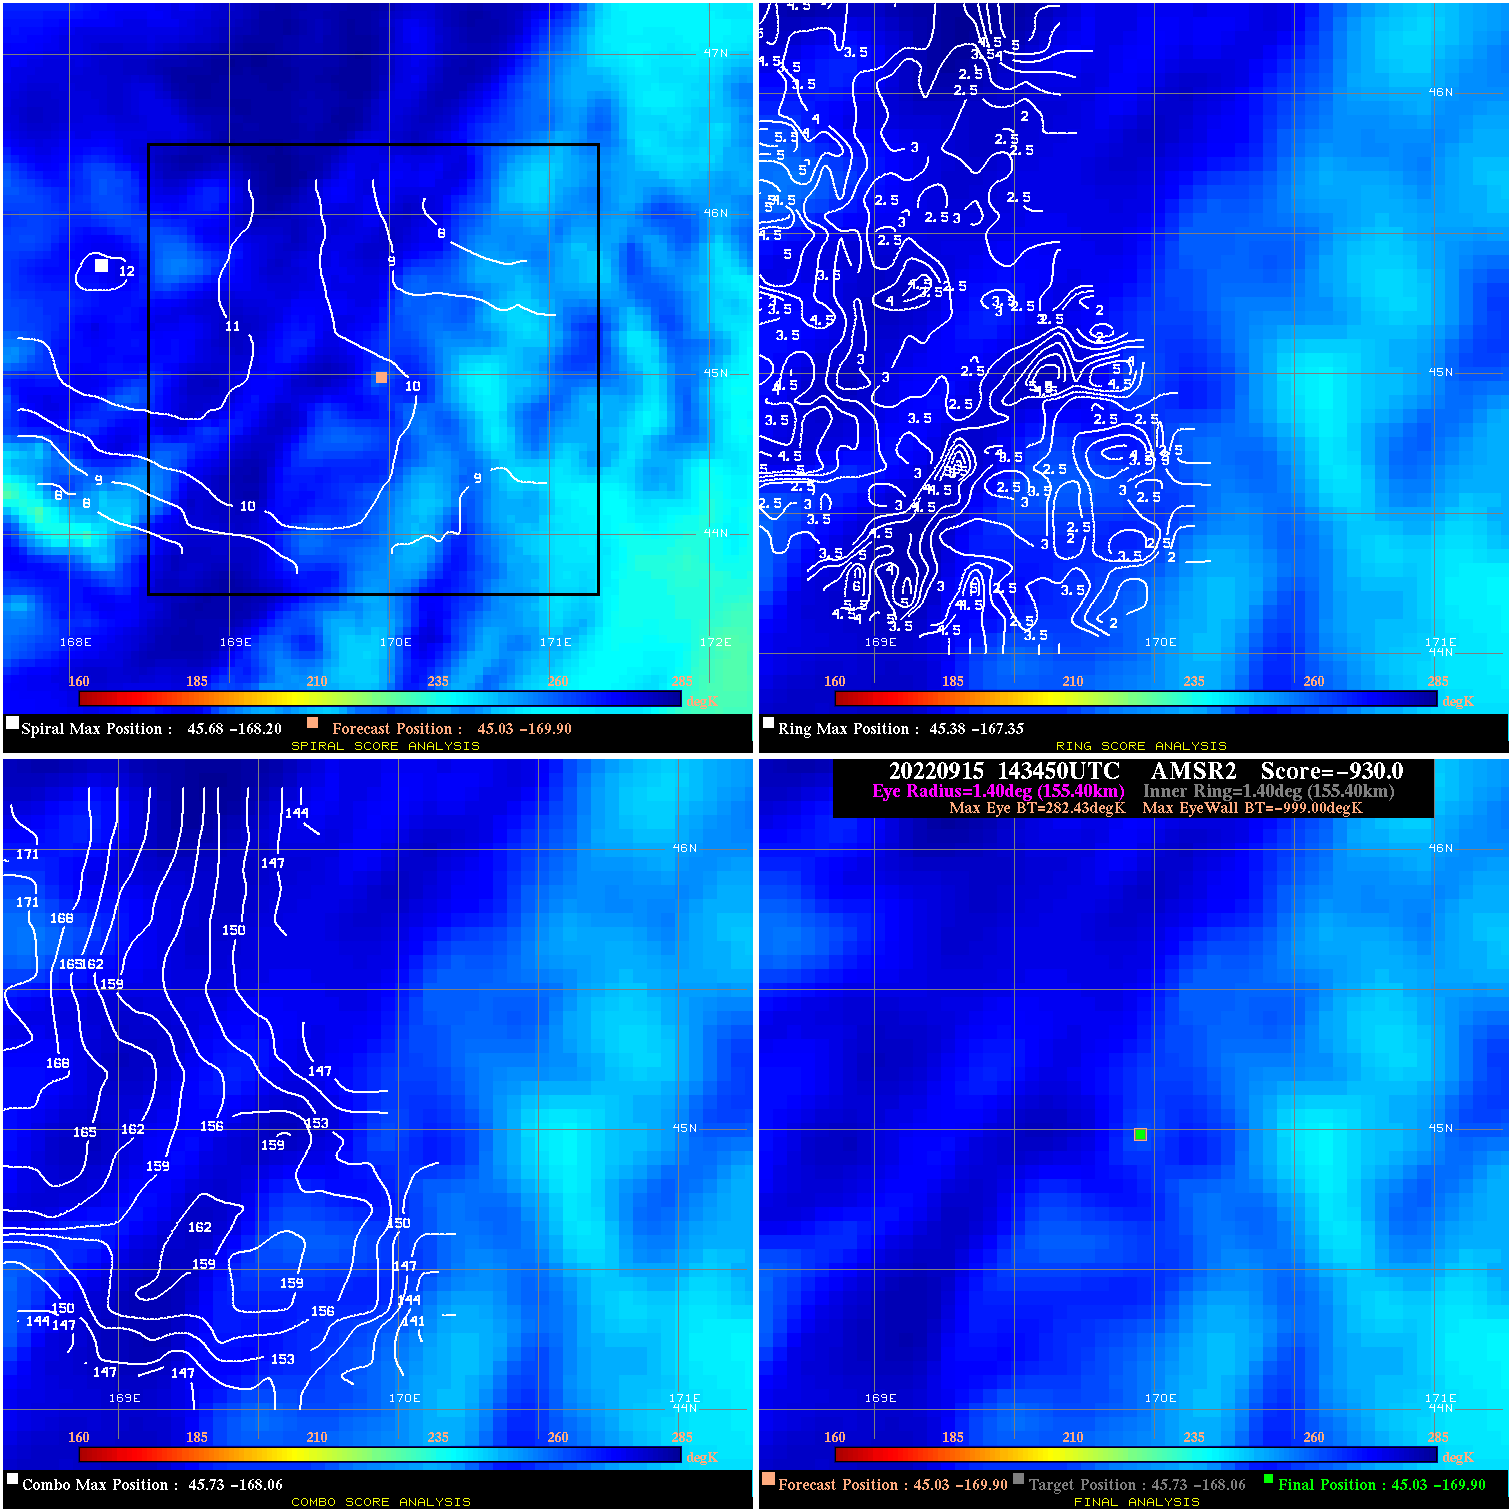
20220915 143450 -930.0 N/A N/A N/A 0.00 65.0 AMSR2 45.0 -169.9 45.0 -169.9 45.7 -168.1 Analysis Plot
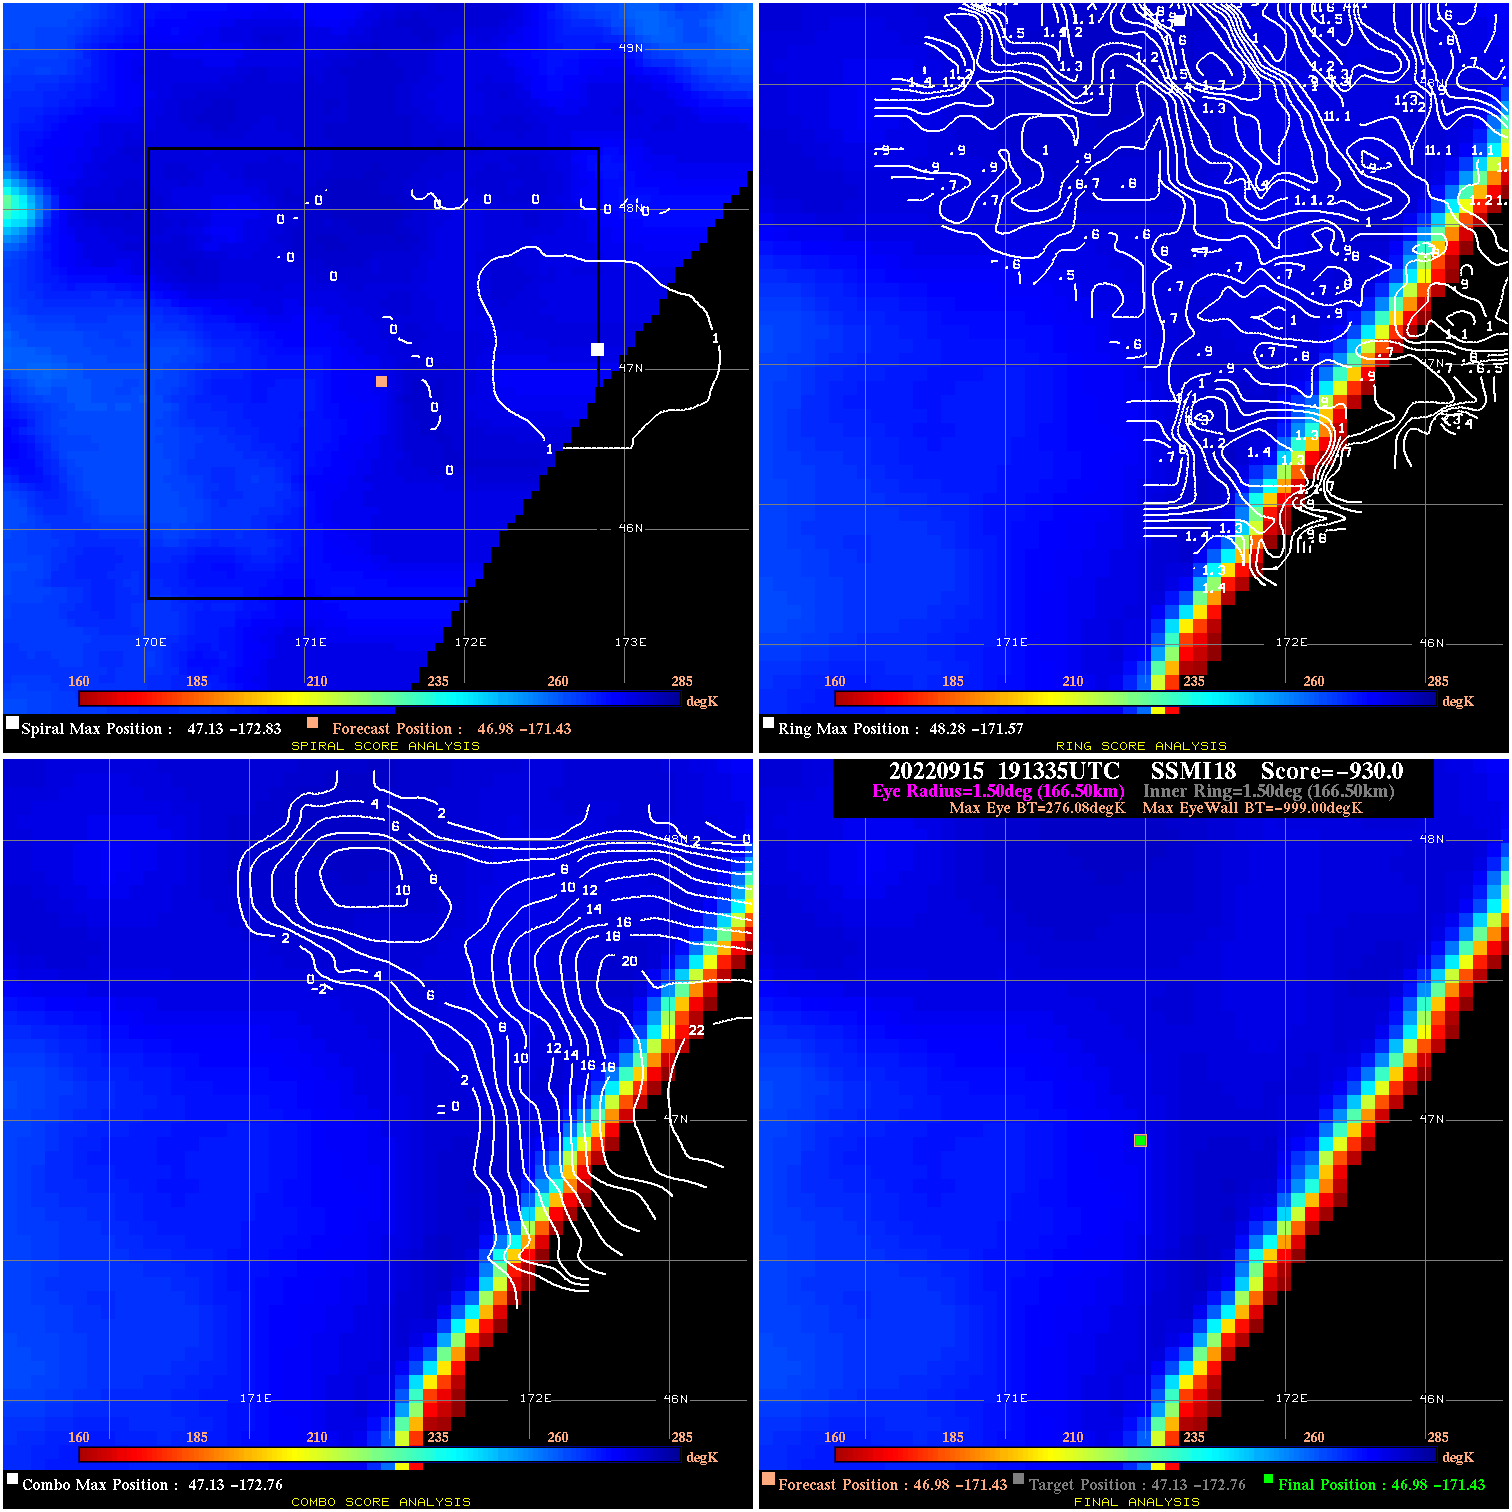
20220915 191335 -930.0 N/A N/A N/A 0.00 65.0 SSMI18 47.0 -171.4 47.0 -171.4 47.1 -172.8 Analysis Plot
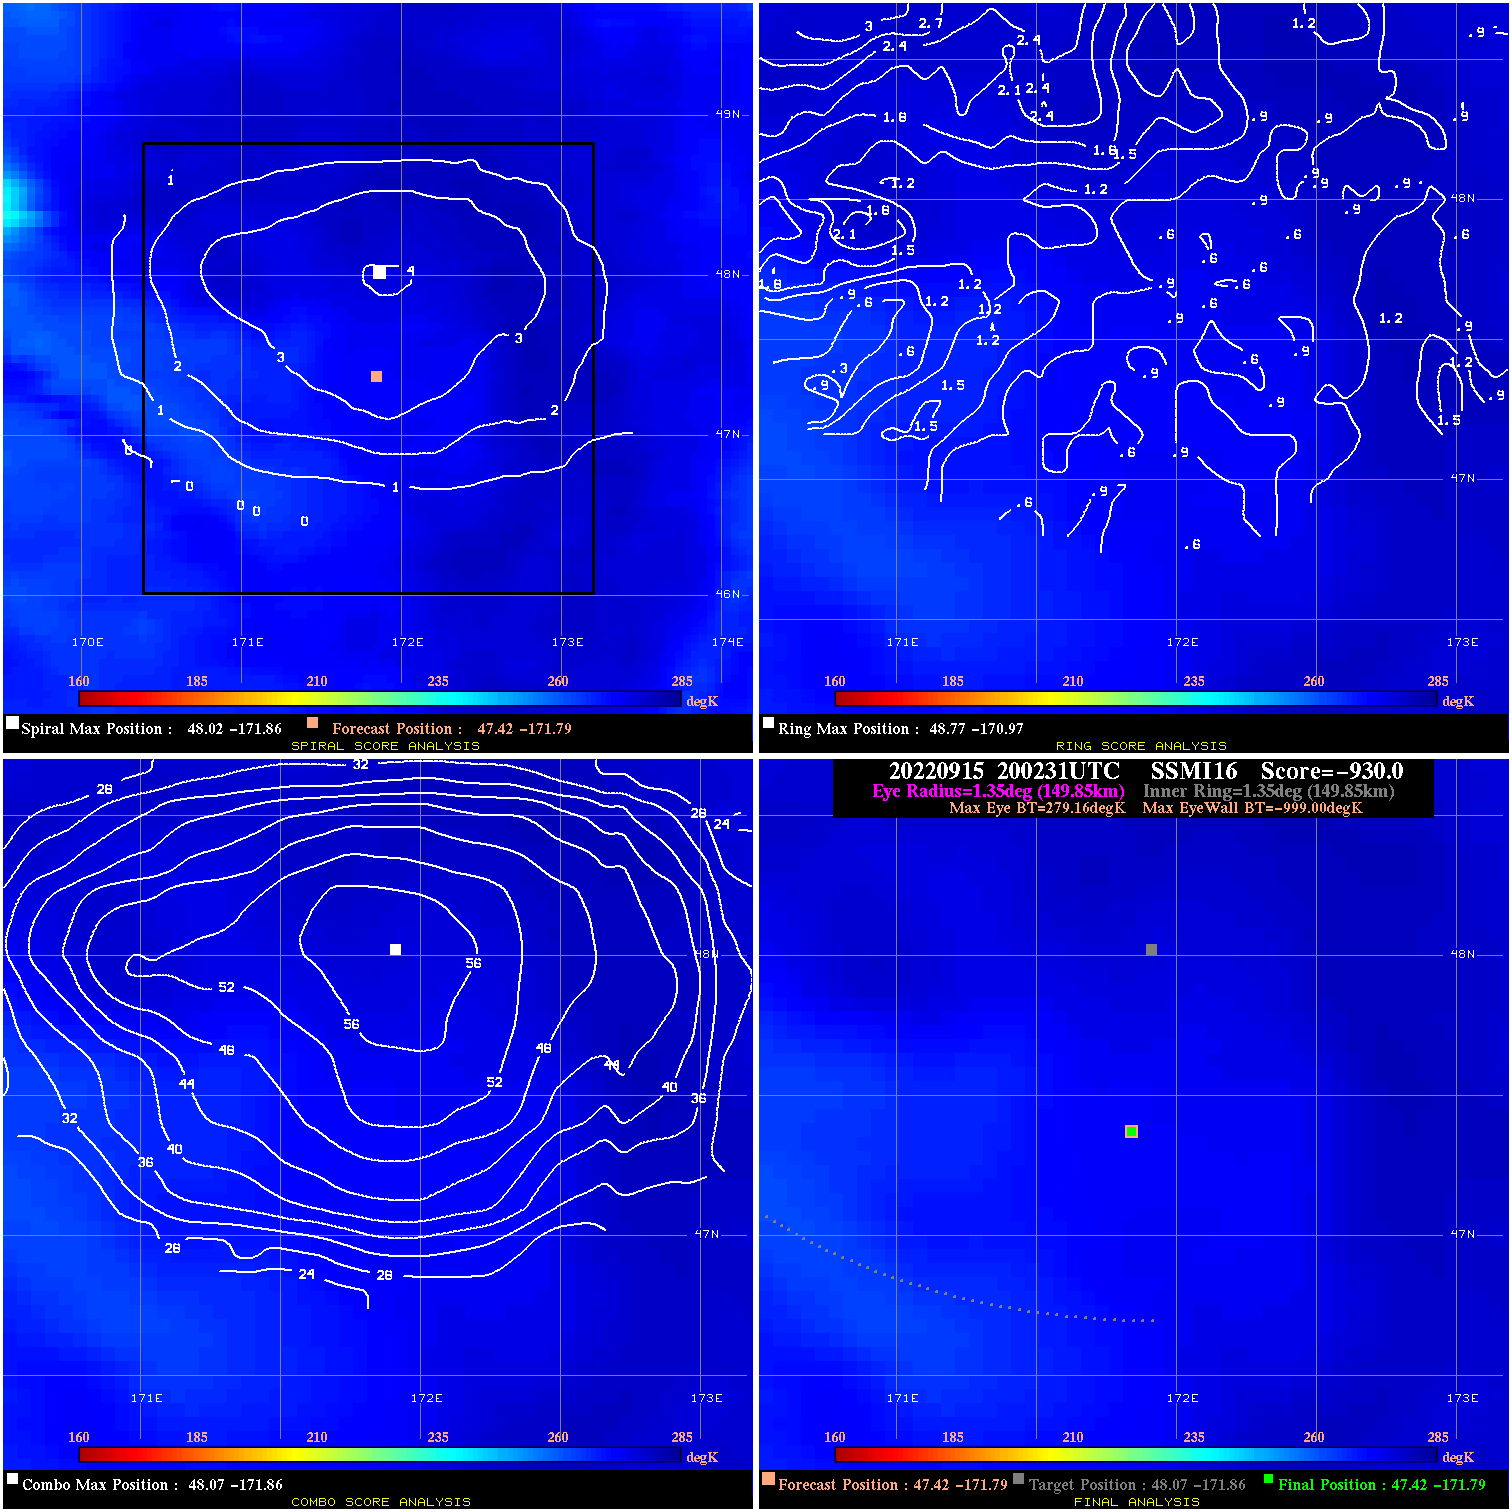
20220915 200231 -930.0 N/A N/A N/A 0.00 65.0 SSMI16 47.4 -171.8 47.4 -171.8 48.1 -171.9 Analysis Plot
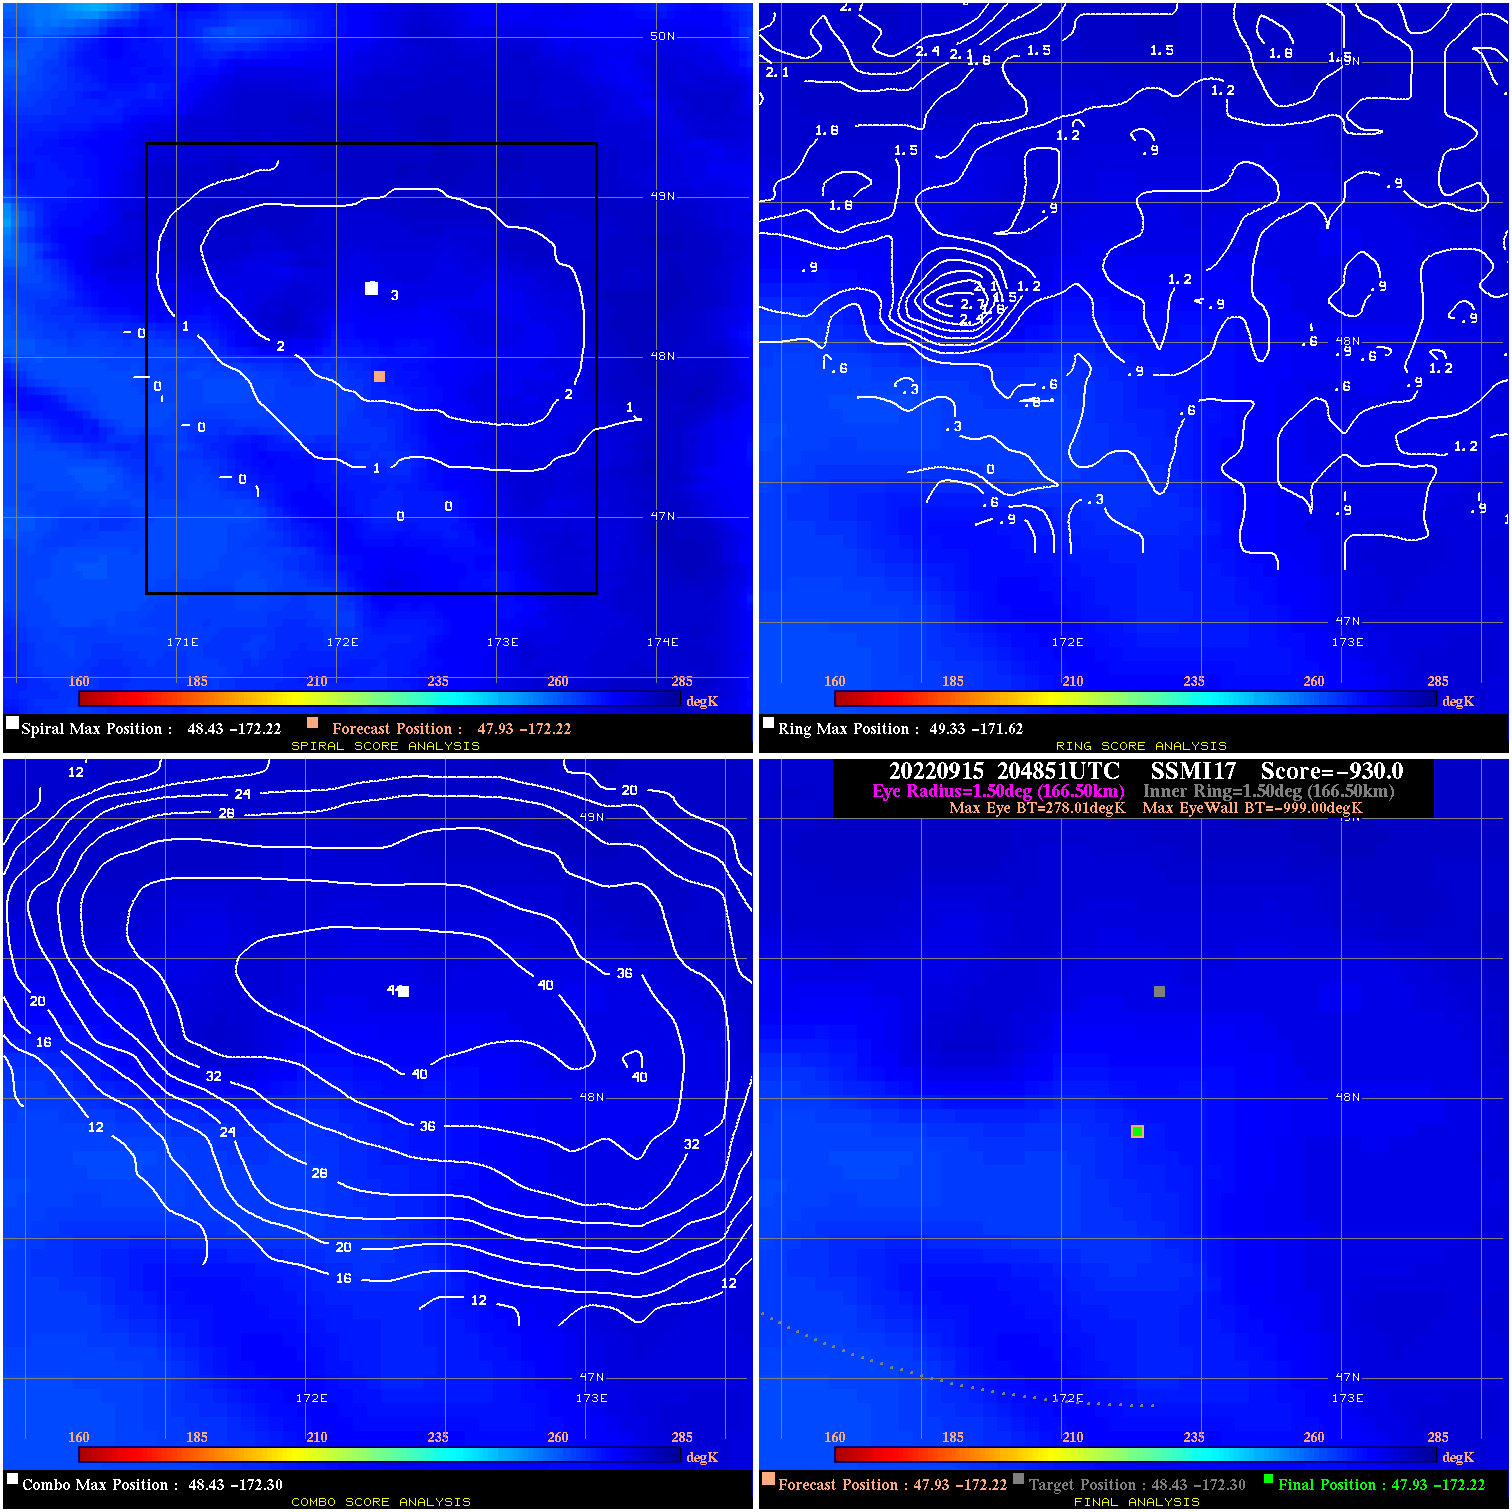
20220915 204851 -930.0 N/A N/A N/A 0.00 65.0 SSMI17 47.9 -172.2 47.9 -172.2 48.4 -172.3 Analysis Plot
|
|
Legend: - Date/Time are determined from PMW imagery at Forecast (initial guess) Lat/Lon position. - Positive/Negative Latitude = North/South Hemisphere; Longitude = Western/Eastern Hemisphere. - "Ring Diam" value indicates the estimated surface eyewall diameter in km (the MI eyewall edge diameter minus 10 km). - "Ring Pct" is the percentage of the "ring" (eyewall inner boundary) that is 1) colder than the "hot spot" (warmest eye pixel) in the eye by 20K, or 2) the percentage that is a) colder than 232K and b) colder than the "hot spot" by 10K, whichever is greater. - Values are red if Ring % <= 65, yellow/brown if Ring % <= 85 and green if Ring % > 85. - "Tb diff" is the difference between the "hot spot" (warmest eye pixel) and the warmest pixel on the eyewall. - Intensity score are listed as negative, and not used, when the JTWC or NHC estimated Vmax is <55 kts in order to rule out weak but highly symmetric TCs. - Error messages in intensity scores: -920 is used when the hottest pixel in the eye is <200K, to prevent false positives; -930 means <85% of eyewall has observations/data. |