Tropical Depression 05S
|
Passive Microwave (PMW) Intensity Information Advanced Dvorak Technique Version 9.1 |
--Overpass-- --ARCHER-- Ring Ring Eye BT -Forecast-
Date Time Sat Lat Lon Diam Pct TbDiff Score Meaning Vmax Lat Lon
20240112 023858 SSMISF17 -13.3 57.5 N/A N/A N/A N/A N/A 35.0 -13.6 56.4 Analysis Plot
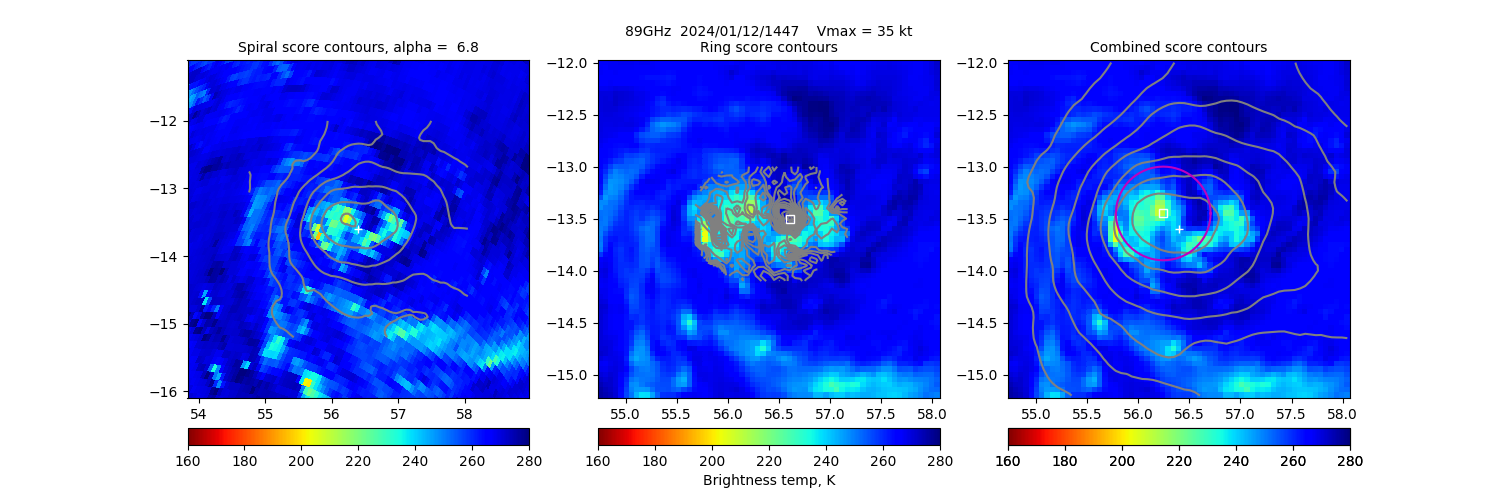
20240112 144749 GMI -13.4 56.3 90 4% 2.93 -2.93 N/A 35.0 -13.6 56.4 Analysis Plot
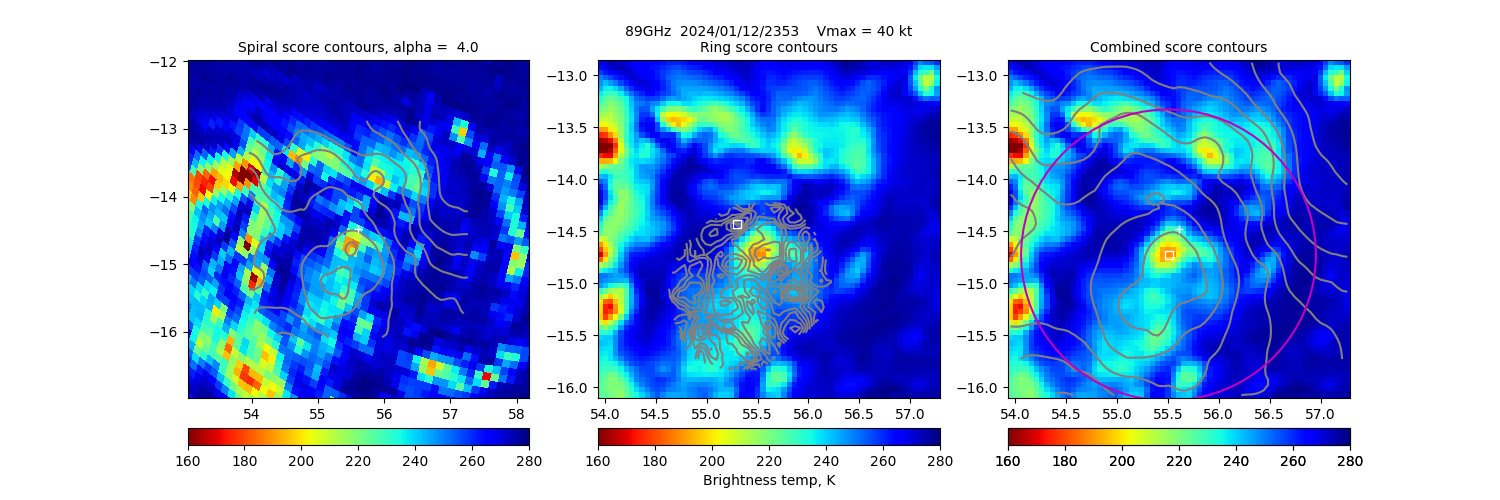
20240112 235305 SSMISF18 -14.7 55.5 N/A N/A N/A N/A N/A 40.0 -14.5 55.6 Analysis Plot
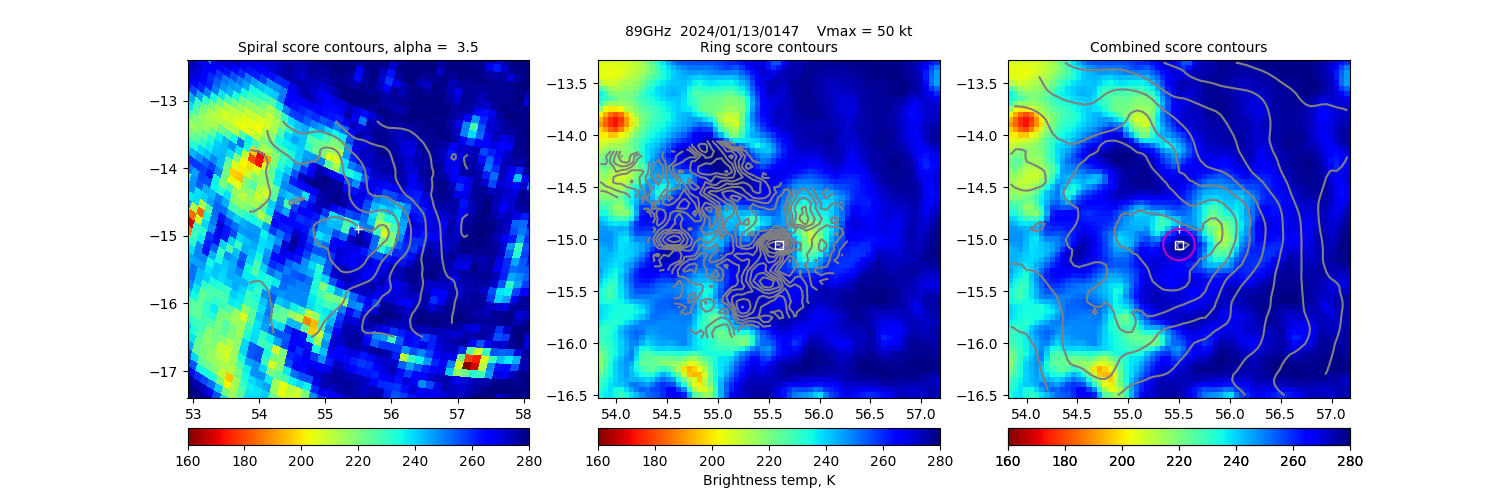
20240113 014709 SSMISF16 -15.1 55.5 23 4% 7.19 -7.19 N/A 50.0 -14.9 55.5 Analysis Plot
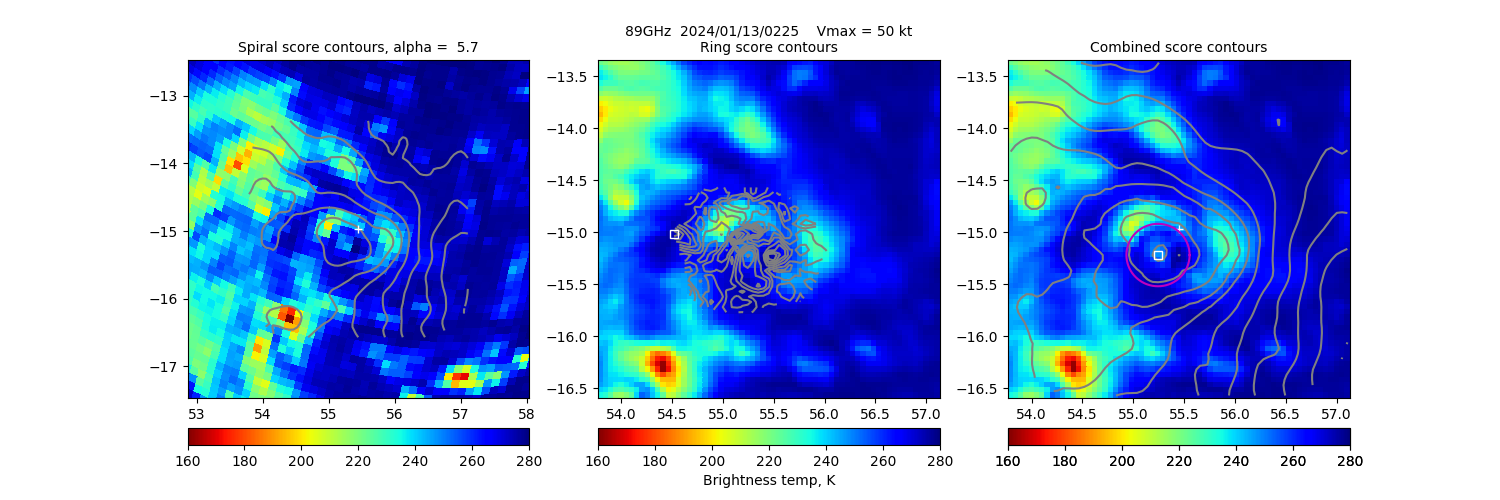
20240113 022533 SSMISF17 -15.2 55.2 57 N/A 3.60 -3.60 N/A 50.0 -15.0 55.5 Analysis Plot
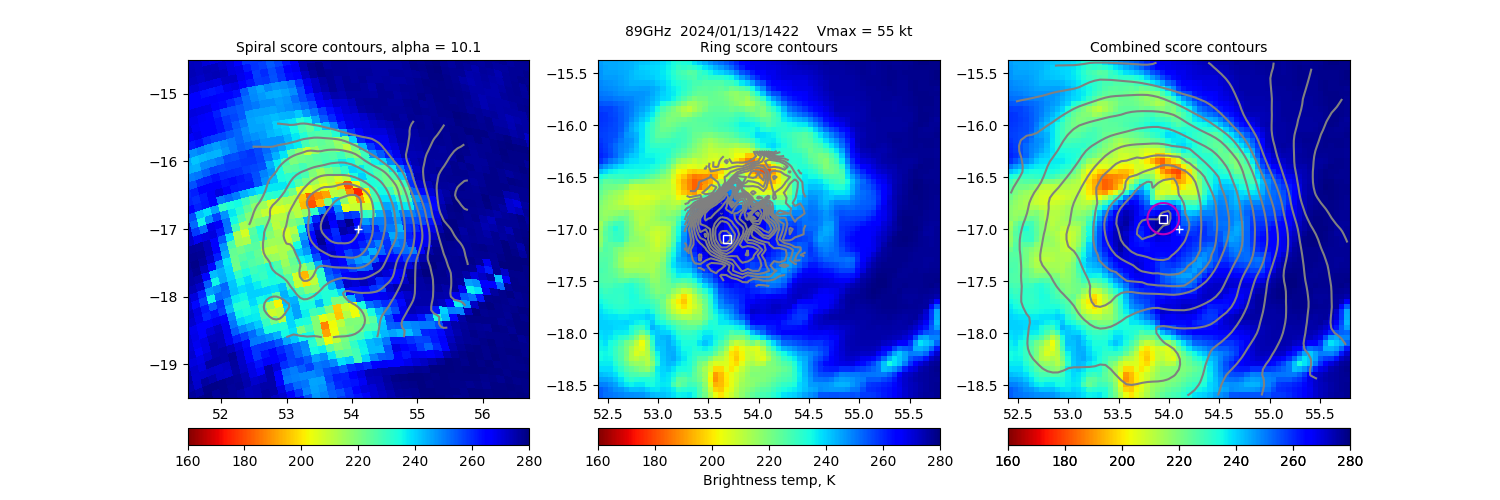
20240113 142216 SSMISF16 -16.9 53.9 23 25% 10.16 10.16 N/A 55.0 -17.0 54.1 Analysis Plot
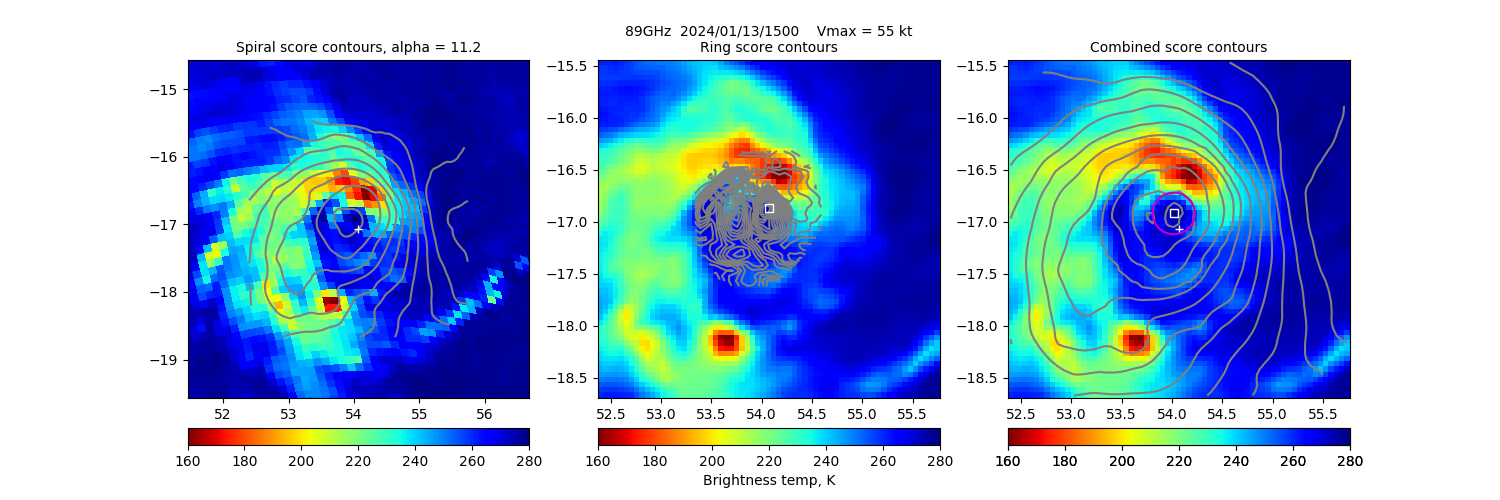
20240113 150019 SSMISF17 -16.9 54.0 34 33% 10.56 10.56 N/A 55.0 -17.1 54.1 Analysis Plot
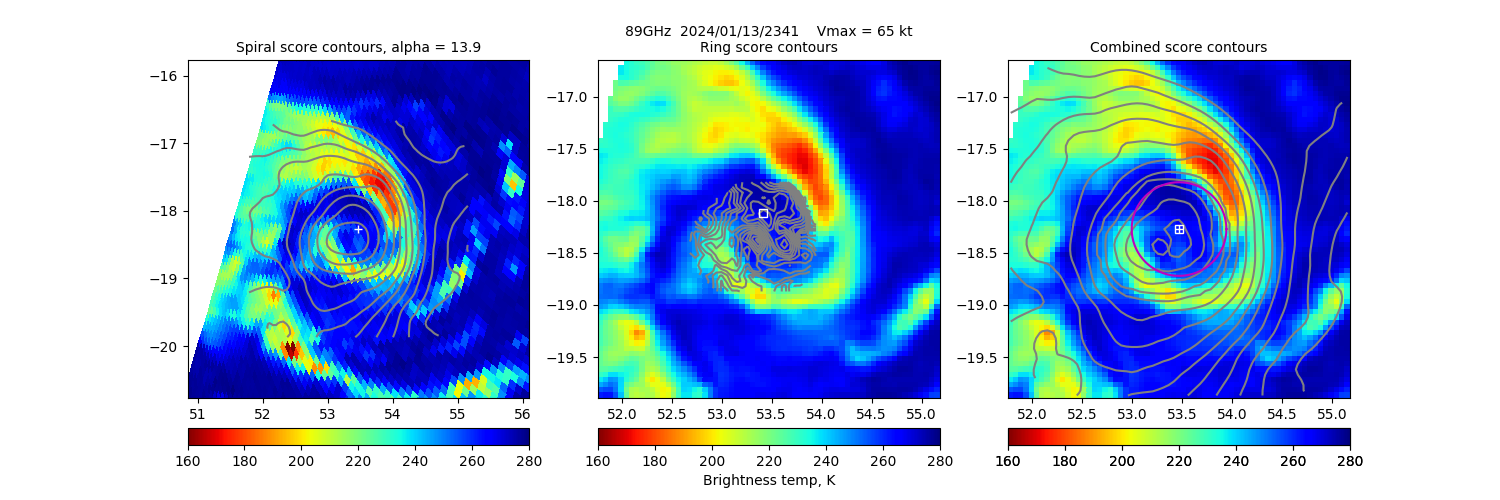
20240113 234145 SSMISF18 -18.3 53.5 90 53% 7.04 7.04 N/A 65.0 -18.3 53.5 Analysis Plot
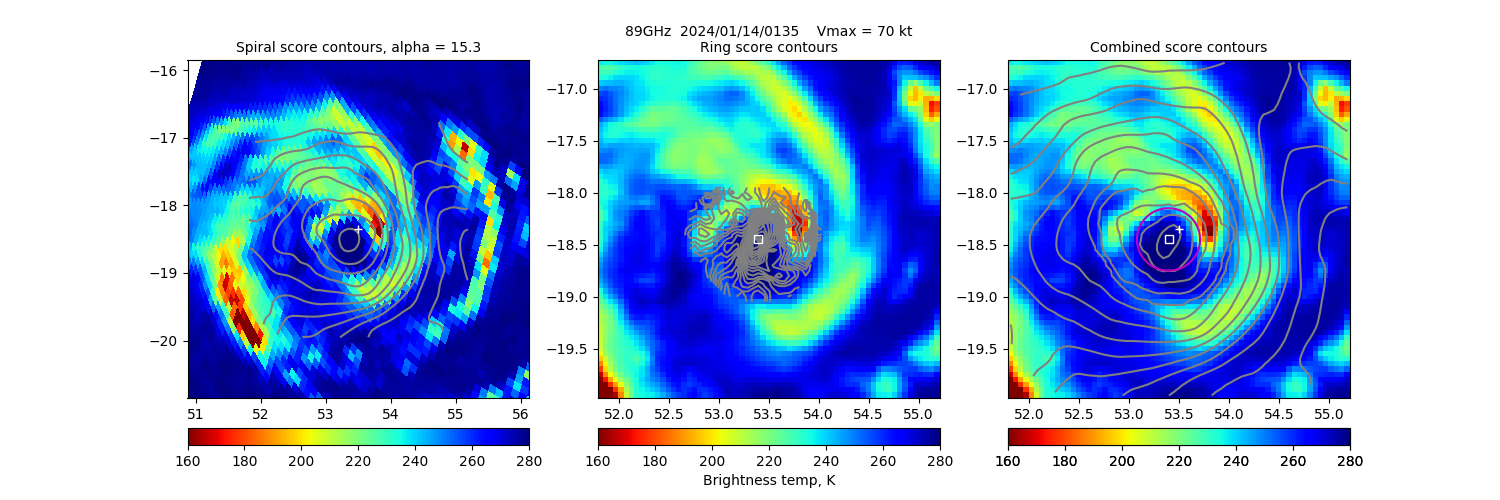
20240114 013529 SSMISF16 -18.5 53.4 57 25% 17.60 17.60 N/A 70.0 -18.4 53.5 Analysis Plot
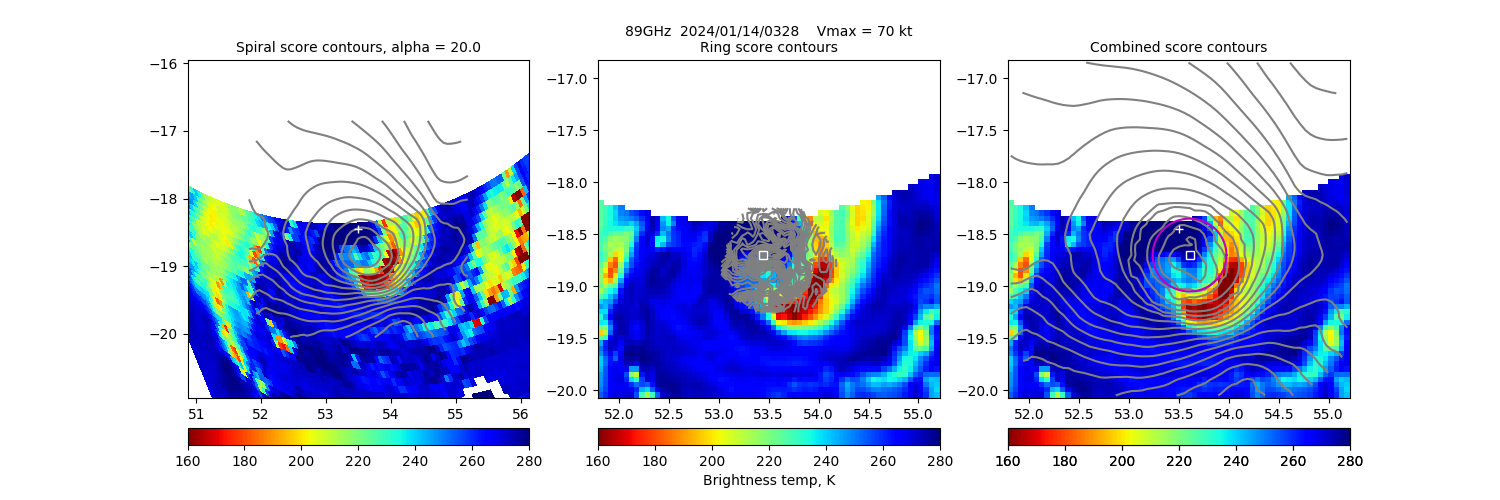
20240114 032856 GMI -18.7 53.6 N/A N/A N/A N/A N/A 70.0 -18.5 53.5 Analysis Plot
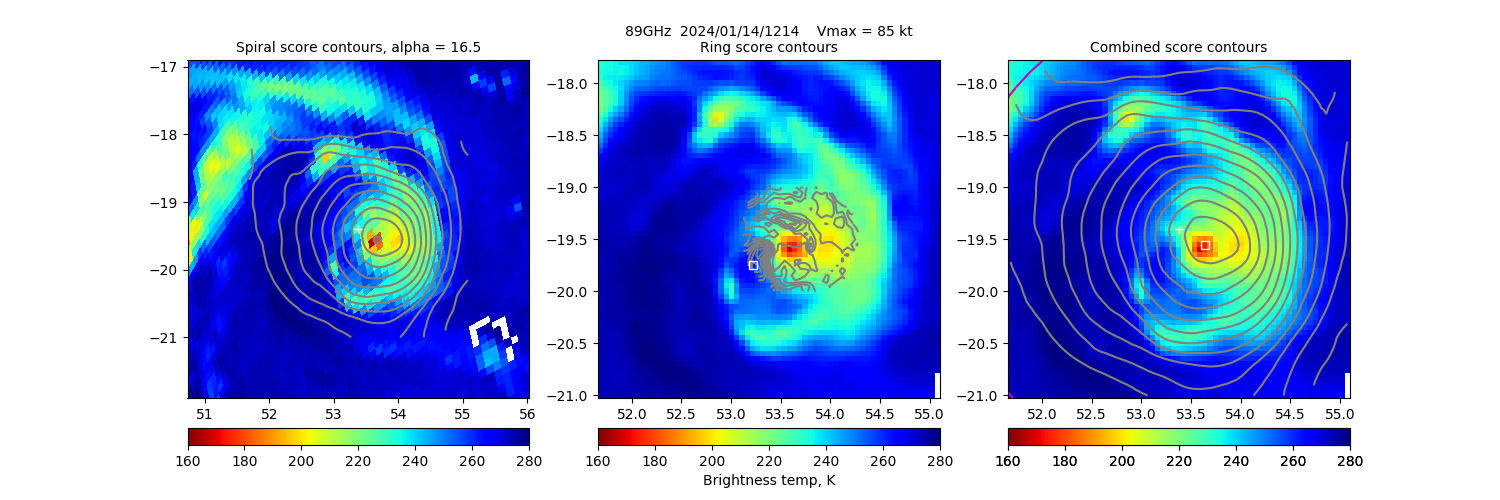
20240114 121411 SSMISF18 -19.5 53.7 N/A N/A N/A N/A N/A 85.0 -19.4 53.4 Analysis Plot
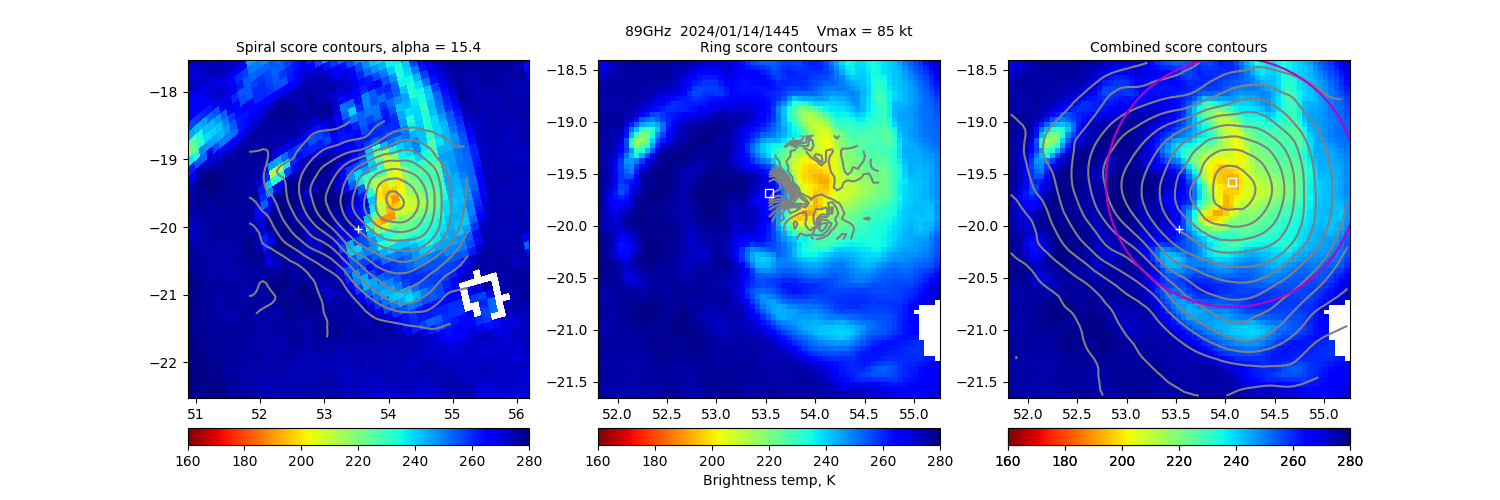
20240114 144559 SSMISF17 -19.6 54.1 N/A N/A N/A N/A N/A 85.0 -20.0 53.5 Analysis Plot
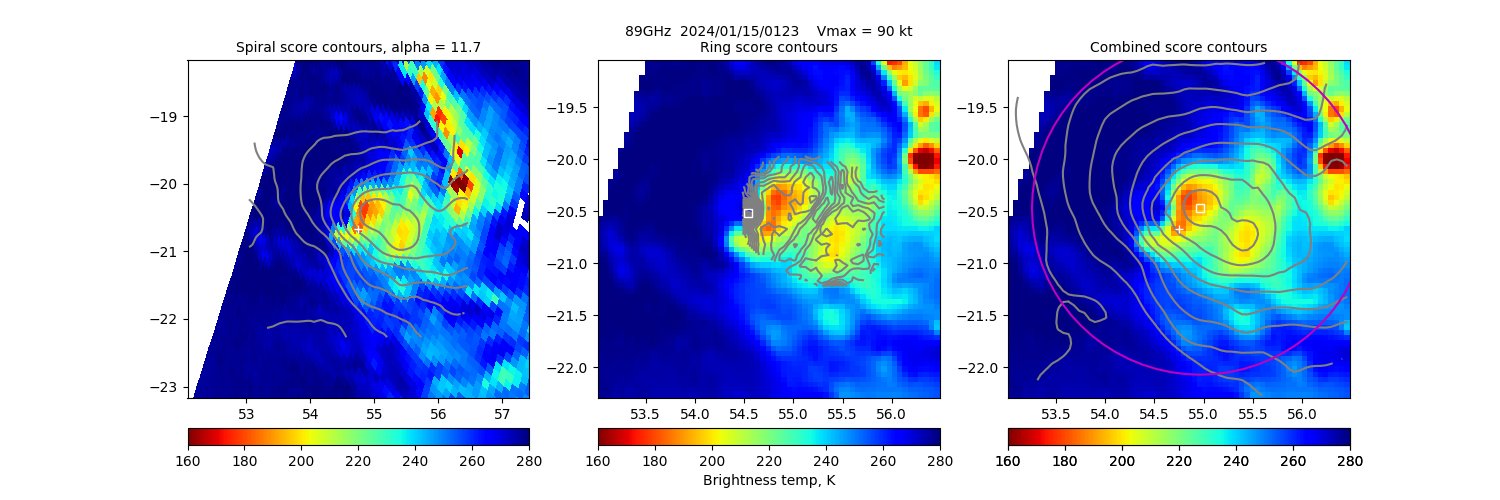
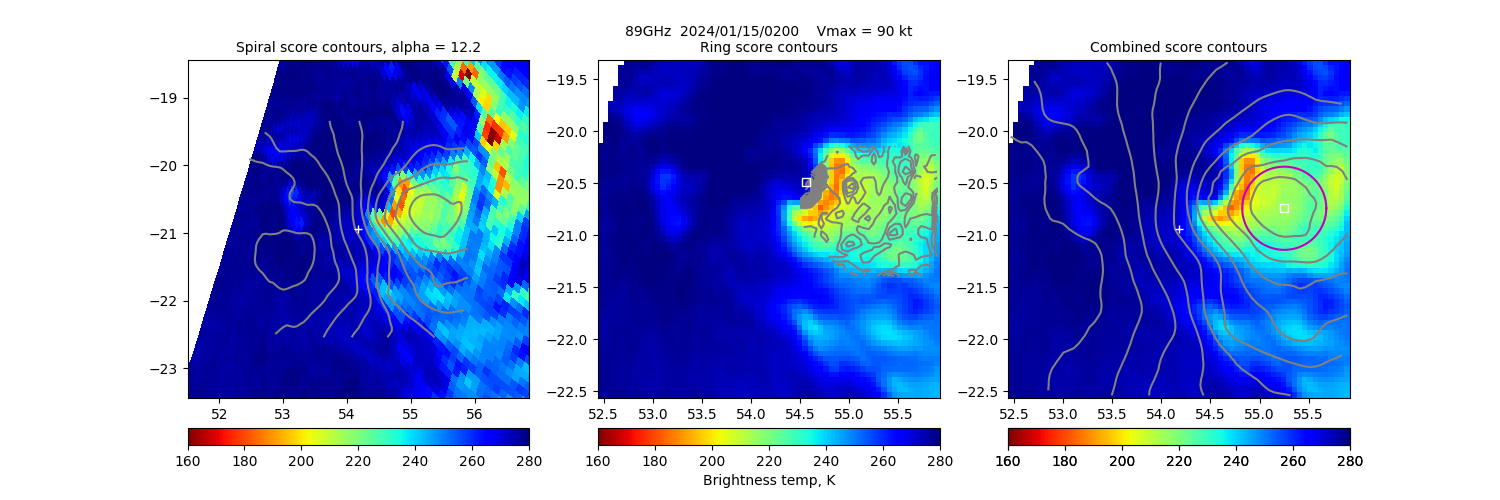
20240115 012303 SSMISF16 -20.5 55.0 N/A N/A N/A N/A N/A 90.0 -20.7 54.8 Analysis Plot
20240115 020047 SSMISF17 -20.7 55.3 N/A N/A N/A N/A N/A 90.0 -20.9 54.2 Analysis Plot
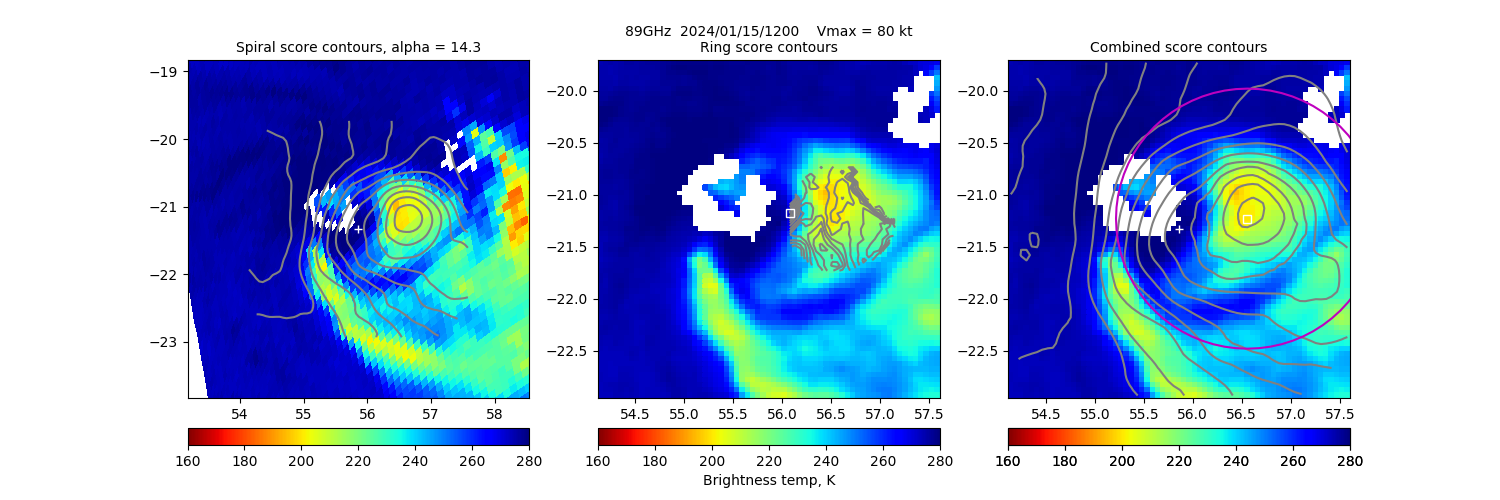
20240115 120052 SSMISF18 -21.2 56.6 N/A N/A N/A N/A N/A 80.0 -21.3 55.9 Analysis Plot
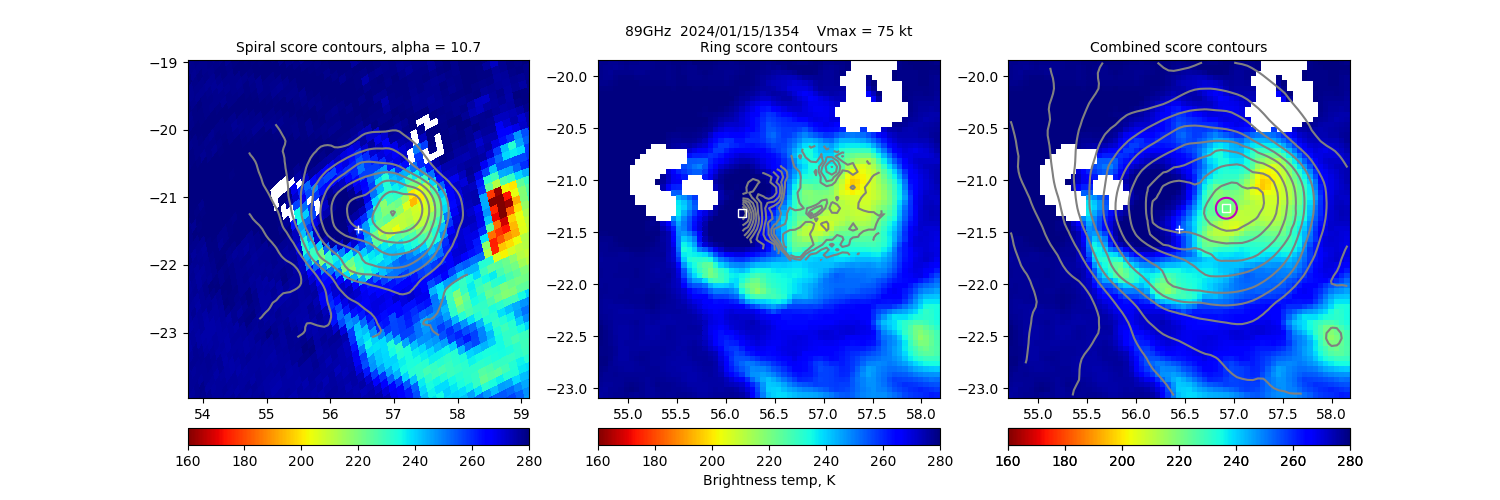
20240115 135416 SSMISF16 -21.3 56.9 N/A N/A N/A N/A N/A 75.0 -21.5 56.4 Analysis Plot
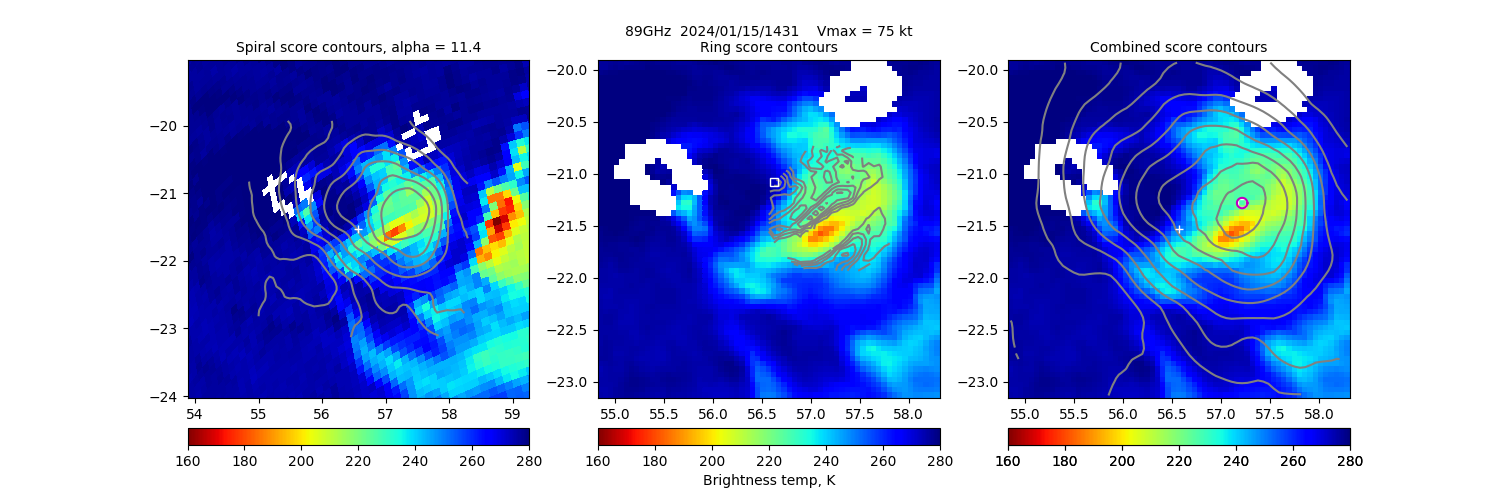
20240115 143158 SSMISF17 -21.3 57.2 5 7% 0.32 0.32 N/A 75.0 -21.5 56.6 Analysis Plot
20240115 231635 SSMISF18 -22.2 58.1 112 47% 12.57 12.57 N/A 65.0 -22.0 57.7 Analysis Plot
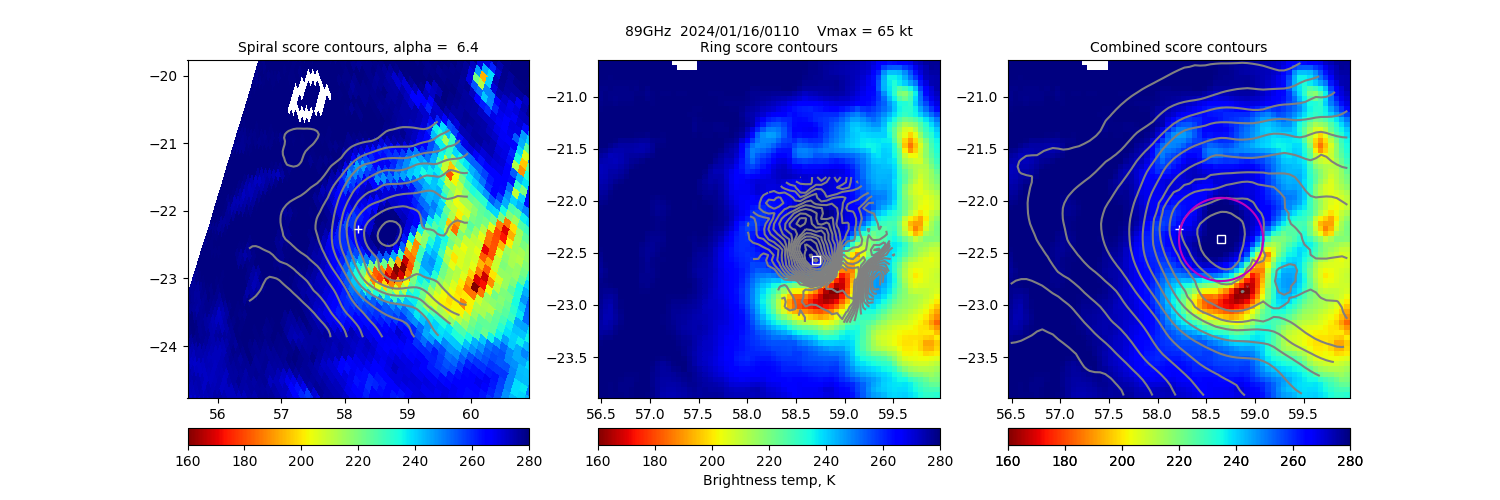
20240116 011005 SSMISF16 -22.4 58.7 79 36% 12.59 12.59 N/A 65.0 -22.3 58.2 Analysis Plot
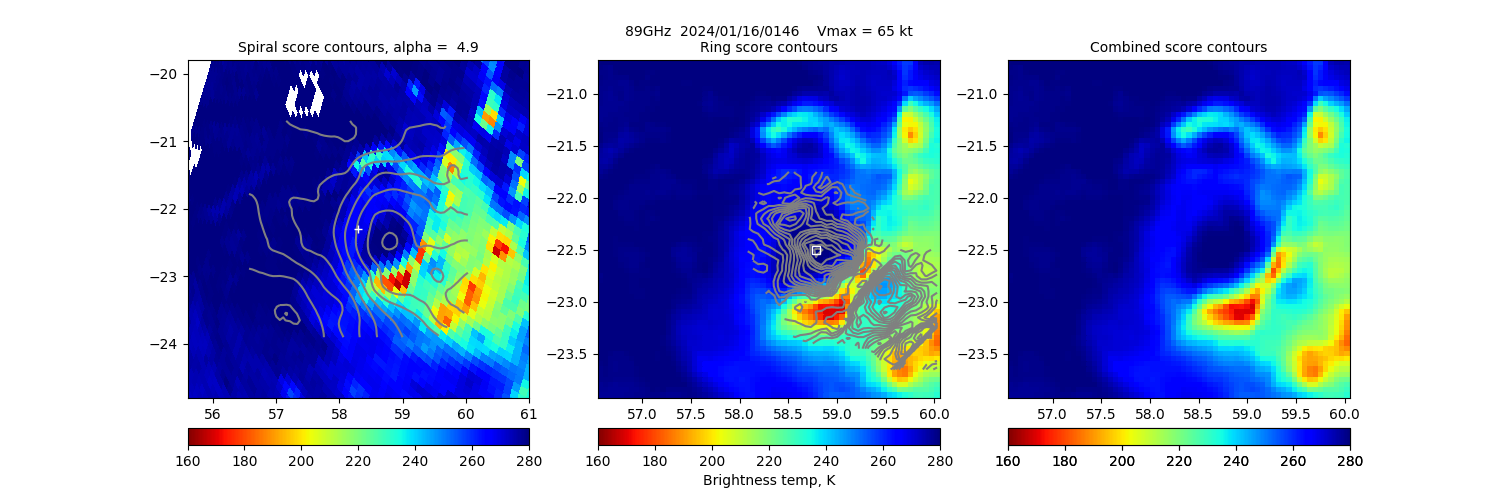
20240116 014659 SSMISF17 -22.5 58.8 90 36% 14.50 14.50 N/A 65.0 -22.3 58.3 Analysis Plot
20240116 114655 SSMISF18 -23.7 59.8 N/A N/A N/A N/A N/A 50.0 -22.8 60.0 Analysis Plot
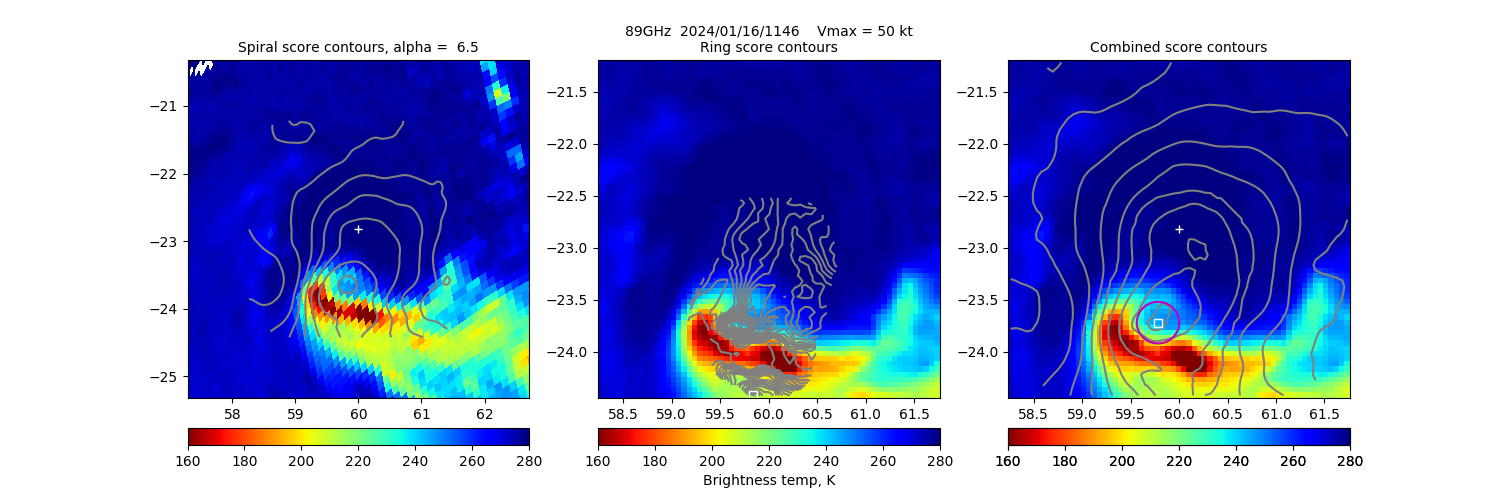
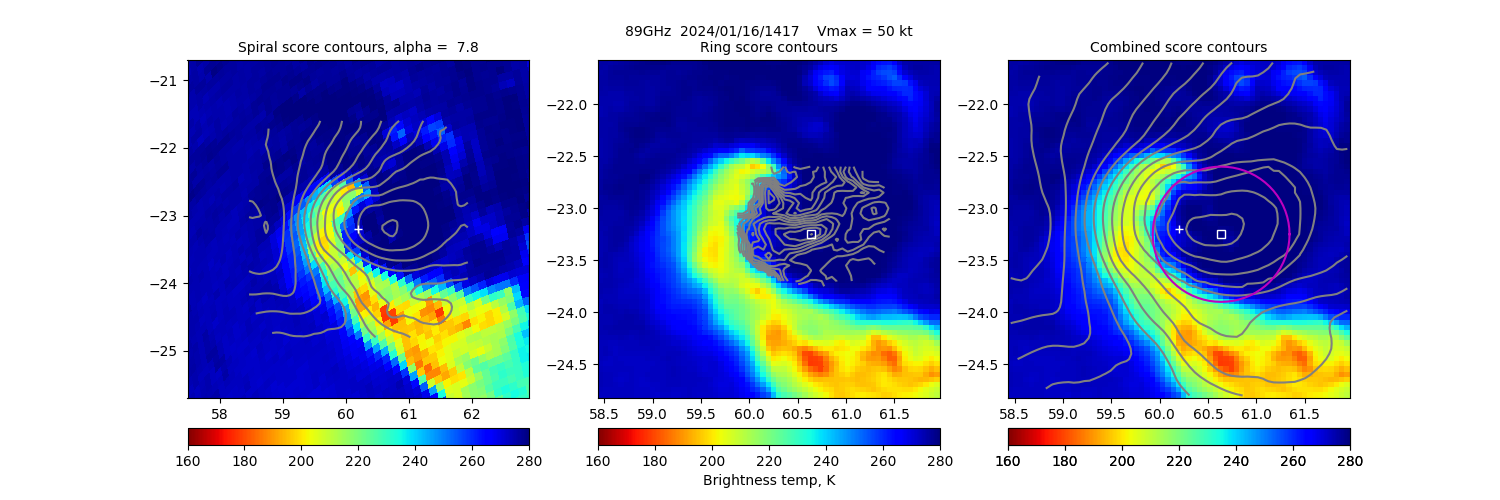
20240116 141739 SSMISF17 -23.3 60.6 135 46% 3.10 -3.10 N/A 50.0 -23.2 60.2 Analysis Plot
20240116 225933 SSMISF18 -23.8 62.5 N/A N/A N/A N/A N/A 55.0 -23.4 61.6 Analysis Plot
20240117 005648 SSMISF16 -23.9 62.7 N/A N/A N/A N/A N/A 55.0 -23.4 62.0 Analysis Plot
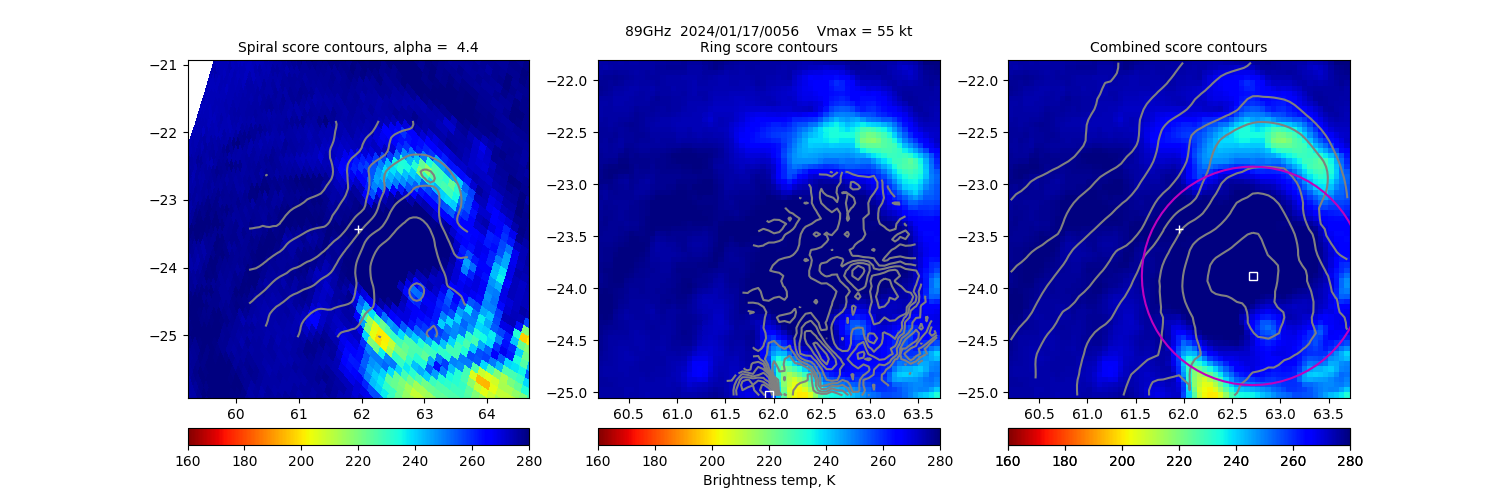
20240117 013320 SSMISF17 -24.4 62.7 146 17% 2.38 2.38 N/A 55.0 -24.3 63.0 Analysis Plot
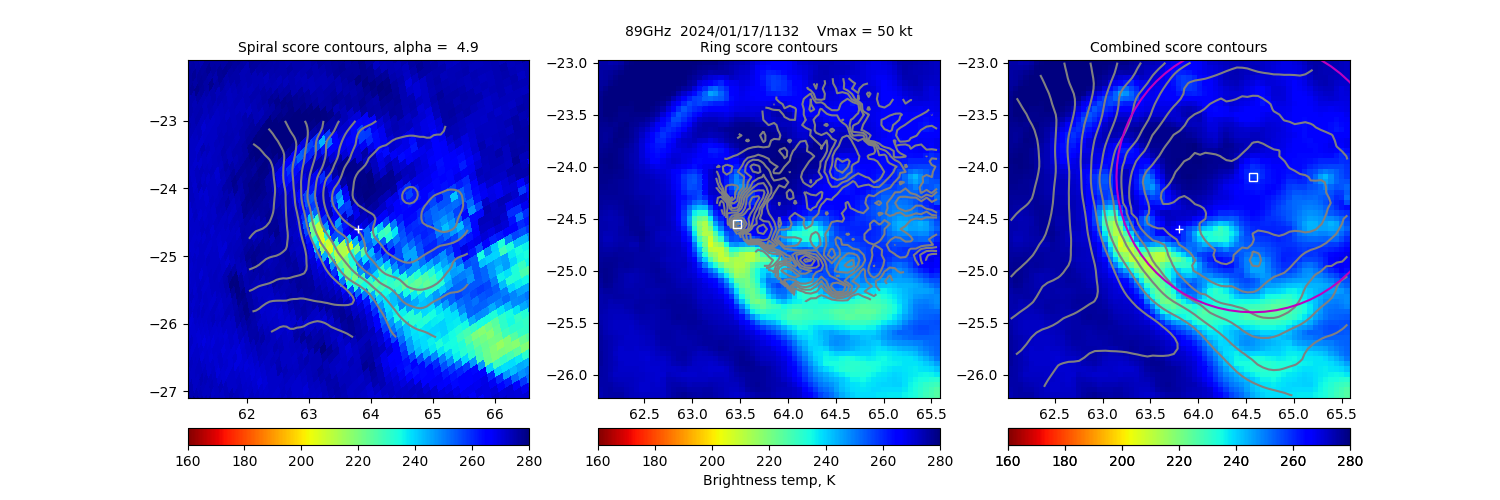
20240117 113258 SSMISF18 -24.1 64.6 N/A N/A N/A N/A N/A 50.0 -24.6 63.8 Analysis Plot
20240117 132641 SSMISF16 -24.3 65.2 N/A N/A N/A N/A N/A 50.0 -24.7 64.0 Analysis Plot
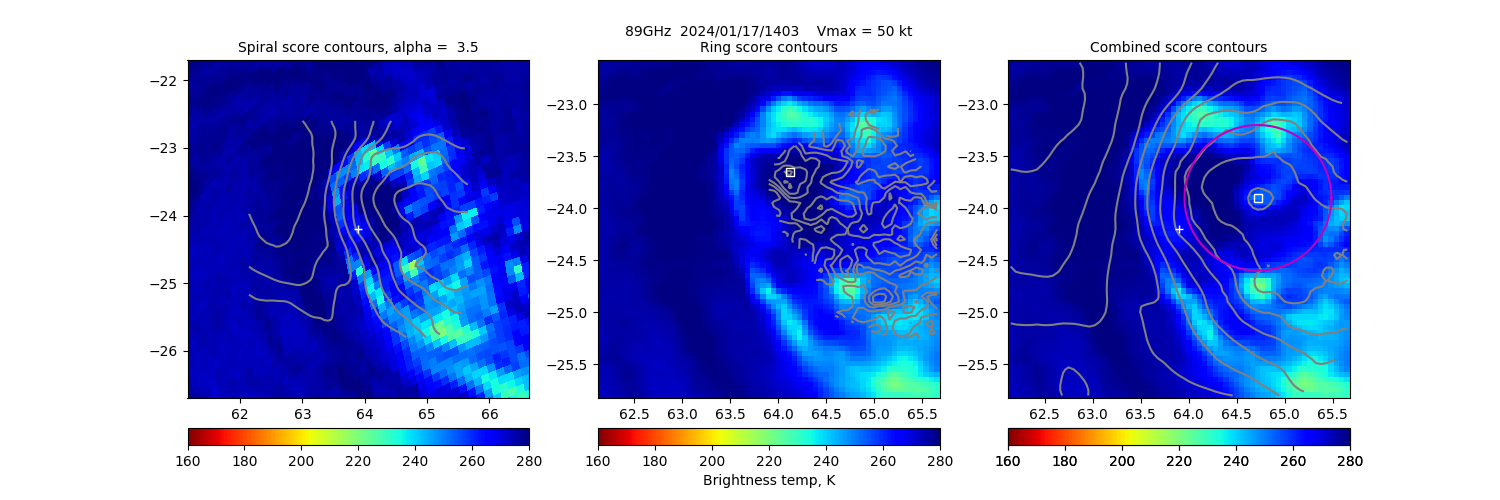
20240117 140332 SSMISF17 -23.9 64.7 146 7% 5.51 -5.51 N/A 50.0 -24.2 63.9 Analysis Plot
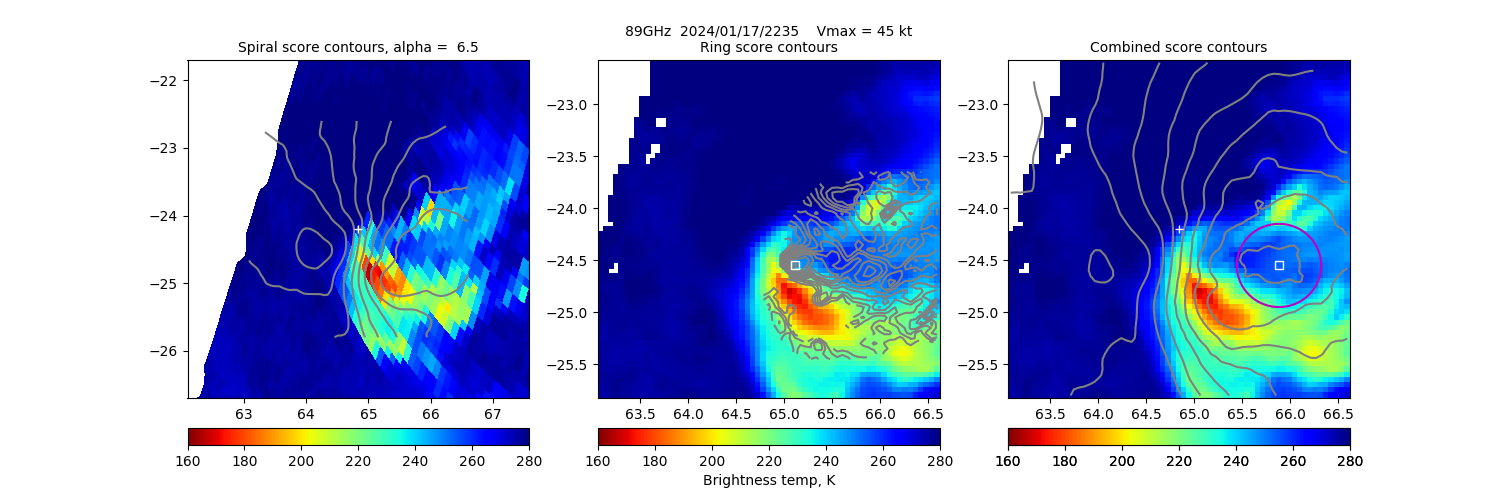
20240117 223538 SSMISF18 -24.5 65.9 79 42% 5.33 -5.33 N/A 45.0 -24.2 64.8 Analysis Plot
20240118 004340 SSMISF16 -24.1 65.7 N/A N/A N/A N/A N/A 45.0 -24.2 65.0 Analysis Plot
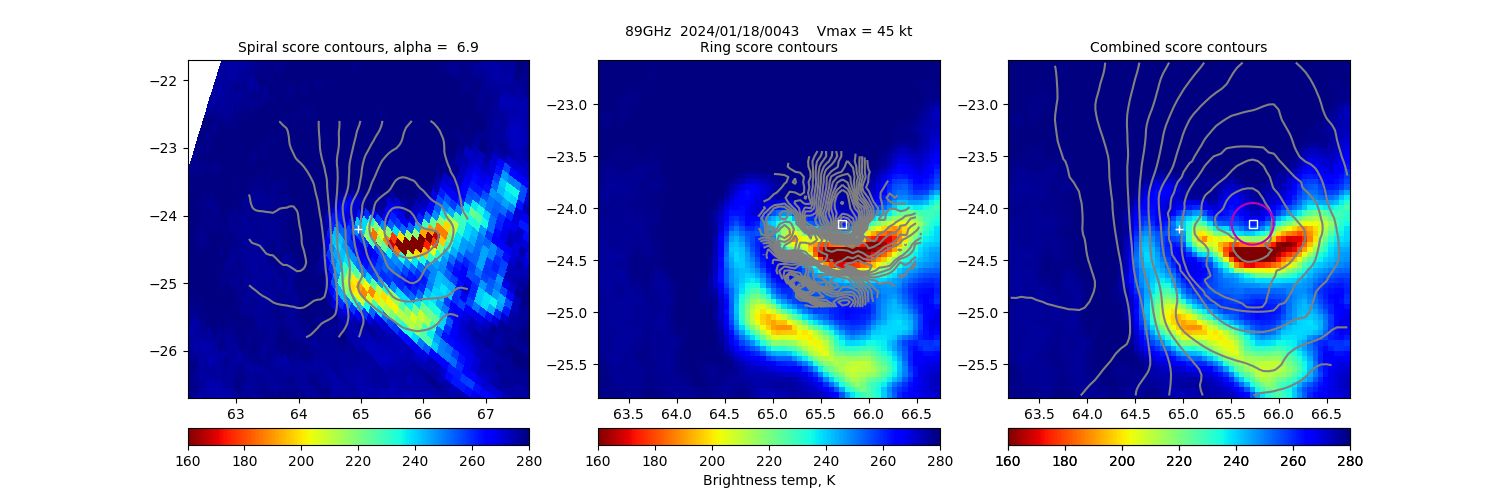
20240118 011947 SSMISF17 -24.3 65.5 46 44% 0.34 -0.34 N/A 45.0 -24.0 64.9 Analysis Plot
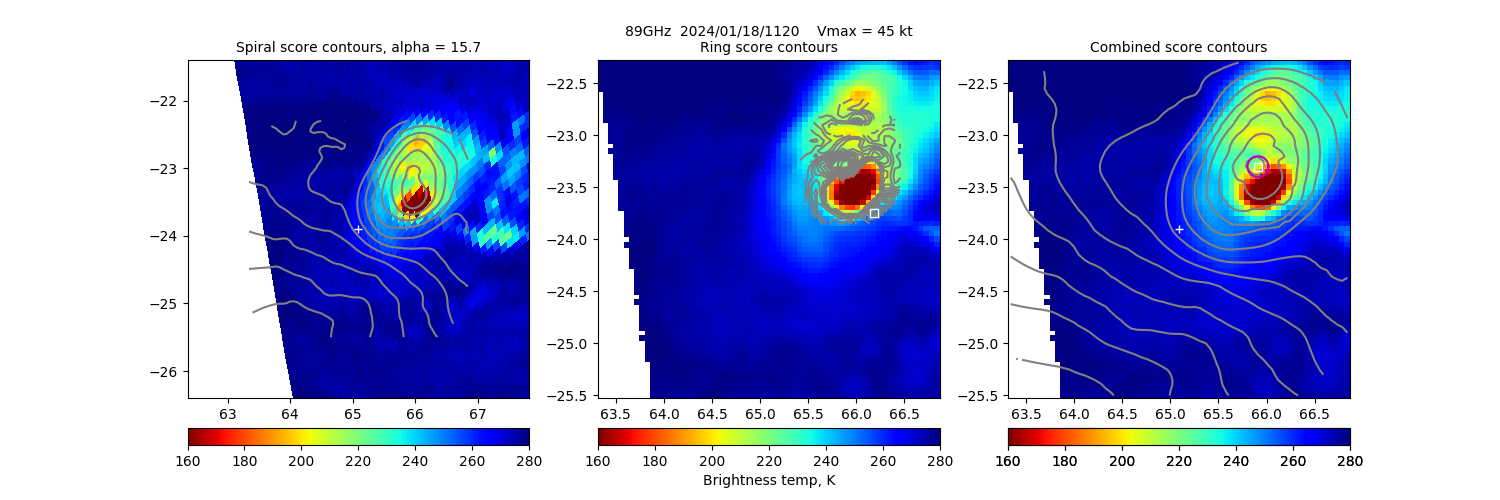
20240118 112017 SSMISF18 -23.3 65.9 12 79% 1.27 -1.27 N/A 45.0 -23.9 65.1 Analysis Plot
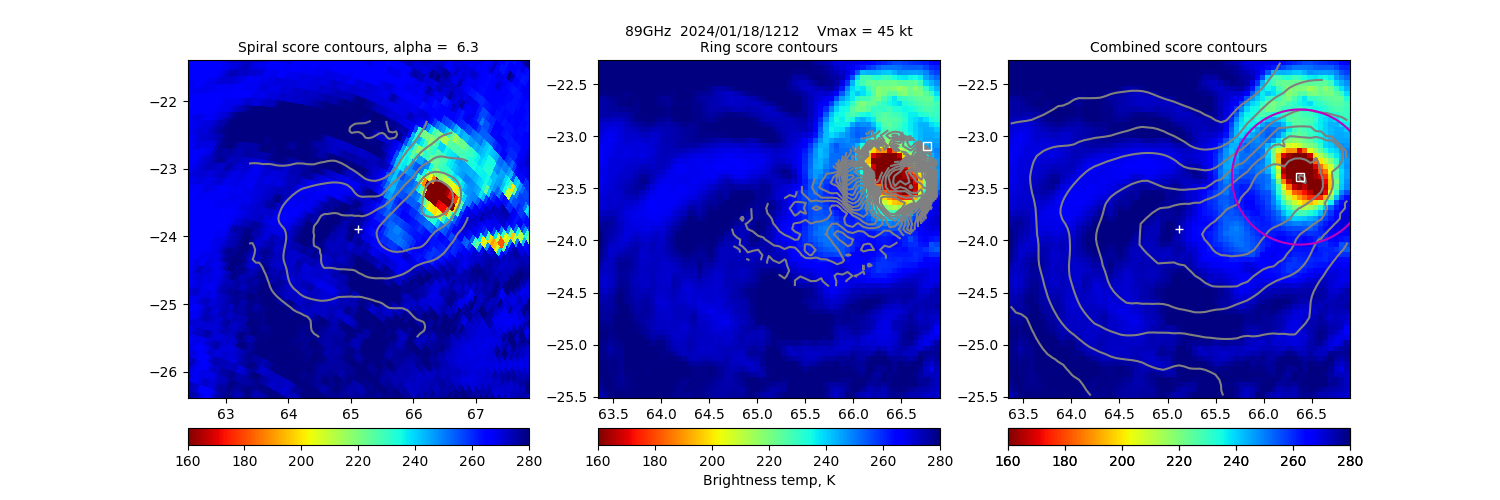
20240118 121245 GMI -23.4 66.4 N/A N/A N/A N/A N/A 45.0 -23.9 65.1 Analysis Plot
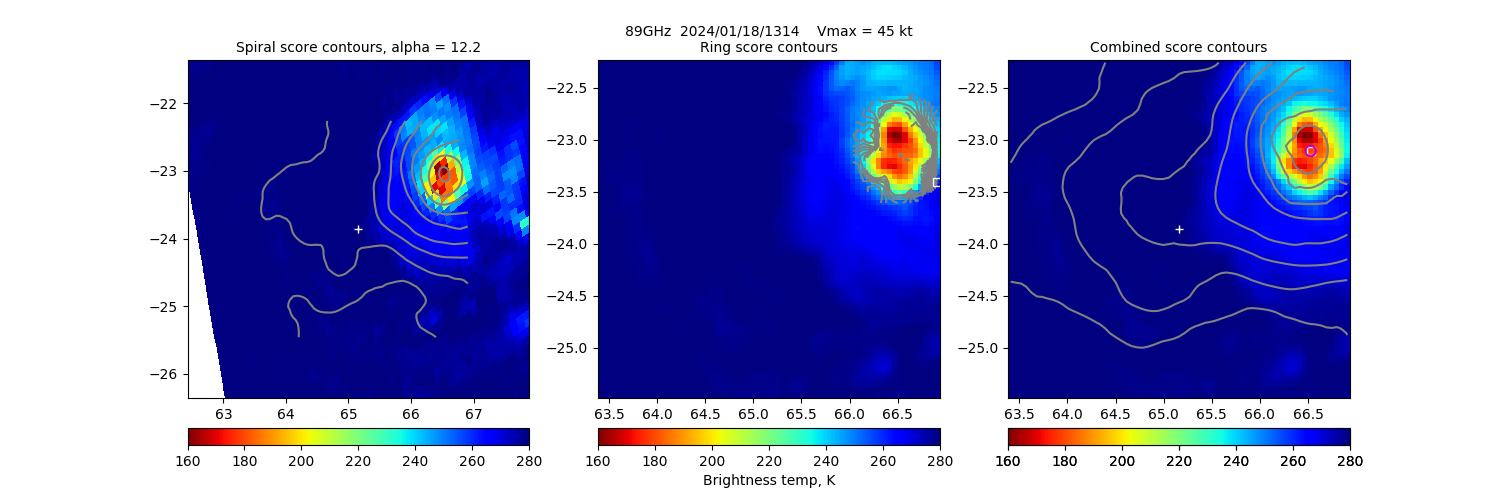
20240118 131417 SSMISF16 -23.1 66.5 N/A N/A N/A N/A N/A 45.0 -23.9 65.2 Analysis Plot
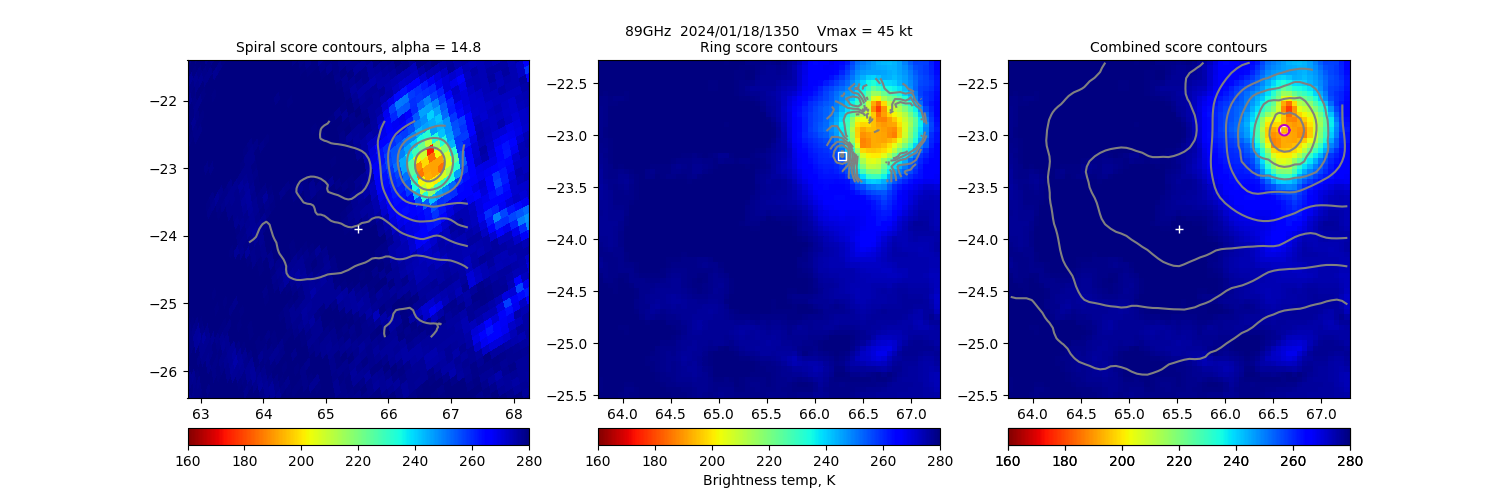
20240118 135007 SSMISF17 -23.0 66.6 N/A N/A N/A N/A N/A 45.0 -23.9 65.5 Analysis Plot
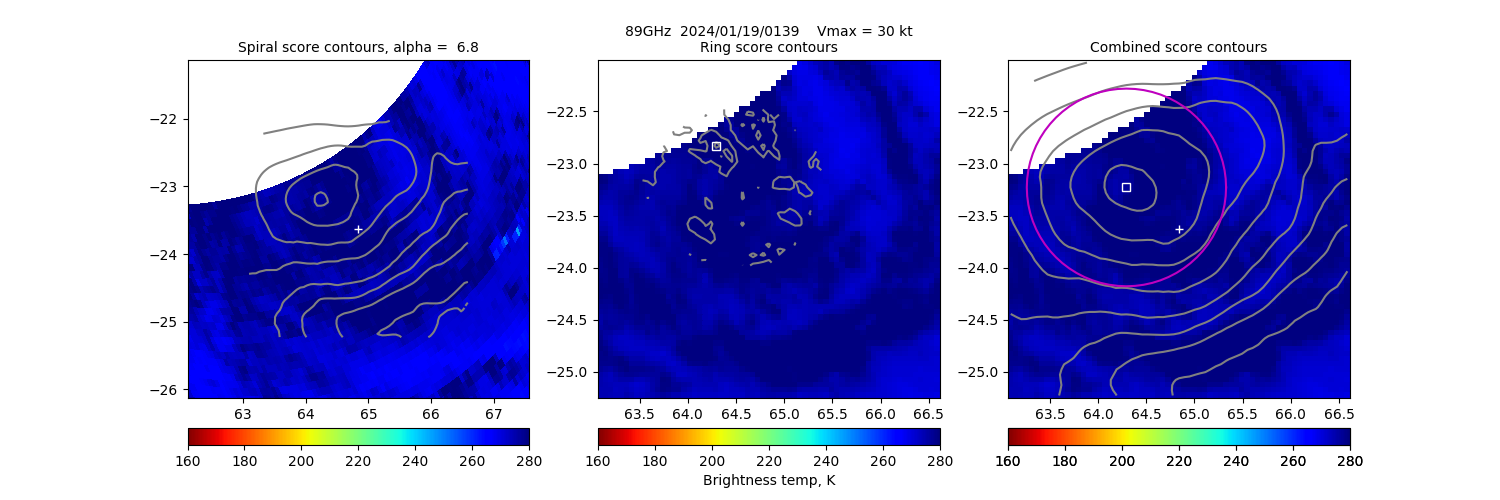
20240119 013911 GMI -23.2 64.3 N/A N/A N/A N/A N/A 30.0 -23.6 64.8 Analysis Plot
|
|
Legend - Overpass Date/Time are determined from satellite overpass of targeted TC (position determined from Best Track Lat/Lon position). Date is YYYYMMDD and time in HHMMSS (UTC). - Forecast (Best Track) and ARCHER positions (deg) of the TC center at overpass day/time. Positive/Negative: Latitude = North/South Hemisphere; Longitude = Eastern/Western Hemisphere. - BT Vmax is the concurrent ATCF Best Track (BT) wind speed intensity estimate (Vmax) value from either NOAA/National Hurricane Center (NHC) (North Atlantic and Northeast Pacific), NOAA/Central Pacific Hurricane Center (CPHC) (North-central Pacific) or Joint Typhoon Warning Center (JTWC) (Northwest Pacific, Indian Ocean, or Southwest Pacific). - Sat is the satellite descriptor providing the overpass. Currently the satellites used are the DMSP/SSMIS-16/17/18, GPM/GMI, and GCOM/AMSR2. - Ring Diam (km) indicates the estimated surface eyewall diameter if one is analyzed in the PMW imagery. The value listed is the average PMW-estimated inner eyewall edge diameter minus 10 km for eyewall slope. N/A indicates no appreciable eyewall is analyzed. - Ring Pct is the percentage of the analyzed "ring" (eyewall inner boundary) that is 1) colder than the eye Tb (the "hot spot" -- warmest eye pixel) by at least 20K, or 2) that is colder than 232K and colder than the eye Tb by 10K, whichever is greater. Values are red if Ring % ≤65,yellow/brown if Ring % ≤85 and green if Ring % >85. N/A indicates no appreciable eyewall is analyzed. A value over 85% is used in the intensity score by adding 15 points to it. - TbDiff is the difference between the warmest eye pixel and the warmest pixel on the eyewall. This value is used in the Intensity Score. N/A indicates no appreciable eyewall is analyzed. - Eye Score values are based on the strength and organization of the convective/eyewall signatures in the PMW imagery, and based on the ARCHER center location. They normally range from 0 to 100 with empirically-determined thresholds related to intensity (Vmax) in the "Meaning" column (≥20 suggests ≥65kts; ≥60 suggests ≥85kts). Scores are listed as negative, and not used by the ADT, when the NHC, CPHC, or JTWC Best Track Vmax is <55 kts in order to filter out occasional "false eye" cases. A value of -920 is used when the warmest eye pixel is <200K to prevent false positives; -930 means edge of overpass and <85% of eyewall is captured and therefore can't fully be analyzed. |