Tropical Storm 06S
|
Passive Microwave (PMW) Intensity Information Advanced Dvorak Technique Version 9.1 |
--Overpass-- --ARCHER-- Ring Ring Eye BT -Forecast-
Date Time Sat Lat Lon Diam Pct TbDiff Score Meaning Vmax Lat Lon
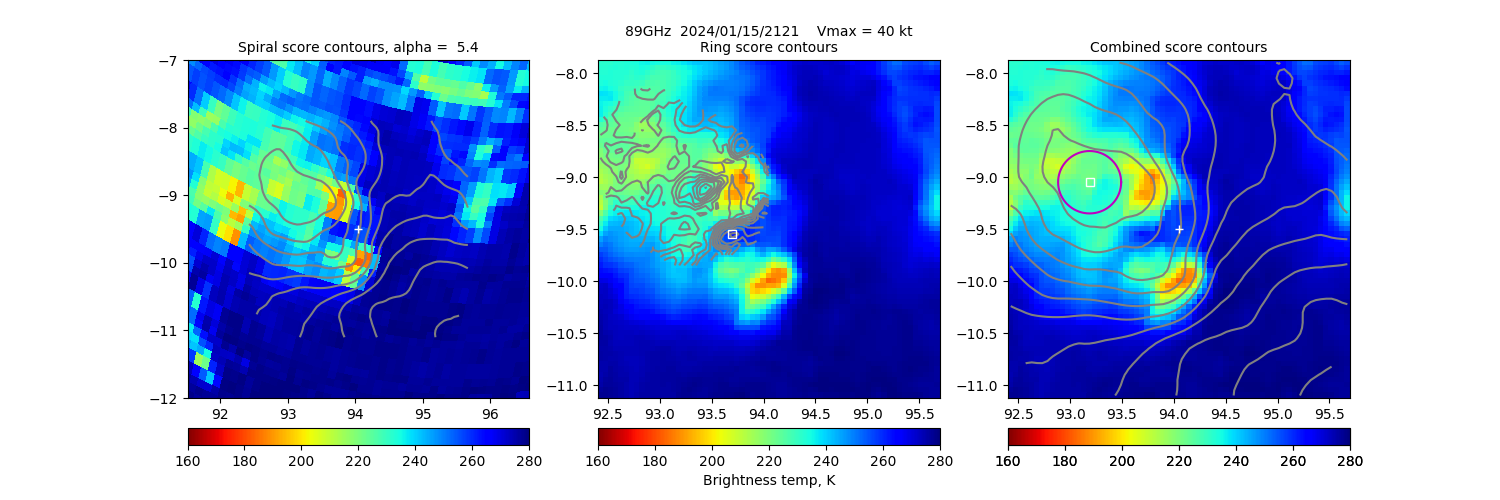
20240115 212139 SSMISF18 -9.1 93.2 57 53% 1.03 -1.03 N/A 40.0 -9.5 94.1 Analysis Plot
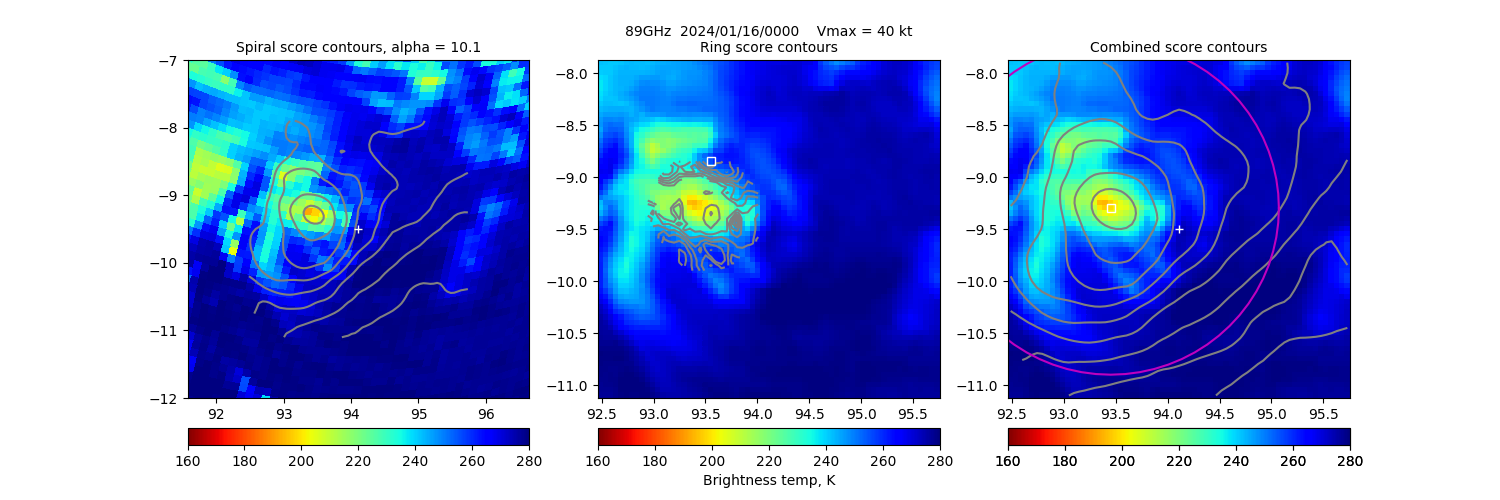
20240116 000035 SSMISF17 -9.3 93.4 N/A N/A N/A N/A N/A 40.0 -9.5 94.1 Analysis Plot
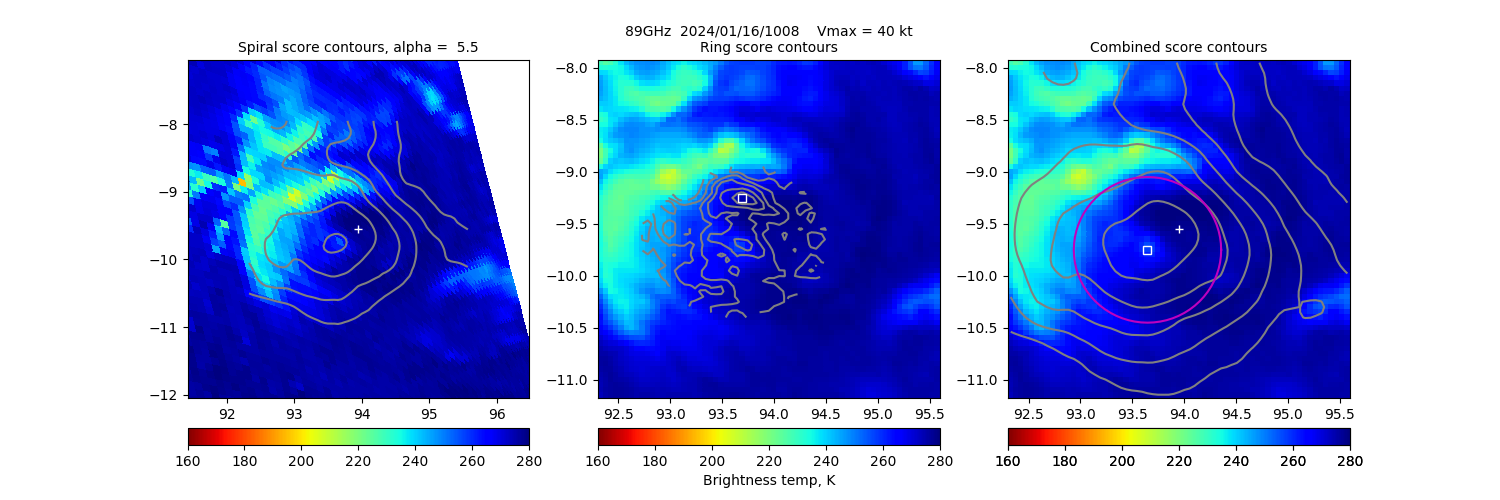
20240116 100830 SSMISF18 -9.8 93.7 146 14% 2.57 -2.57 N/A 40.0 -9.6 93.9 Analysis Plot
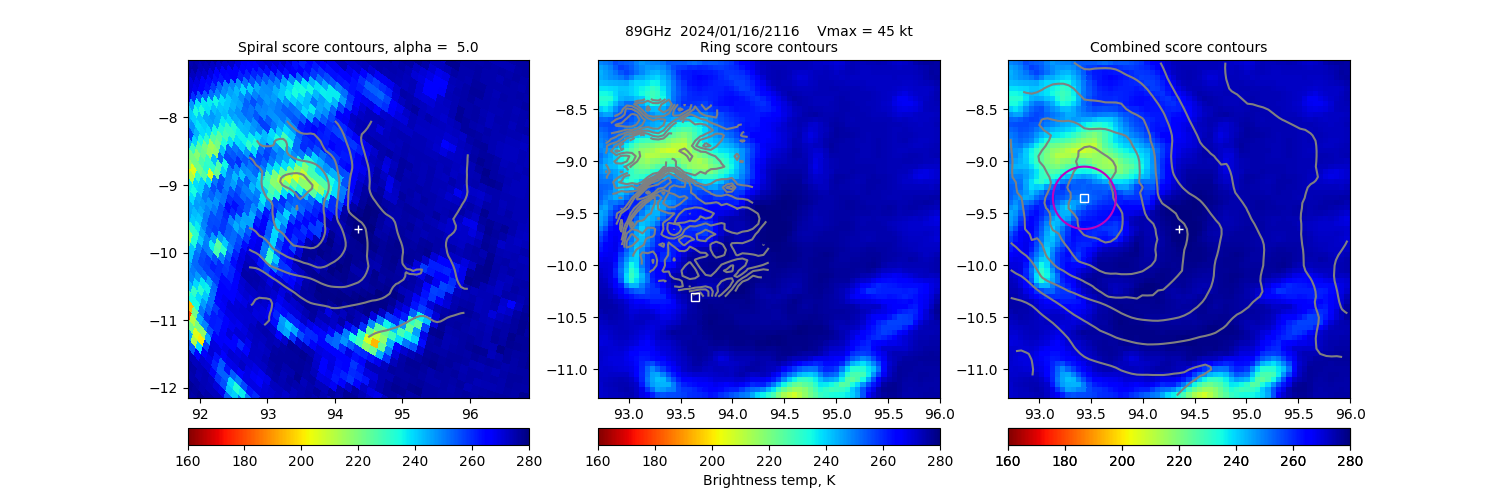
20240116 211620 SSMISF18 -9.4 93.4 N/A N/A N/A N/A N/A 45.0 -9.6 94.3 Analysis Plot
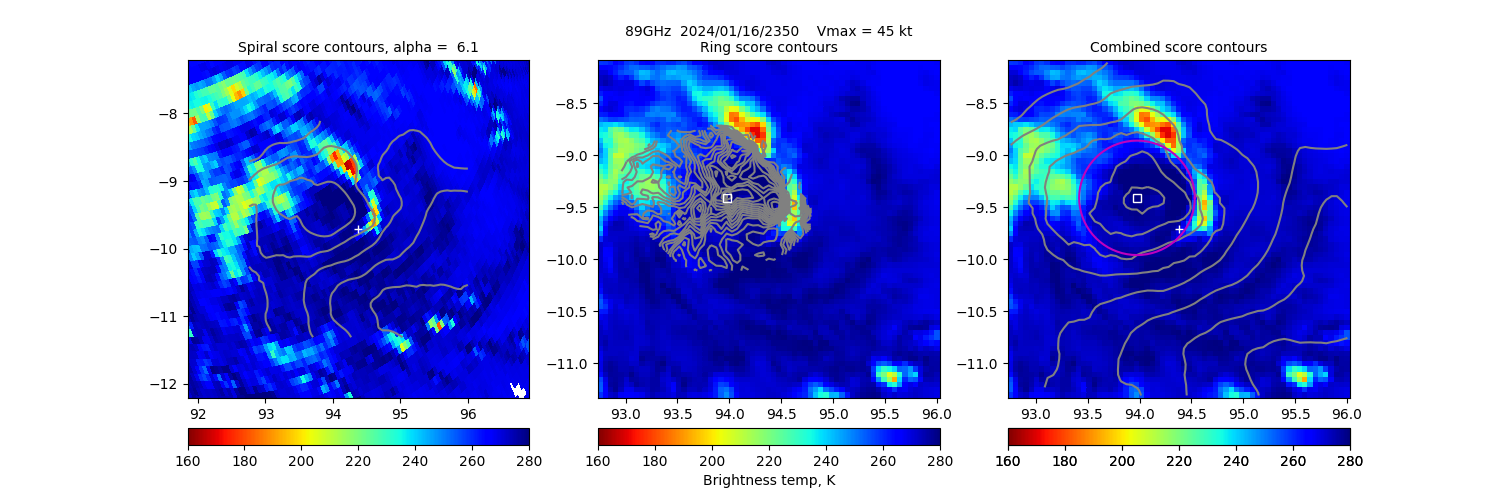
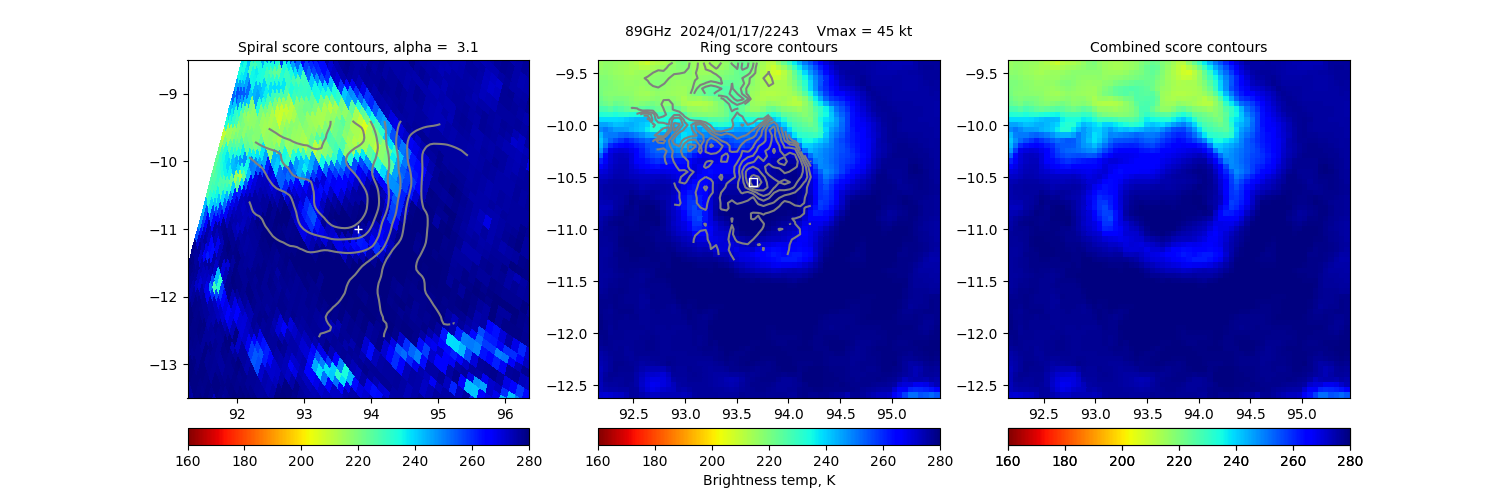
20240116 235040 GMI -9.4 94.0 112 1% 3.10 -3.10 N/A 45.0 -9.7 94.4 Analysis Plot
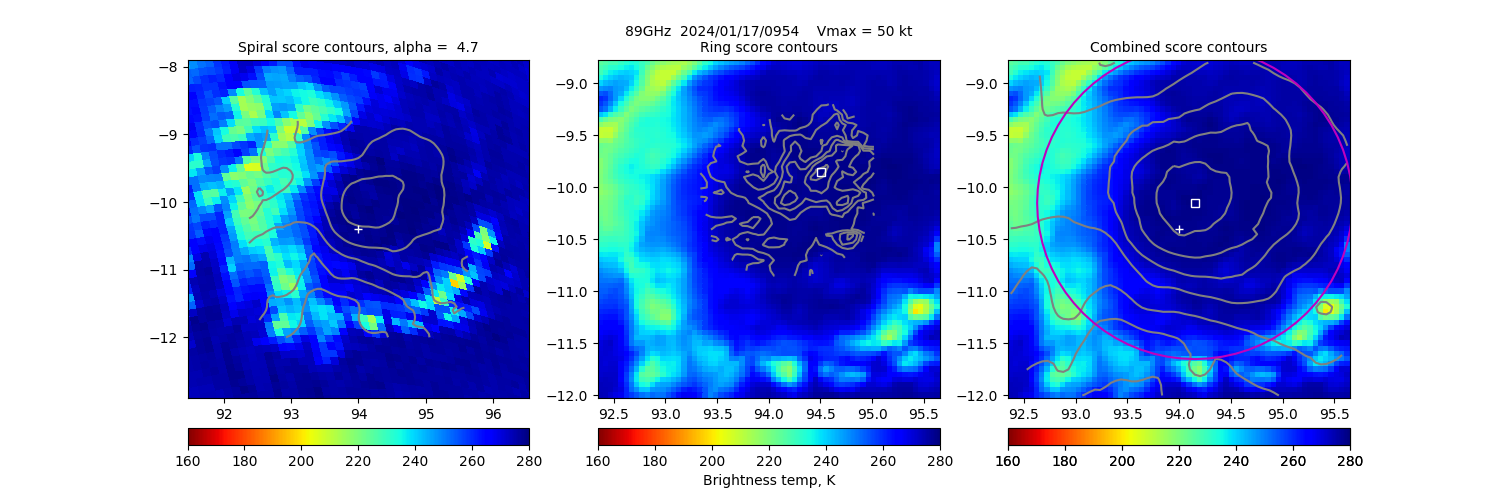
20240117 095425 SSMISF18 -10.1 94.2 N/A N/A N/A N/A N/A 50.0 -10.4 94.0 Analysis Plot
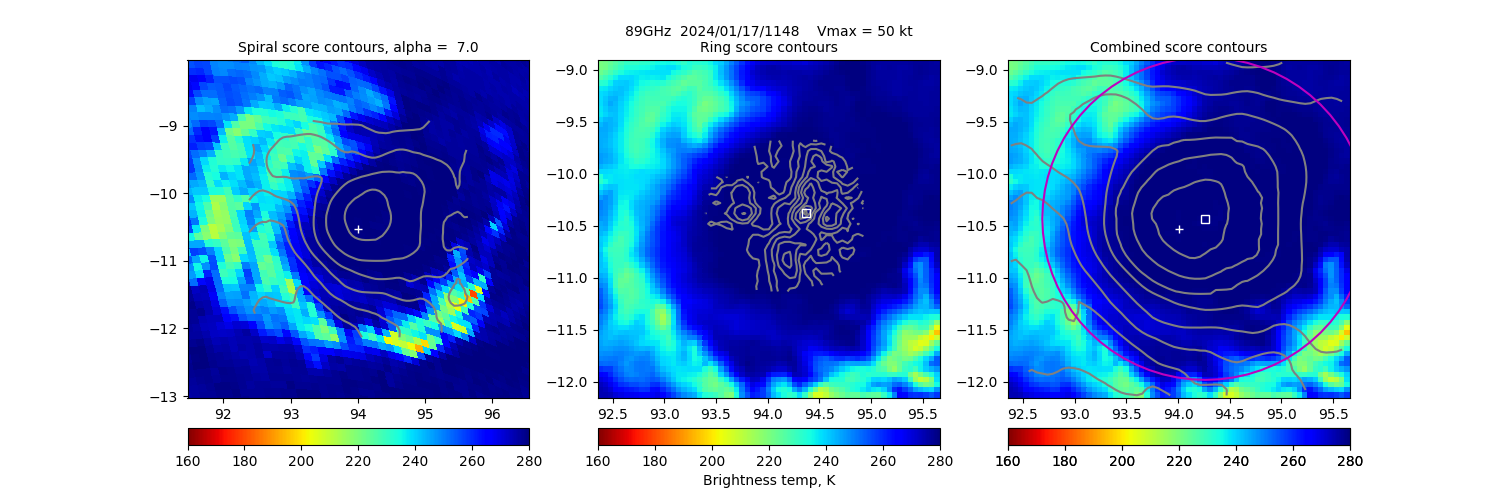
20240117 114841 SSMISF16 -10.4 94.3 N/A N/A N/A N/A N/A 50.0 -10.5 94.0 Analysis Plot
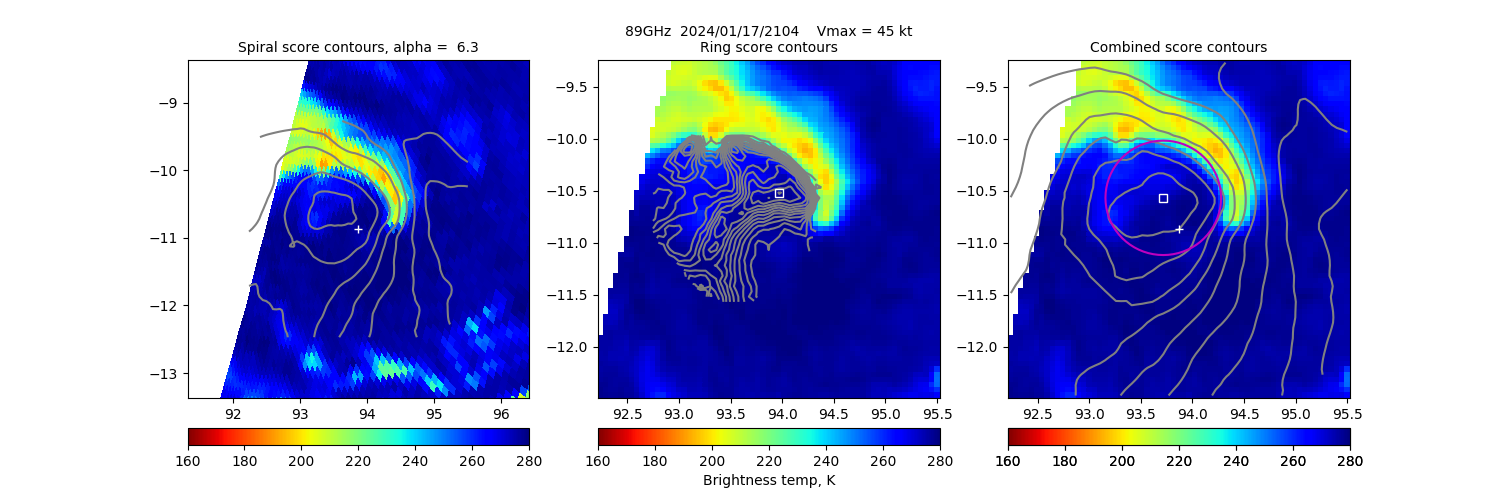
20240117 210413 SSMISF18 -10.6 93.7 112 19% 1.01 -1.01 N/A 45.0 -10.9 93.9 Analysis Plot
20240117 224344 SSMISF16 -10.6 93.7 123 N/A 10.06 -10.06 N/A 45.0 -11.0 93.8 Analysis Plot
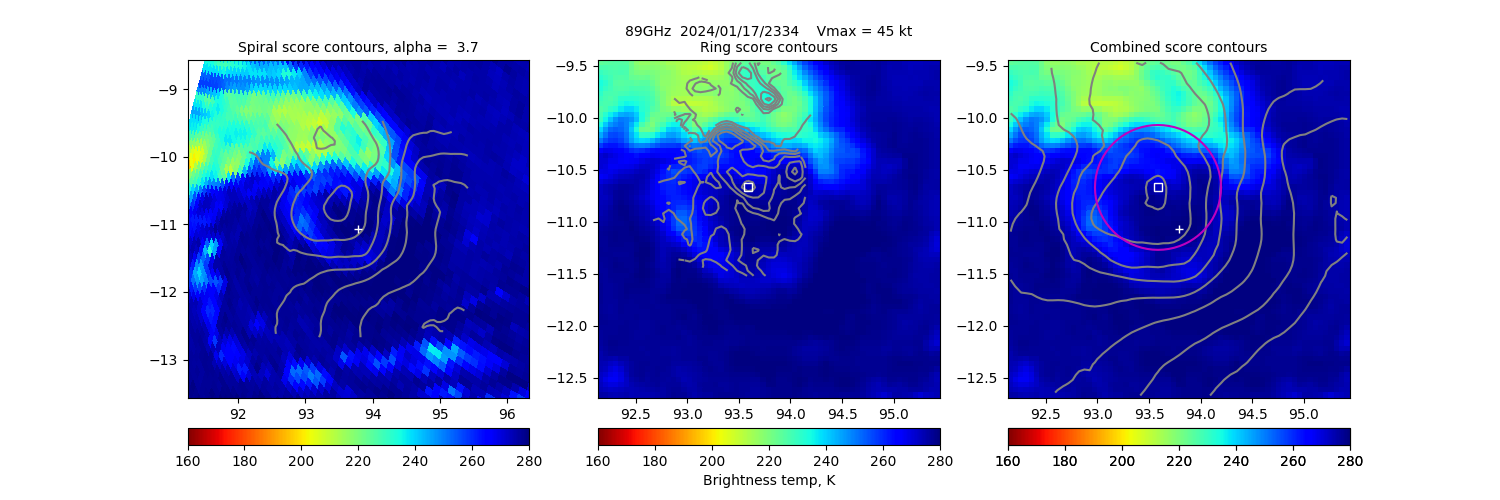
20240117 233413 SSMISF17 -10.7 93.6 123 26% 3.27 -3.27 N/A 45.0 -11.1 93.8 Analysis Plot
20240118 094034 SSMISF18 -10.6 93.3 N/A N/A N/A N/A N/A 45.0 -11.8 93.7 Analysis Plot
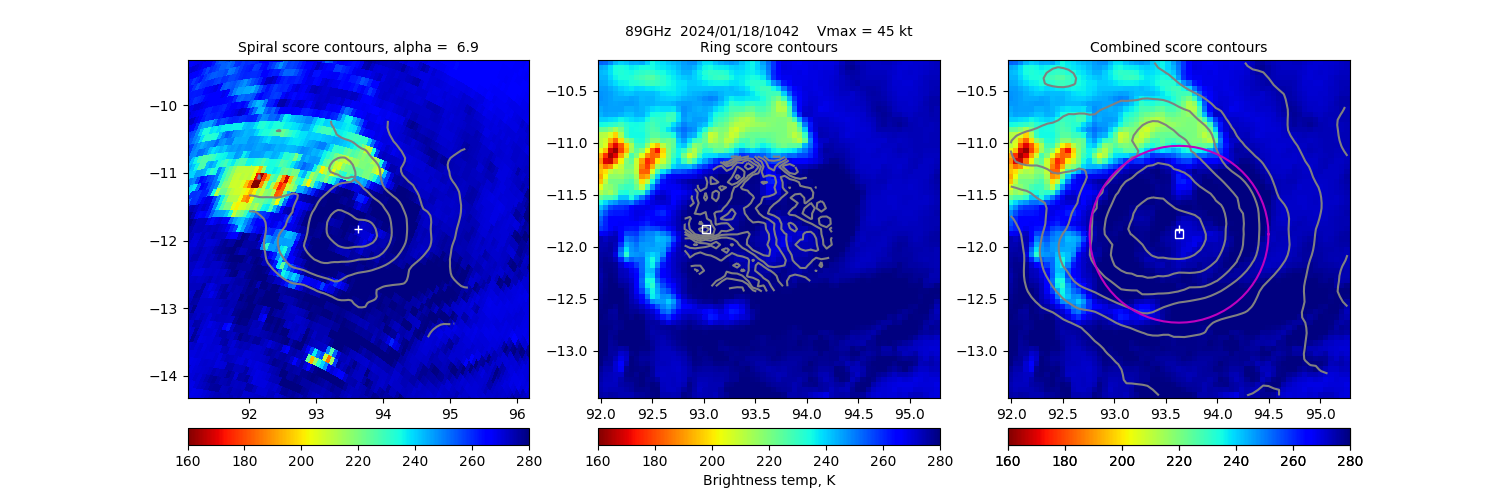
20240118 104254 GMI -11.9 93.6 N/A N/A N/A N/A N/A 45.0 -11.8 93.6 Analysis Plot
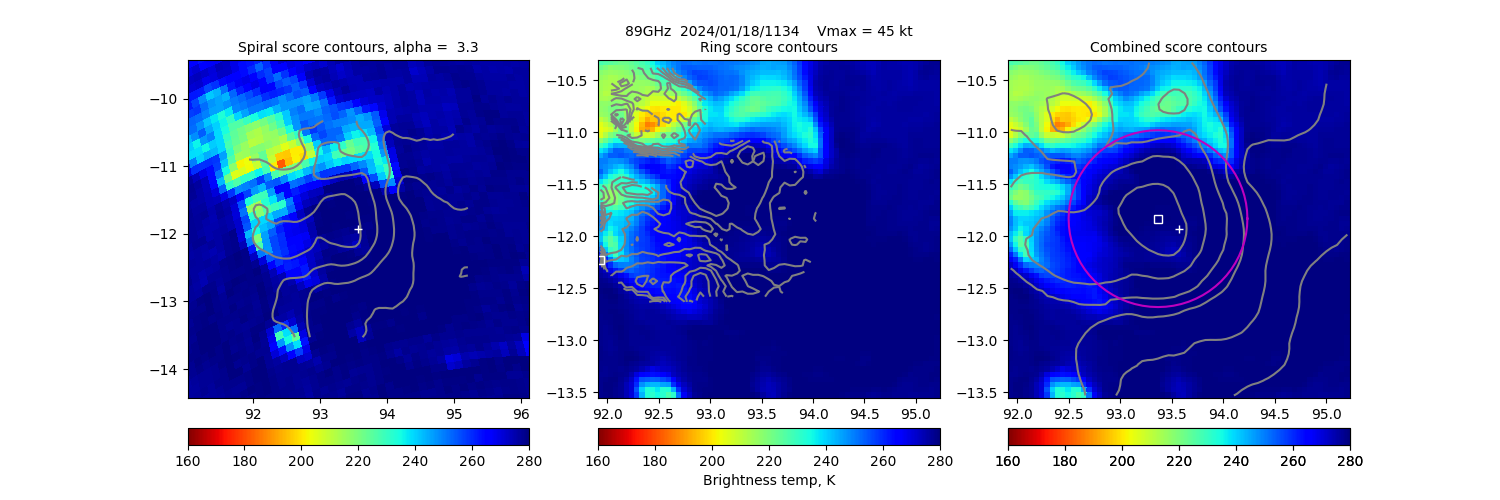
20240118 113444 SSMISF16 -11.8 93.4 179 12% 0.45 -0.45 N/A 45.0 -11.9 93.6 Analysis Plot
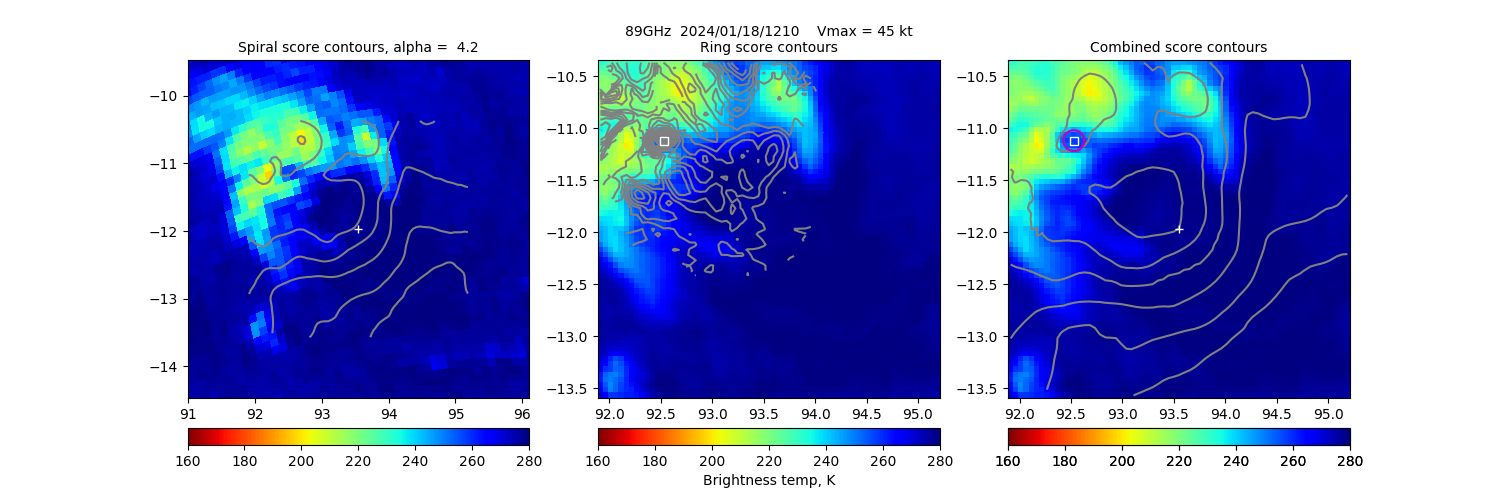
20240118 121059 SSMISF17 -11.1 92.5 12 61% 5.88 -5.88 N/A 45.0 -12.0 93.6 Analysis Plot
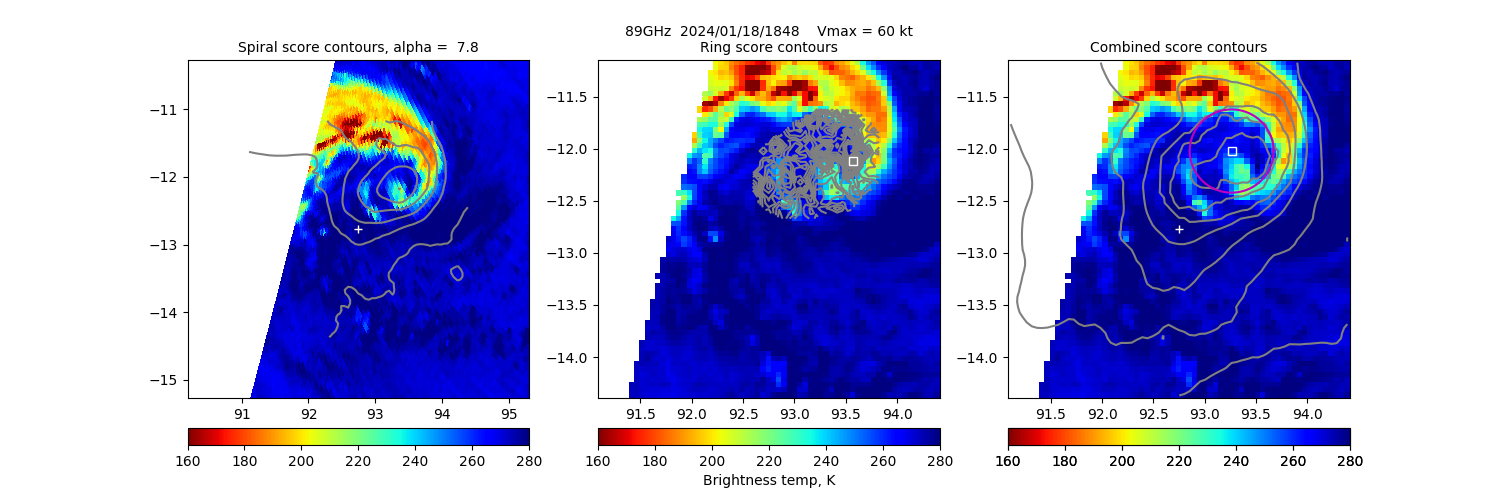
20240118 184849 AMSR2 -12.0 93.3 79 46% 4.51 4.51 N/A 60.0 -12.8 92.8 Analysis Plot
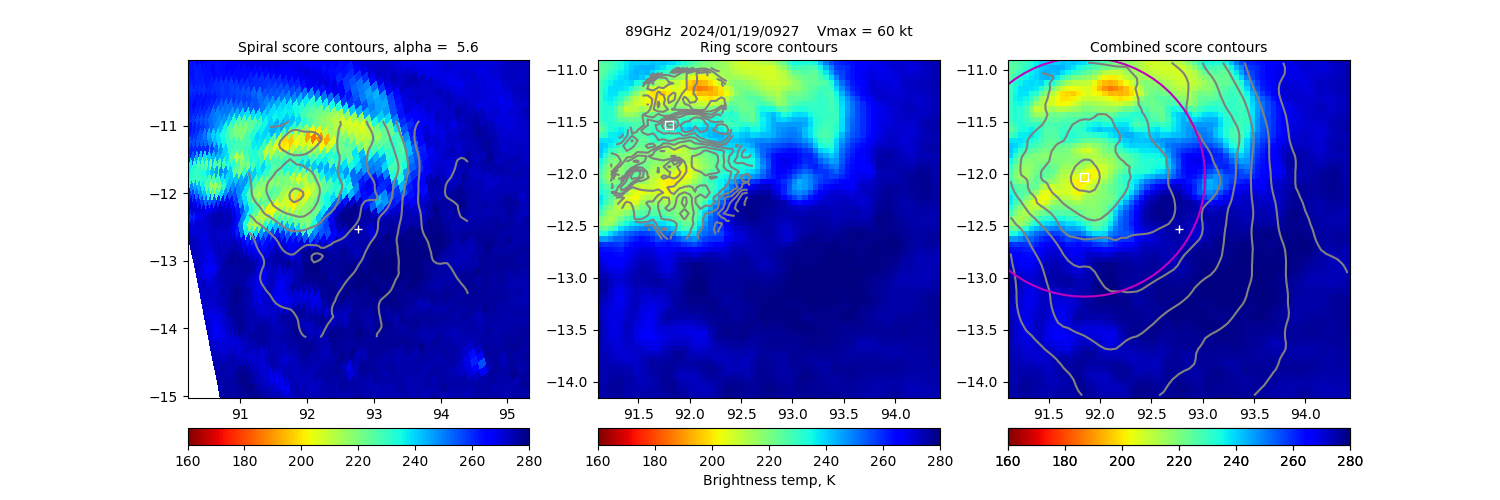
20240119 092751 SSMISF18 -12.0 91.8 N/A N/A N/A N/A N/A 60.0 -12.5 92.8 Analysis Plot
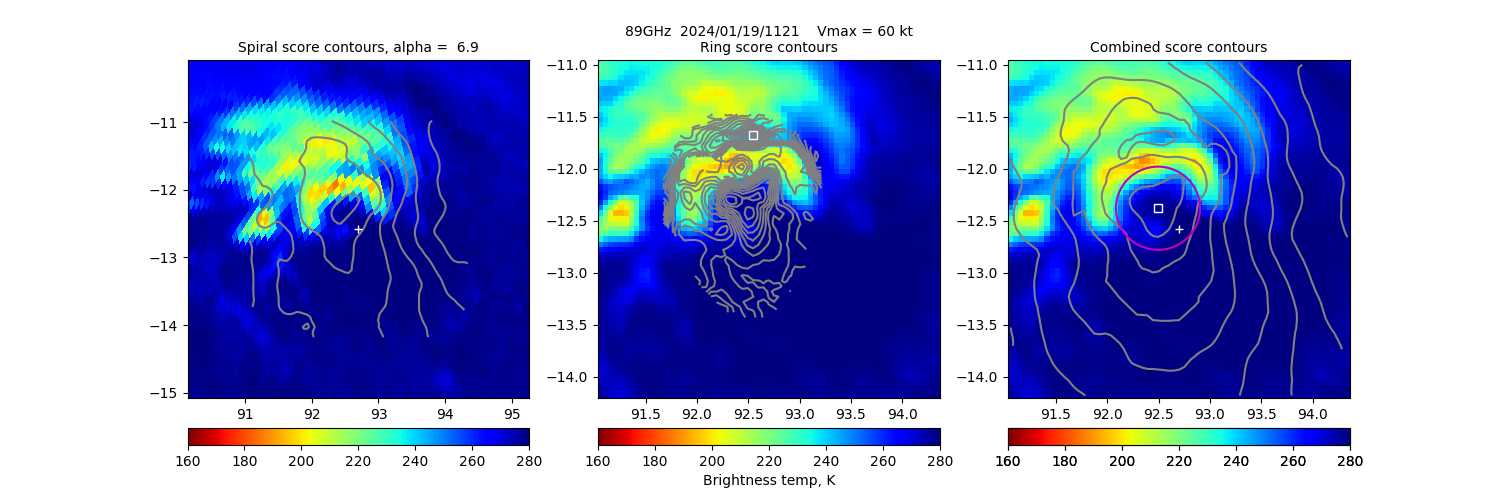
20240119 112157 SSMISF16 -12.4 92.5 N/A N/A N/A N/A N/A 60.0 -12.6 92.7 Analysis Plot
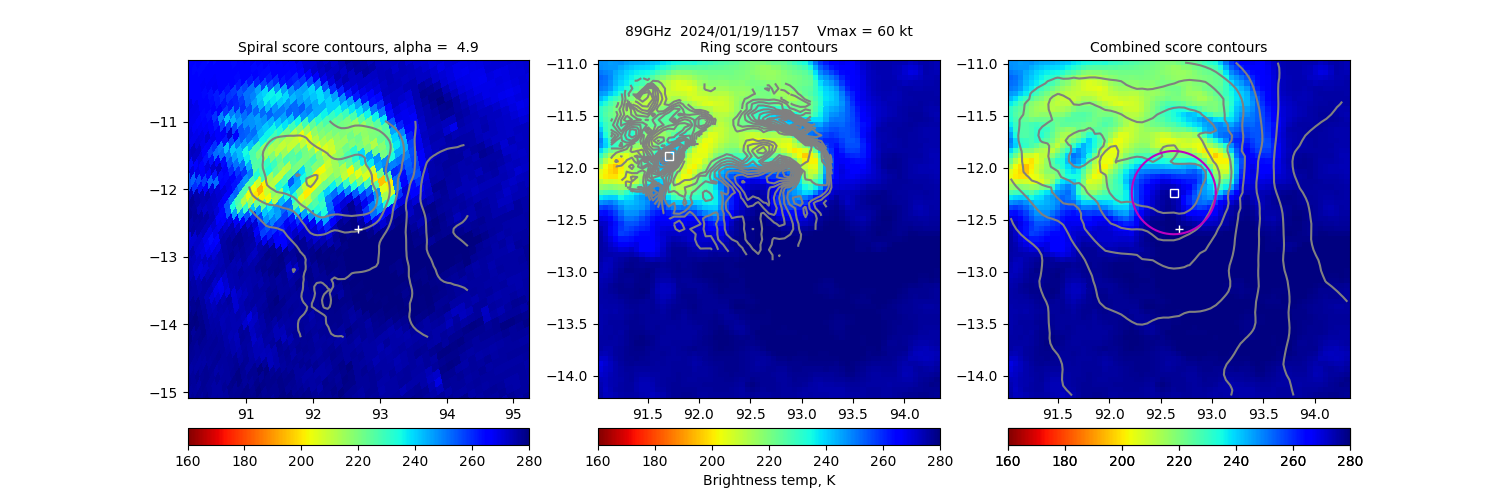
20240119 115732 SSMISF17 -12.2 92.6 N/A N/A N/A N/A N/A 60.0 -12.6 92.7 Analysis Plot
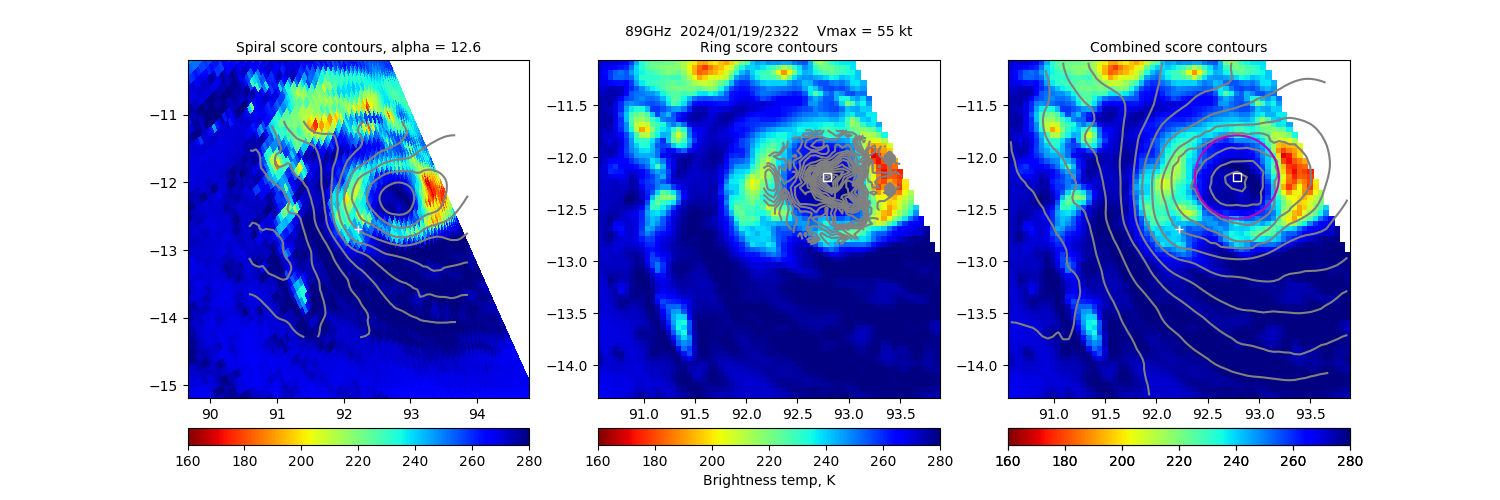
20240119 232218 GMI -12.2 92.8 79 100% 27.52 42.52 >65 kts 55.0 -12.7 92.2 Analysis Plot
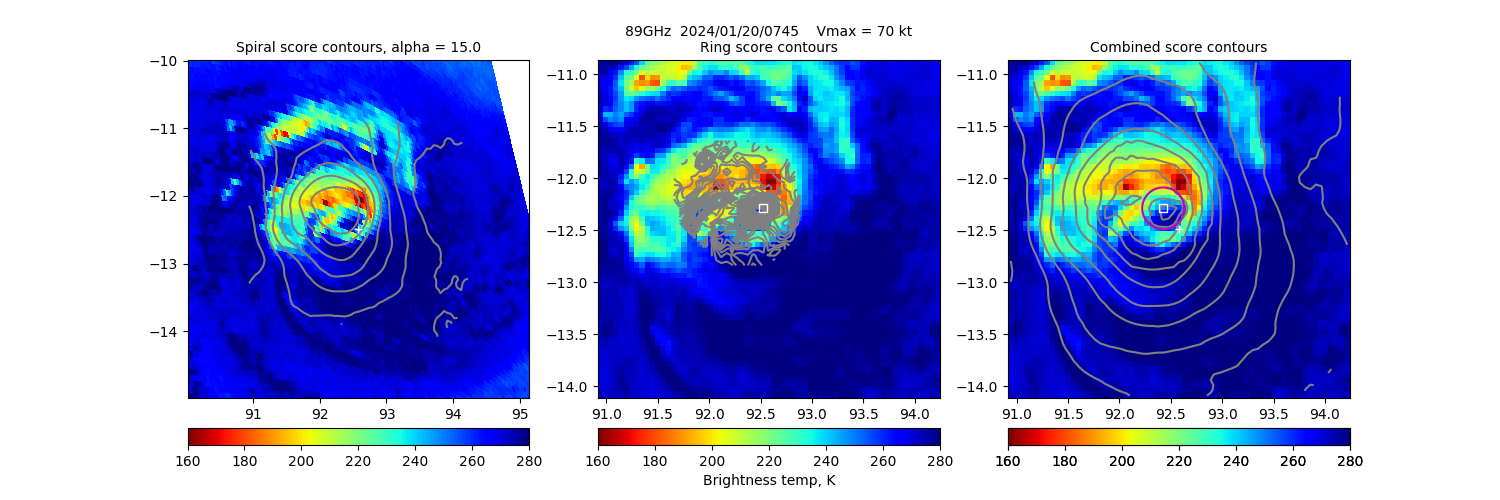
20240120 074549 AMSR2 -12.3 92.4 34 100% 31.54 46.54 >65 kts 70.0 -12.5 92.6 Analysis Plot
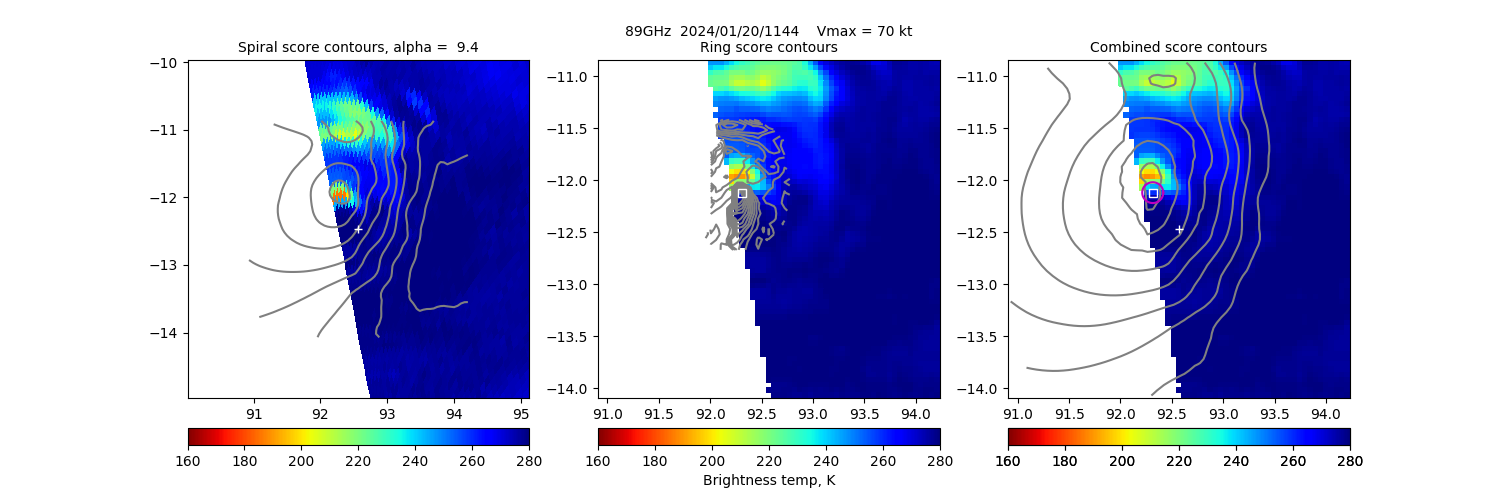
20240120 114454 SSMISF17 -12.1 92.3 N/A N/A N/A N/A N/A 70.0 -12.5 92.6 Analysis Plot
20240120 224021 GMI -12.0 92.3 N/A N/A N/A N/A N/A 70.0 -12.0 92.4 Analysis Plot
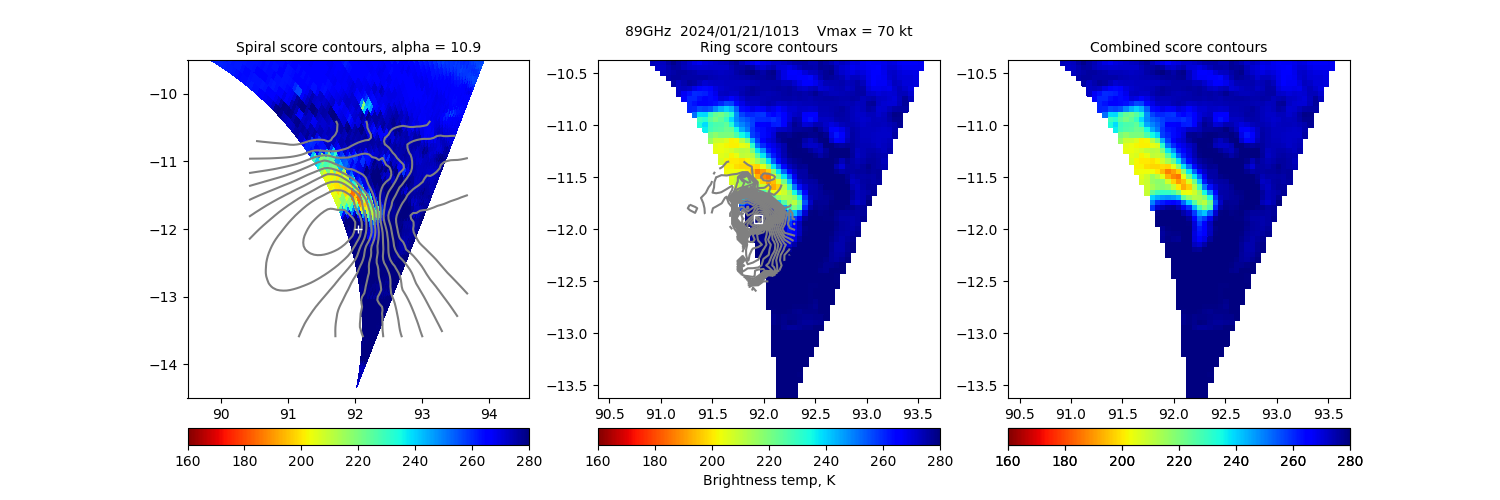
20240121 101355 GMI -11.9 91.9 N/A N/A N/A N/A N/A 70.0 -12.0 92.1 Analysis Plot
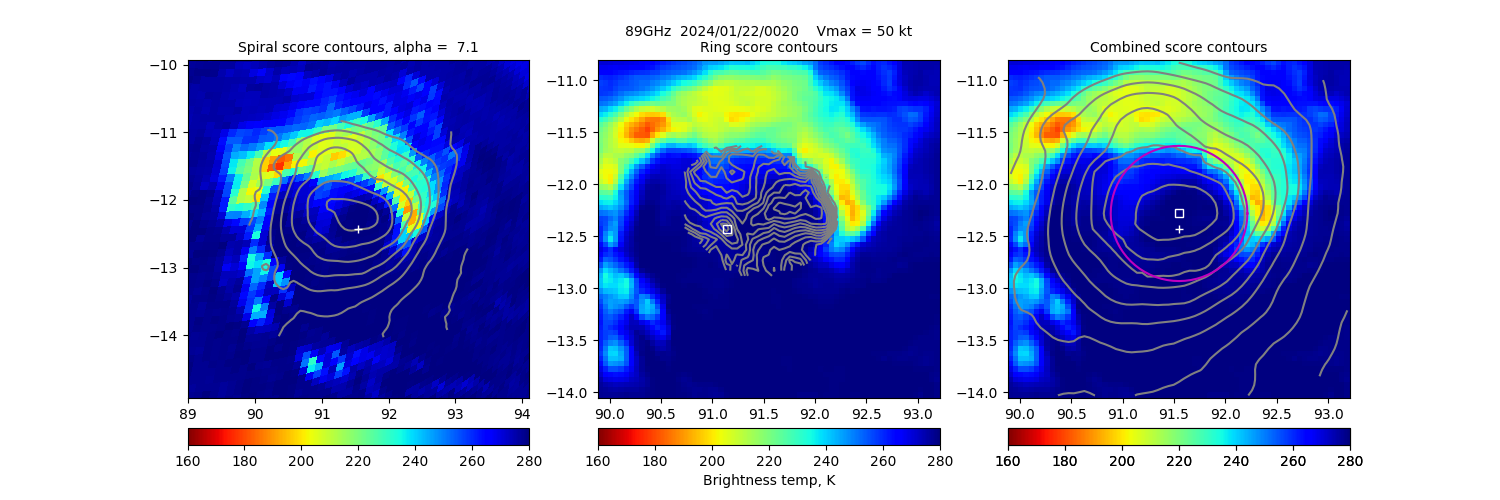
20240122 002021 SSMISF17 -12.3 91.6 135 36% 1.42 -1.42 N/A 50.0 -12.4 91.6 Analysis Plot
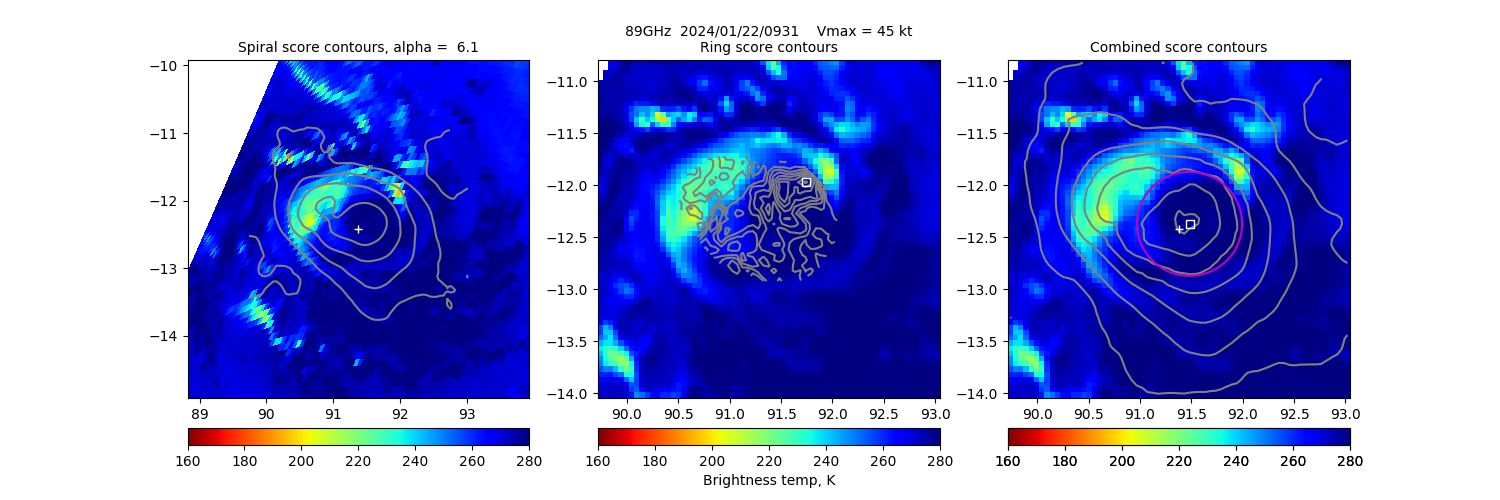
20240122 093145 GMI -12.4 91.5 101 10% 1.99 -1.99 N/A 45.0 -12.4 91.4 Analysis Plot
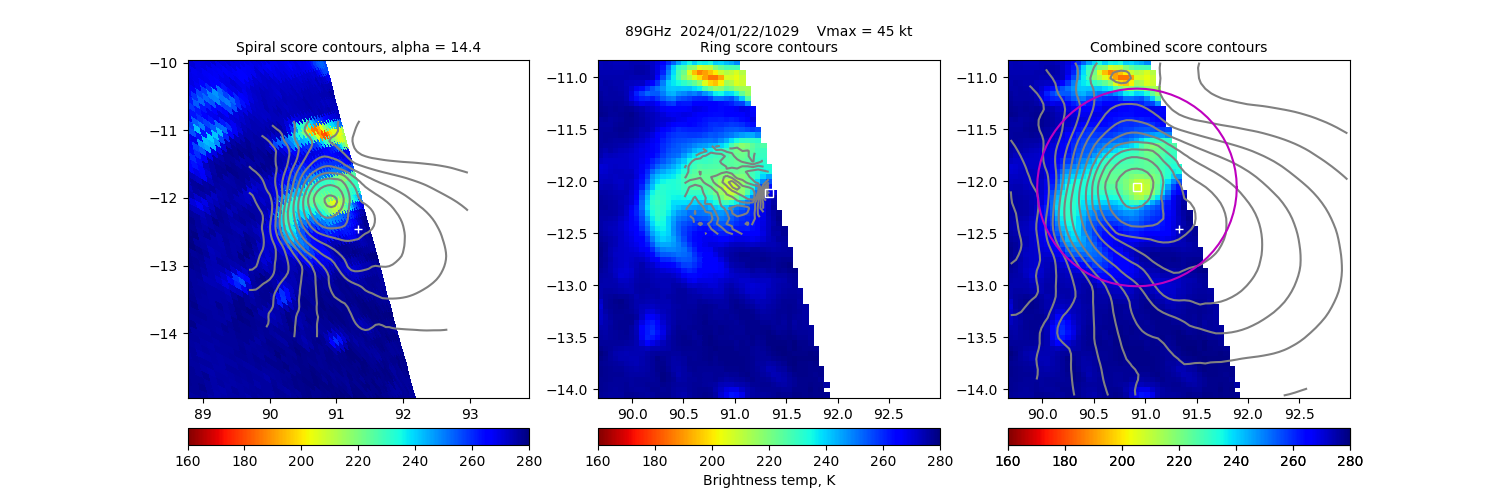
20240122 102951 SSMISF18 -12.1 90.9 N/A N/A N/A N/A N/A 45.0 -12.5 91.3 Analysis Plot
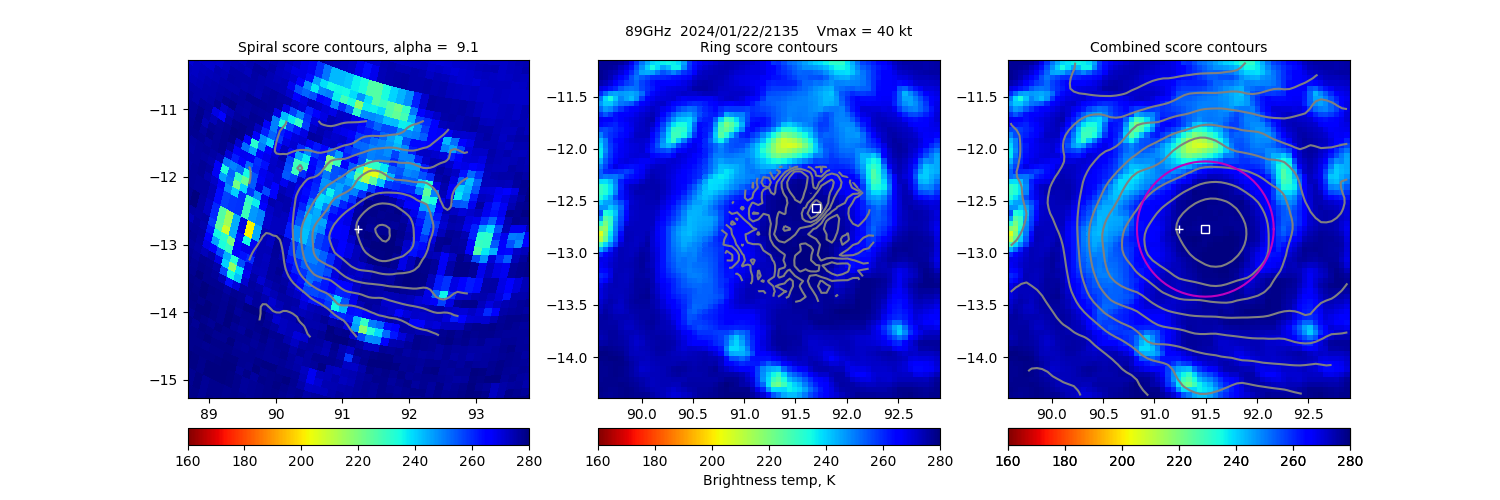
20240122 213502 SSMISF18 -12.8 91.5 135 6% 3.43 -3.43 N/A 40.0 -12.8 91.2 Analysis Plot
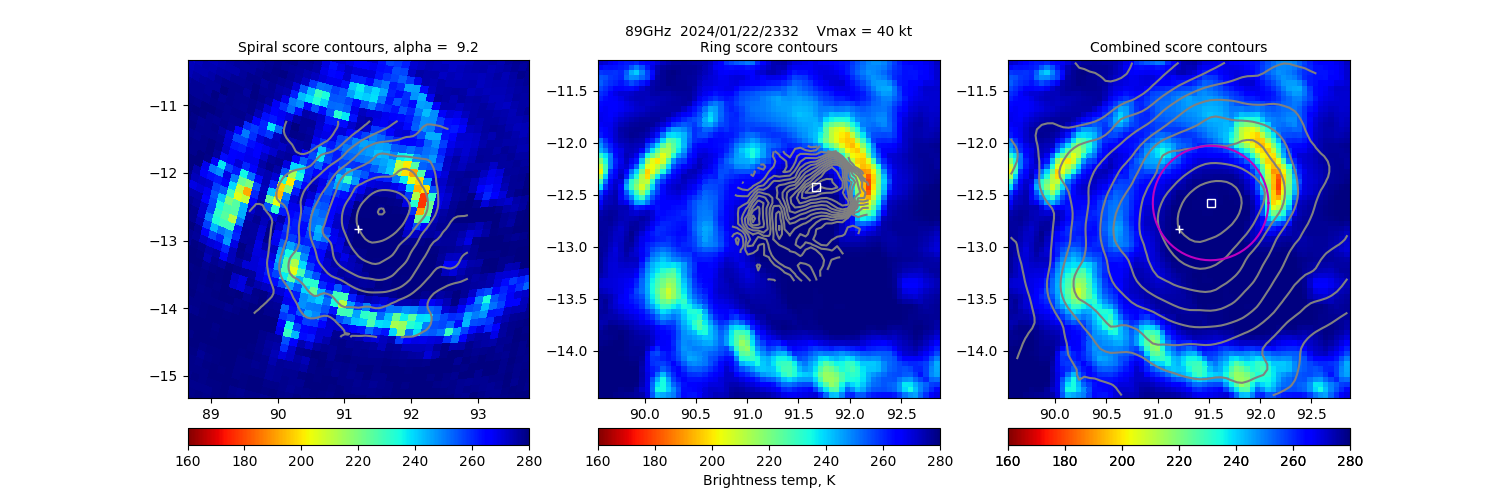
20240122 233228 SSMISF16 -12.6 91.5 112 22% 0.92 -0.92 N/A 40.0 -12.8 91.2 Analysis Plot
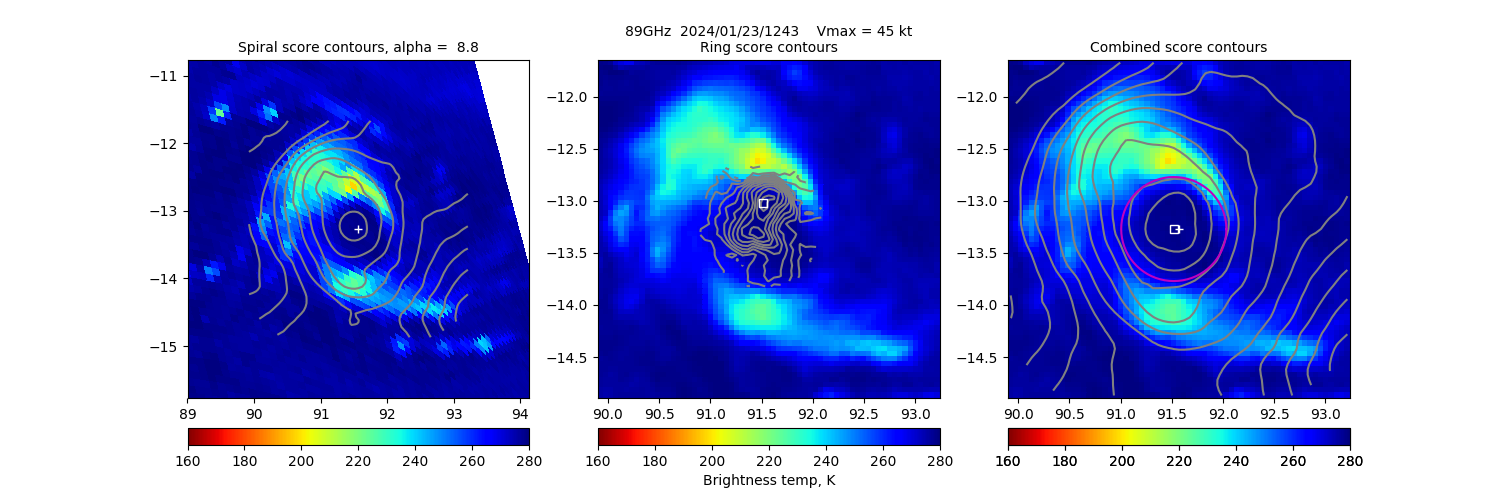
20240123 124336 SSMISF17 -13.3 91.5 101 18% 6.59 -6.59 N/A 45.0 -13.3 91.6 Analysis Plot
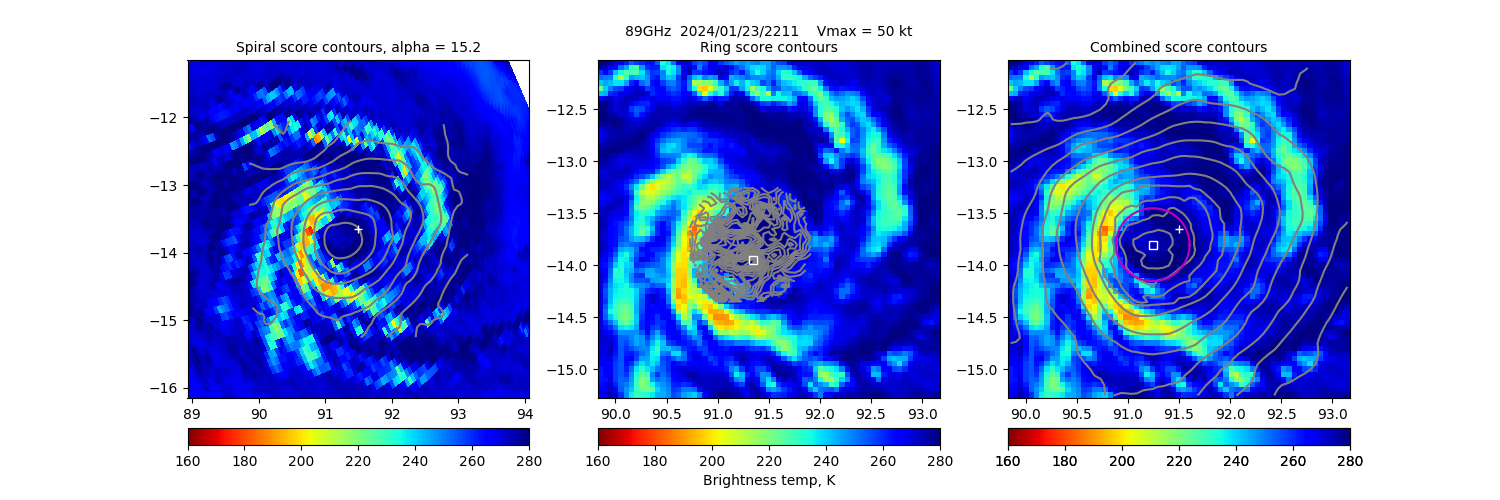
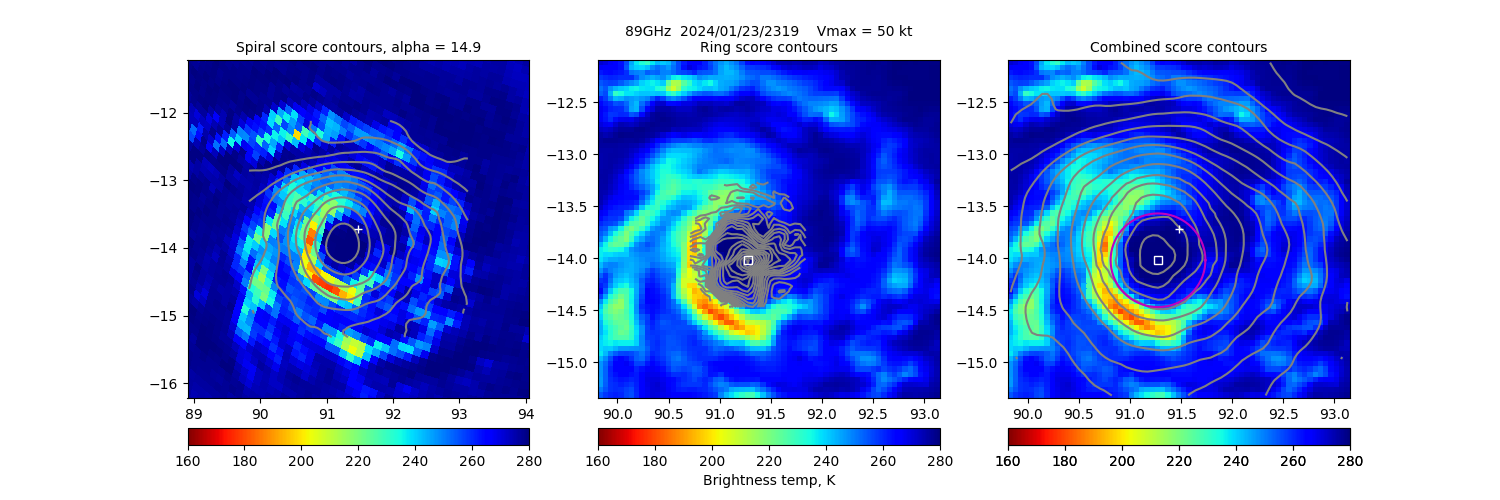
20240123 221104 GMI -13.8 91.2 68 28% 7.21 -7.21 N/A 50.0 -13.6 91.5 Analysis Plot
20240123 231934 SSMISF16 -14.0 91.3 90 22% 7.47 -7.47 N/A 50.0 -13.7 91.5 Analysis Plot
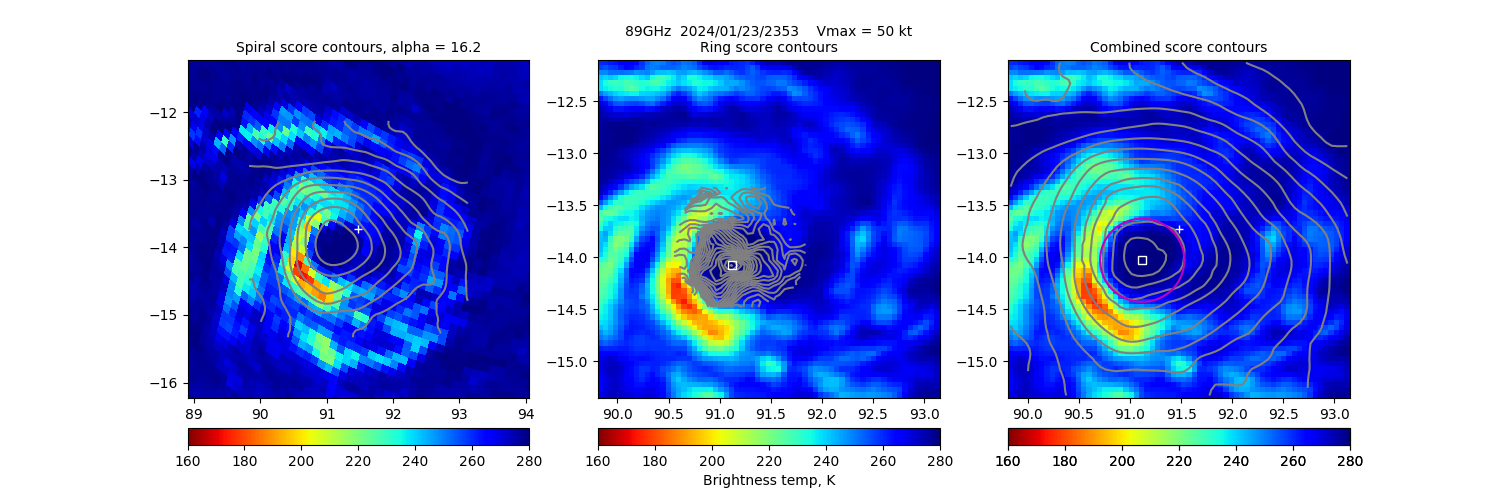
20240123 235312 SSMISF17 -14.0 91.1 79 38% 8.04 -8.04 N/A 50.0 -13.7 91.5 Analysis Plot
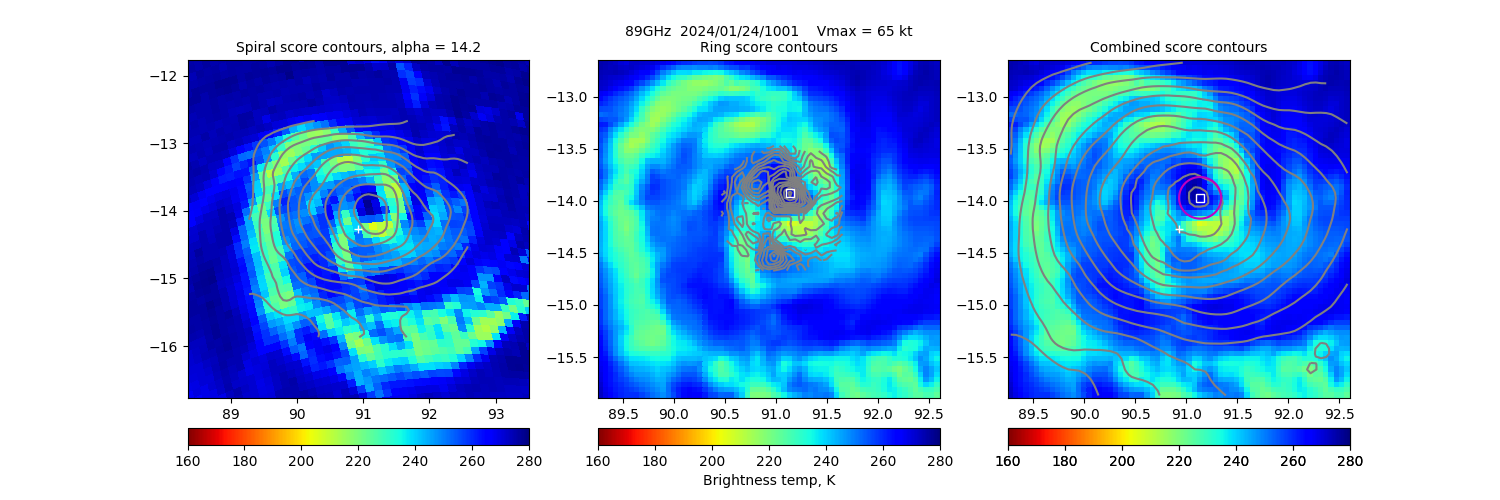
20240124 100106 SSMISF18 -14.0 91.1 34 100% 21.46 36.46 >65 kts 65.0 -14.3 90.9 Analysis Plot
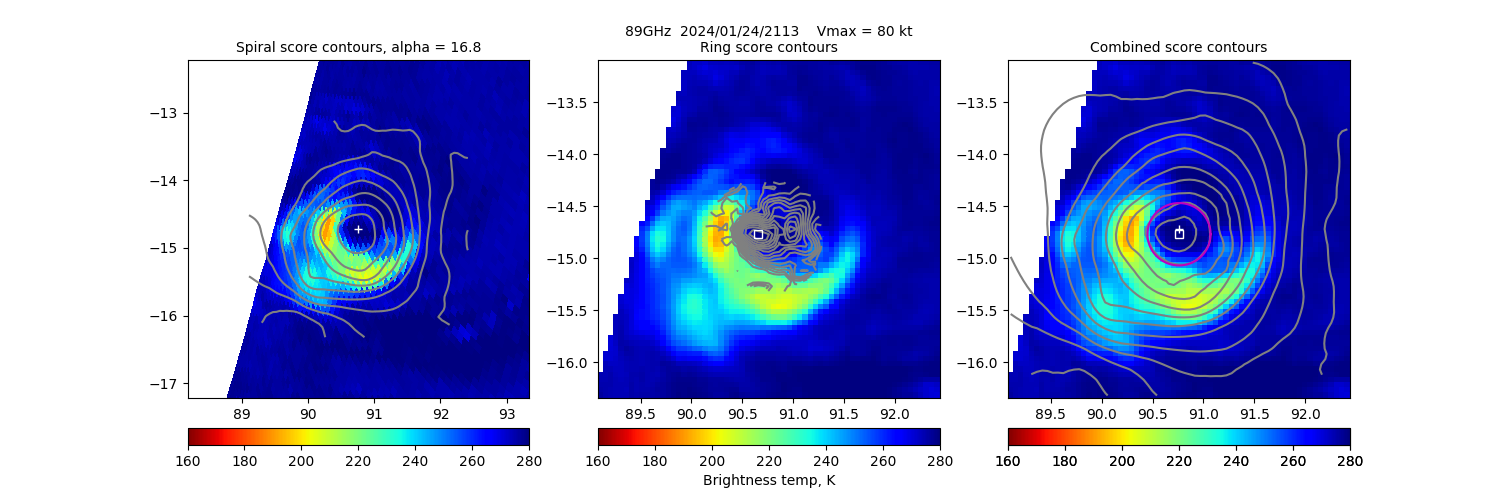
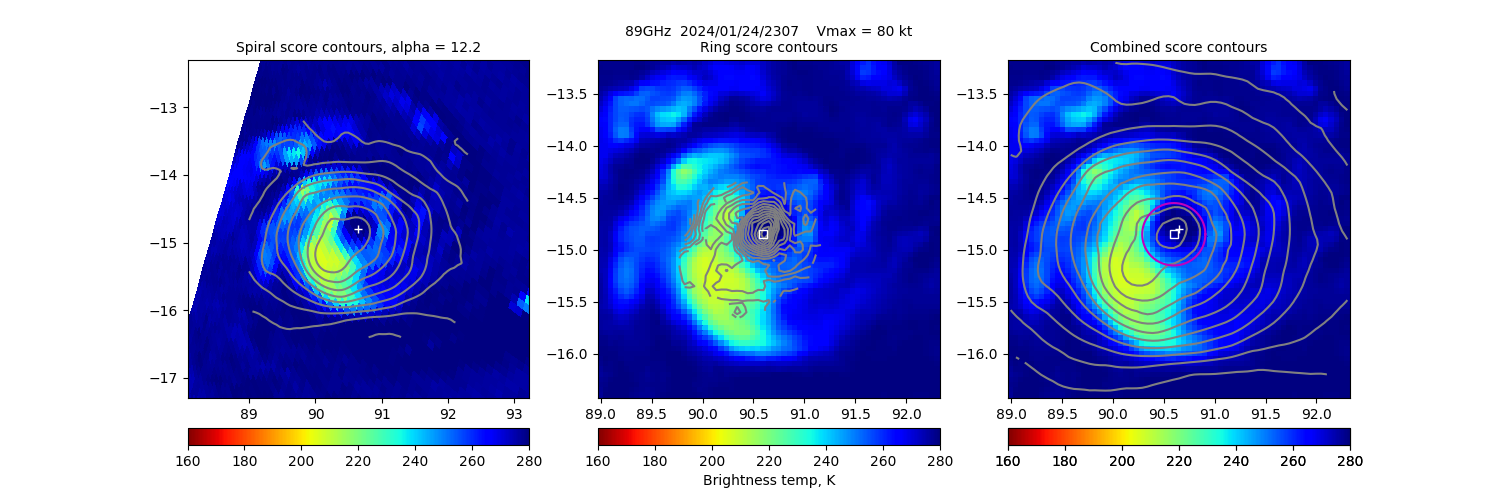
20240124 211314 SSMISF18 -14.8 90.8 57 1% 3.83 3.83 N/A 80.0 -14.7 90.8 Analysis Plot
20240124 230718 SSMISF16 -14.9 90.6 57 39% 21.95 21.95 >65 kts 80.0 -14.8 90.7 Analysis Plot
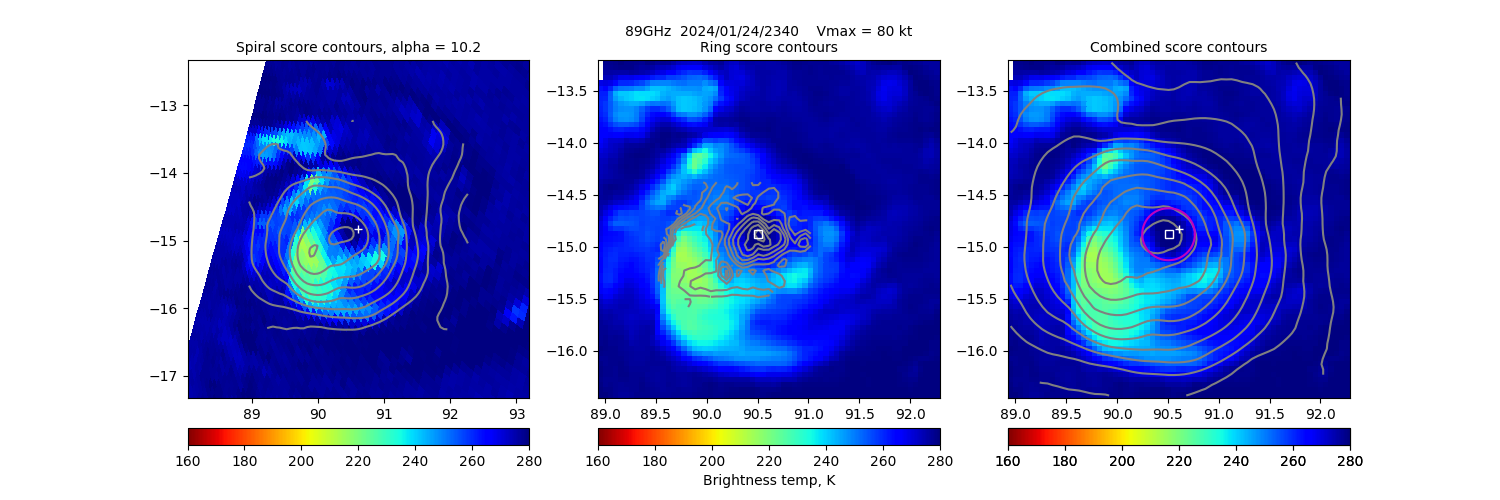
20240124 234034 SSMISF17 -14.9 90.5 46 1% 17.46 17.46 N/A 80.0 -14.8 90.6 Analysis Plot
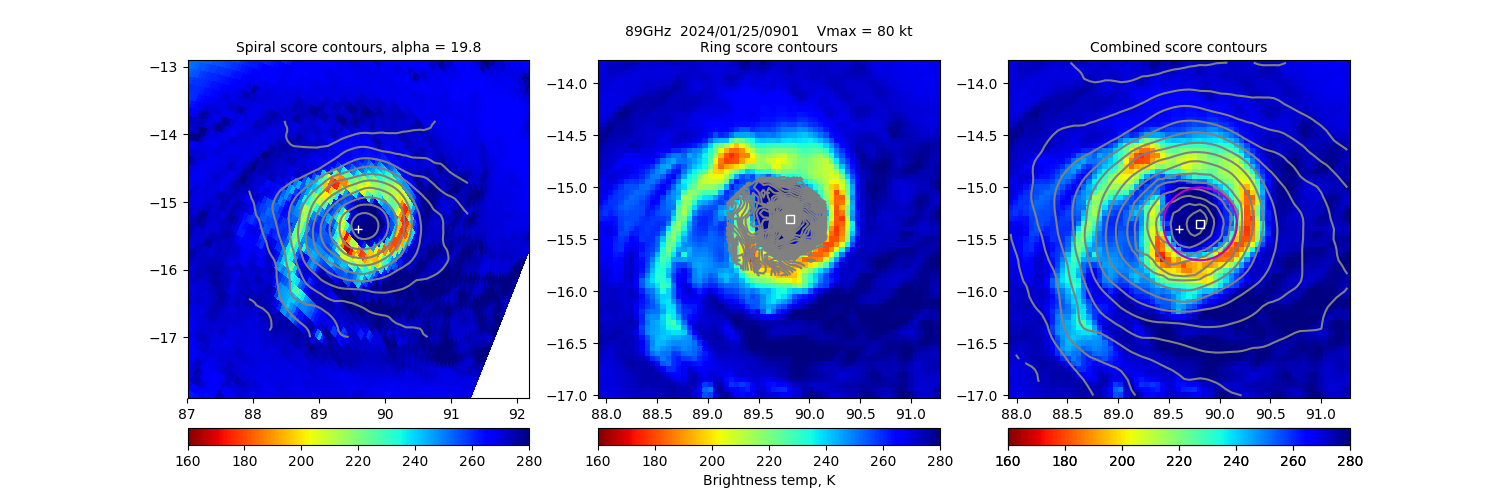
20240125 090107 GMI -15.4 89.8 68 100% 24.68 39.68 >65 kts 80.0 -15.4 89.6 Analysis Plot
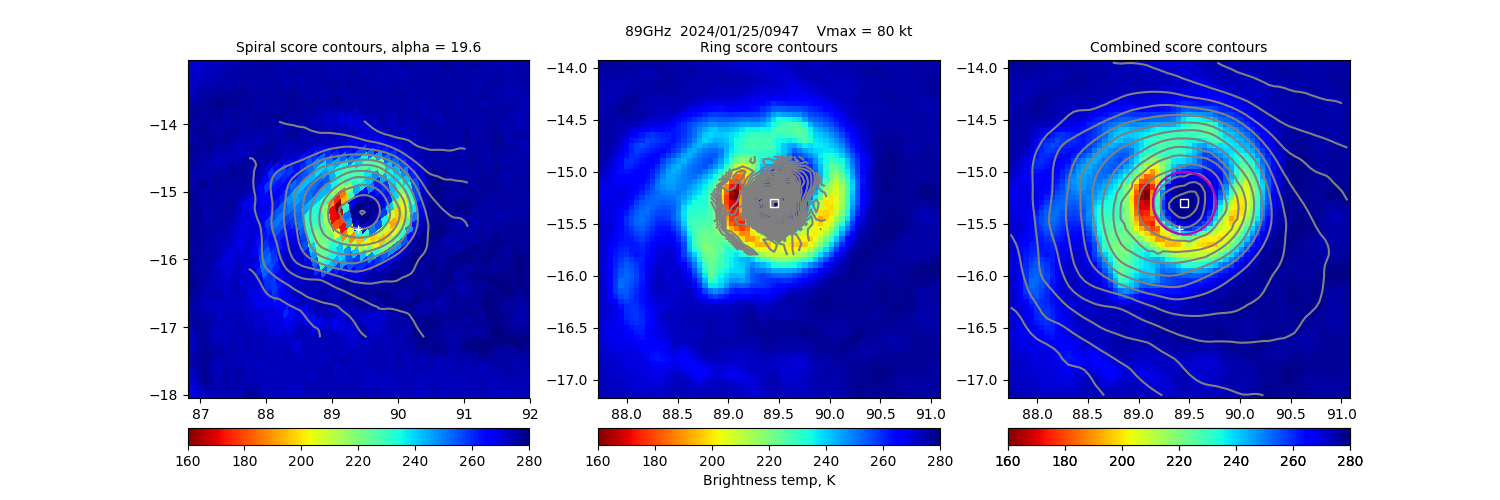
20240125 094756 SSMISF18 -15.3 89.4 57 100% 31.90 46.90 >65 kts 80.0 -15.6 89.4 Analysis Plot
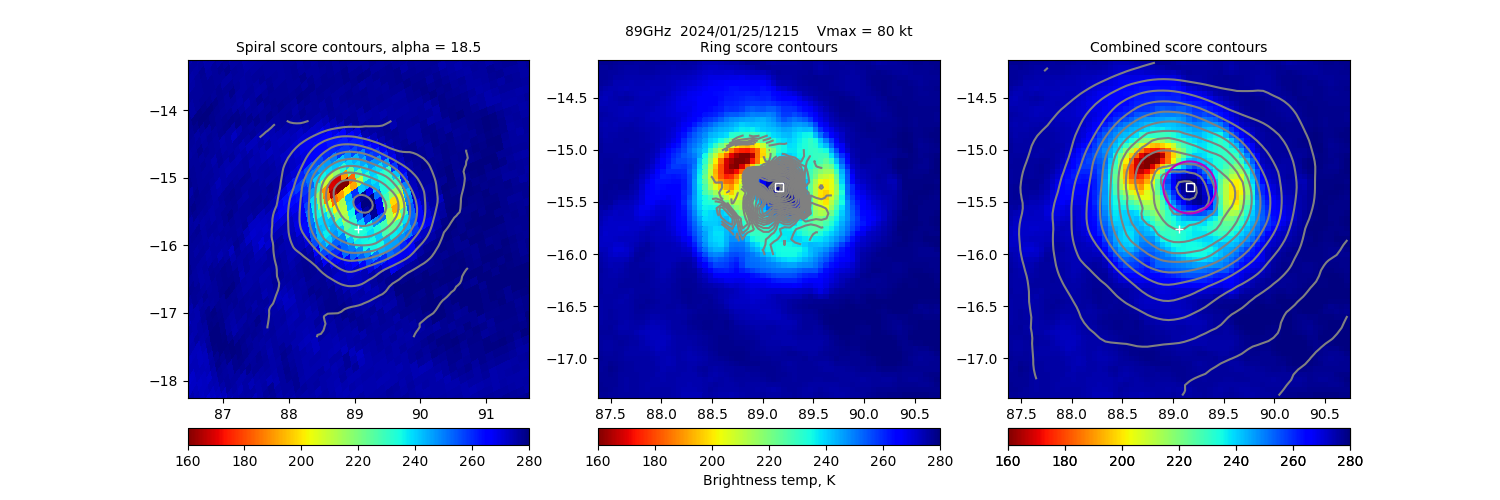
20240125 121511 SSMISF17 -15.4 89.2 46 100% 41.24 56.24 >65 kts 80.0 -15.8 89.1 Analysis Plot
20240126 214145 GMI -18.6 83.4 46 43% 6.68 6.68 N/A 105.0 -18.5 83.5 Analysis Plot
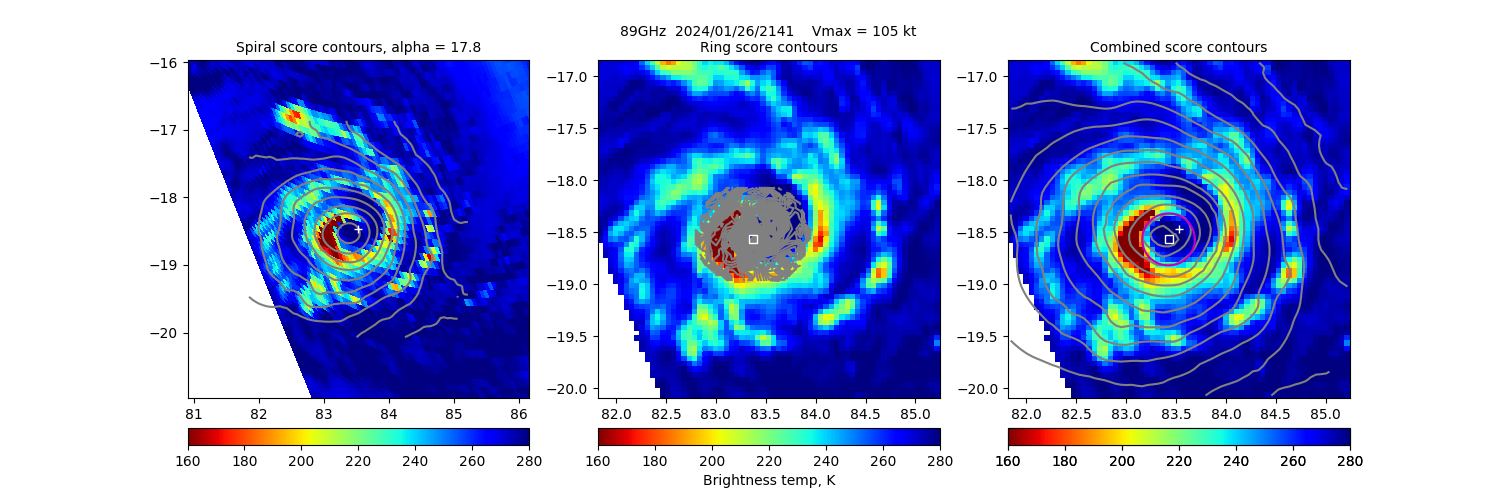
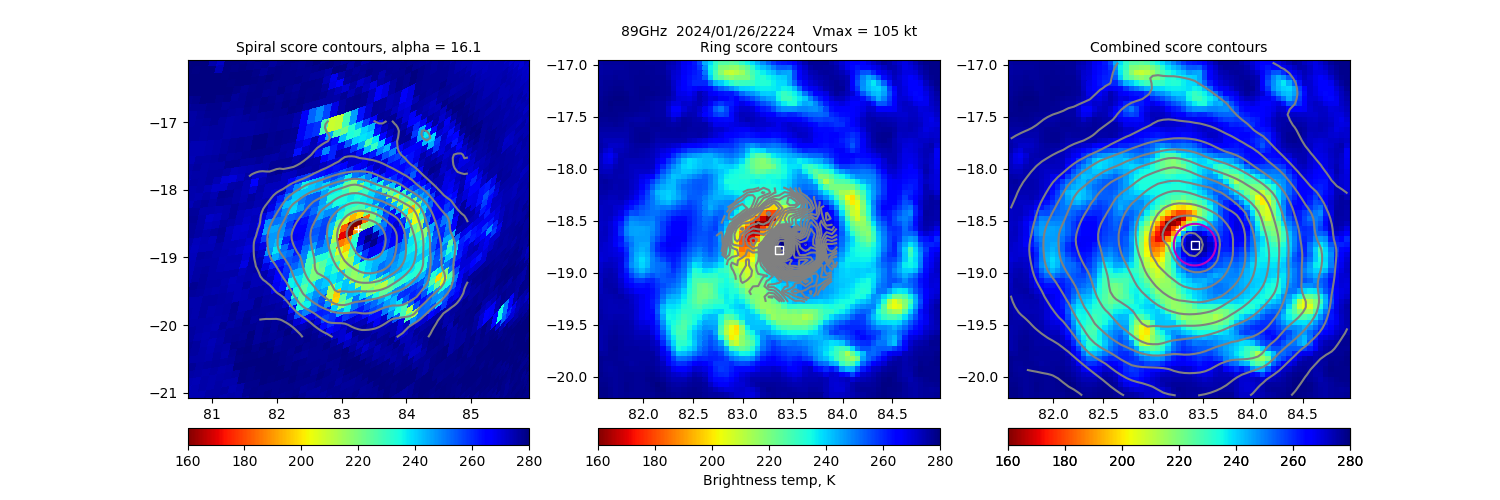
20240126 222412 SSMISF18 -18.7 83.4 34 44% 18.59 18.59 N/A 105.0 -18.6 83.3 Analysis Plot
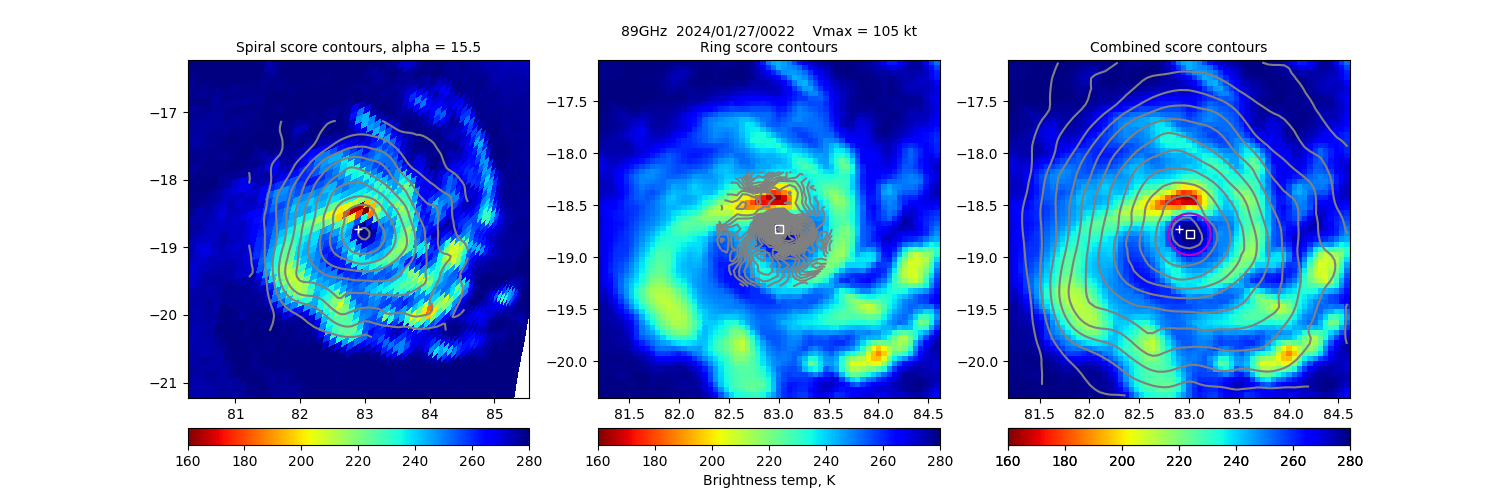
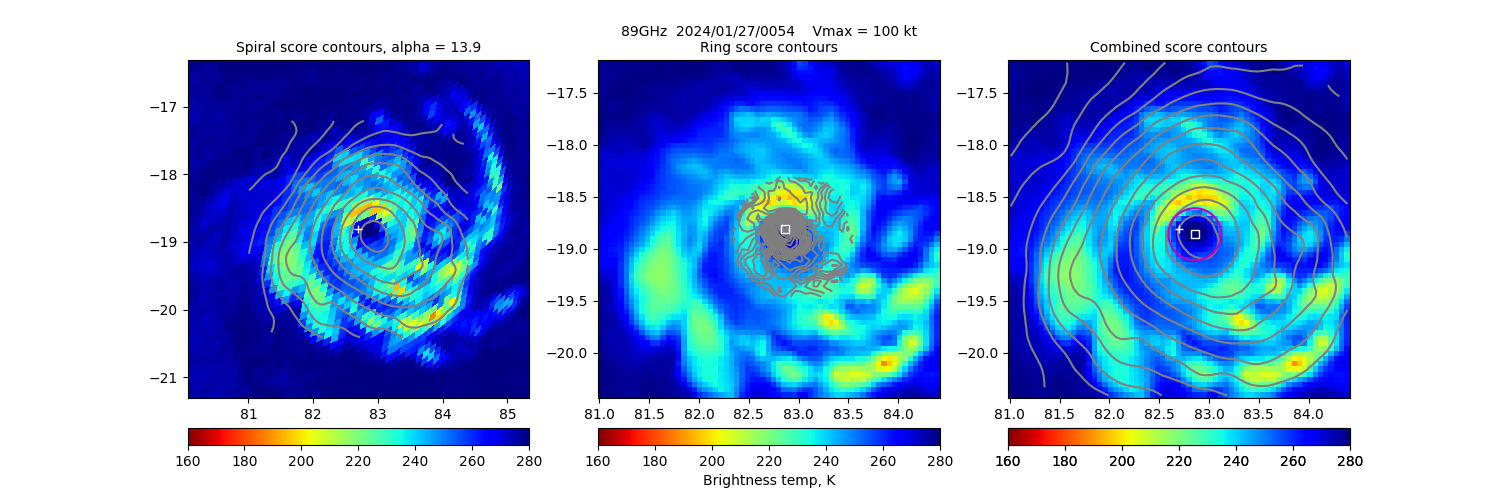
20240127 002235 SSMISF16 -18.8 83.0 34 100% 30.92 45.92 >65 kts 105.0 -18.7 82.9 Analysis Plot
20240127 005456 SSMISF17 -18.9 82.9 46 100% 33.66 48.66 >65 kts 100.0 -18.8 82.7 Analysis Plot
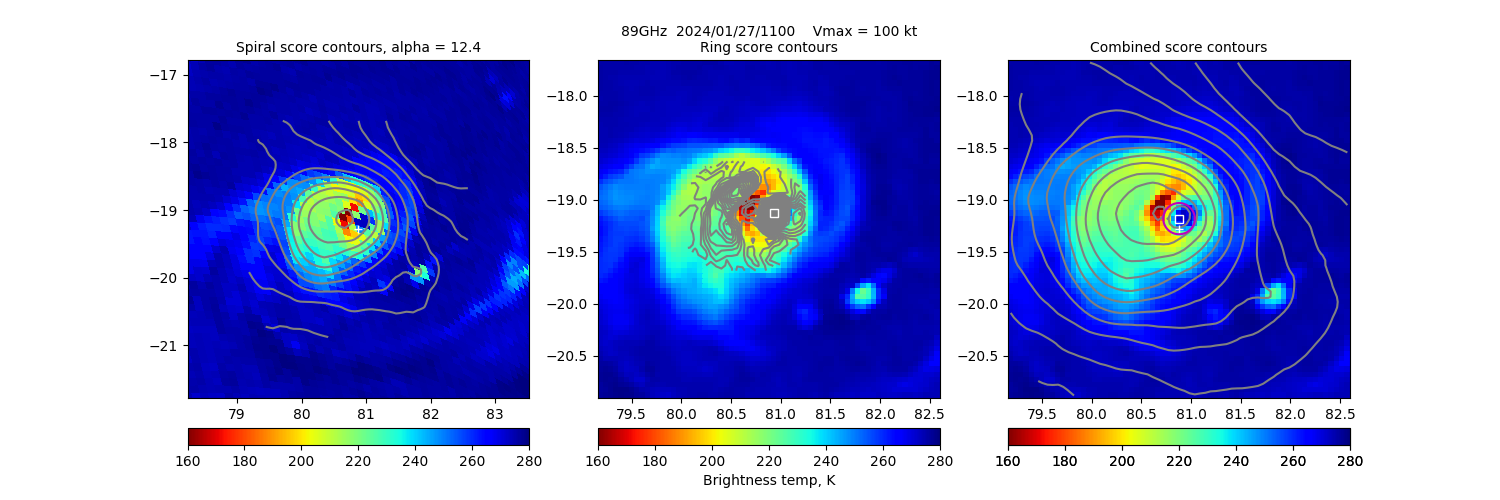
20240127 110051 SSMISF18 -19.2 80.9 23 100% 42.21 57.21 >65 kts 100.0 -19.3 80.9 Analysis Plot
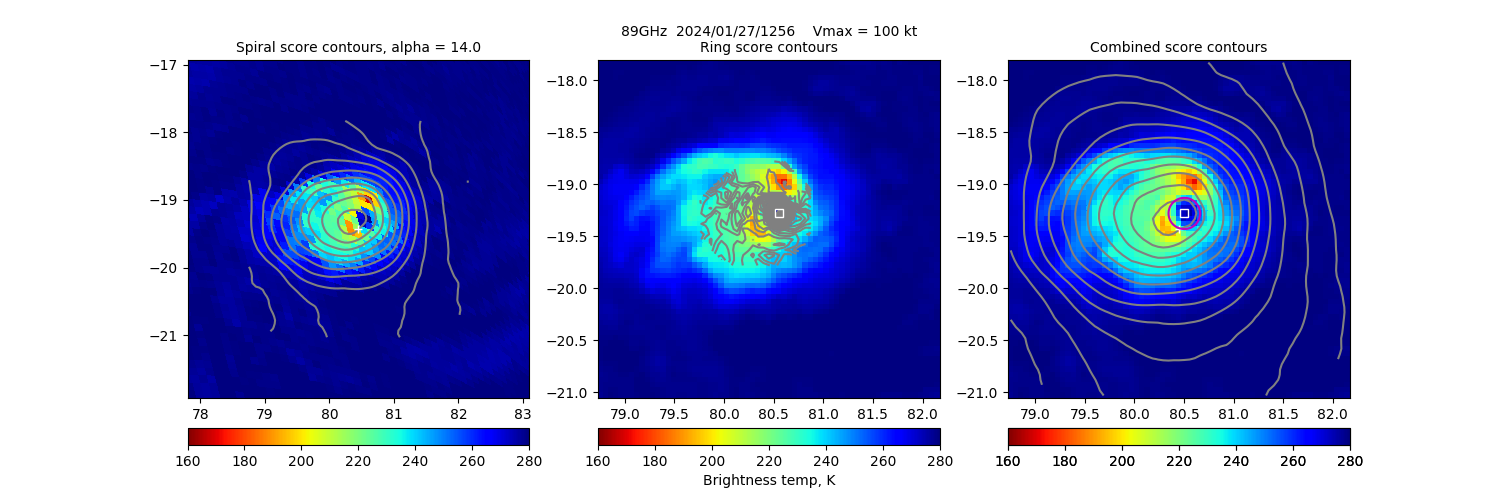
20240127 125603 SSMISF16 -19.3 80.5 23 100% 41.47 56.47 >65 kts 100.0 -19.4 80.4 Analysis Plot
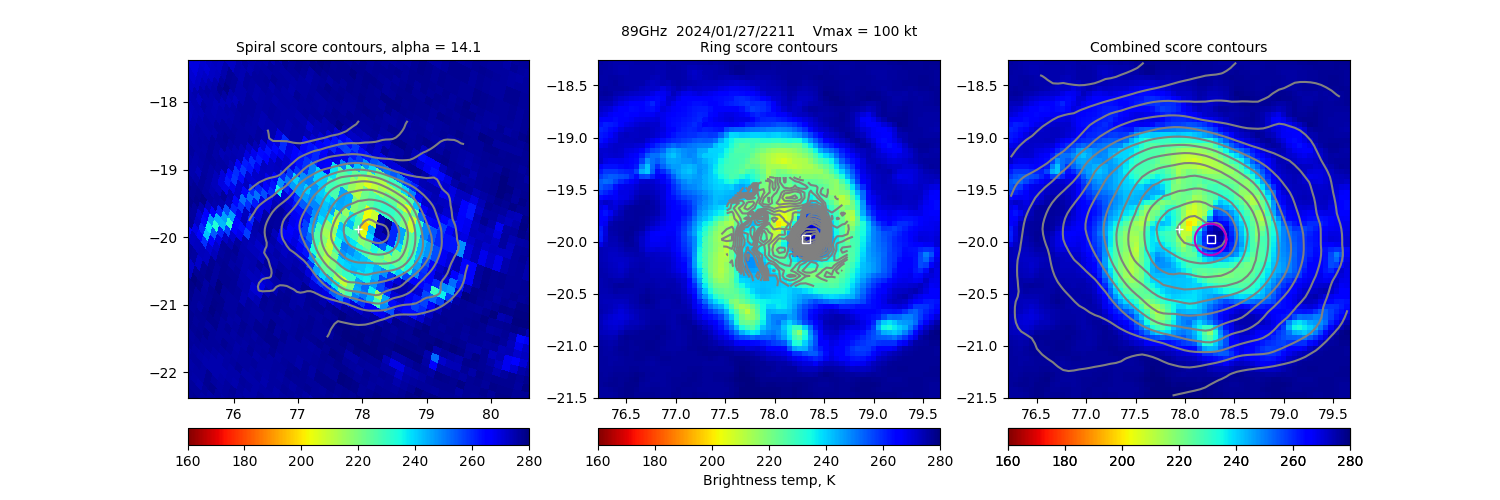
20240127 221157 SSMISF18 -20.0 78.3 23 100% 34.57 49.57 >65 kts 100.0 -19.9 77.9 Analysis Plot
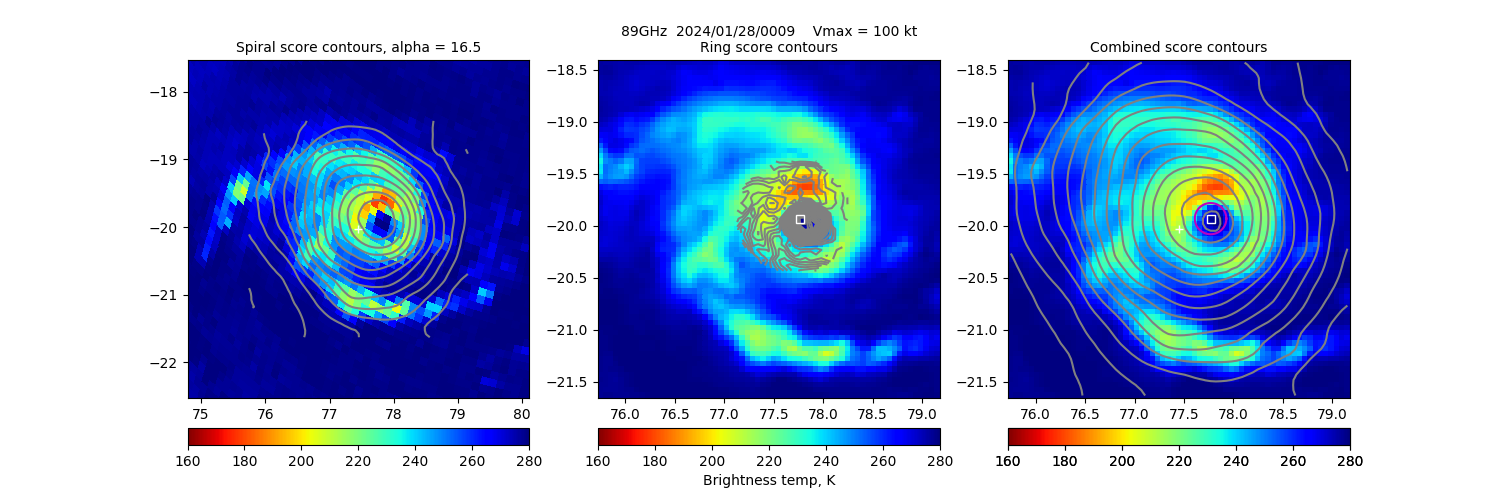
20240128 000945 SSMISF16 -19.9 77.8 23 100% 45.12 60.12 >85 kts 100.0 -20.0 77.4 Analysis Plot
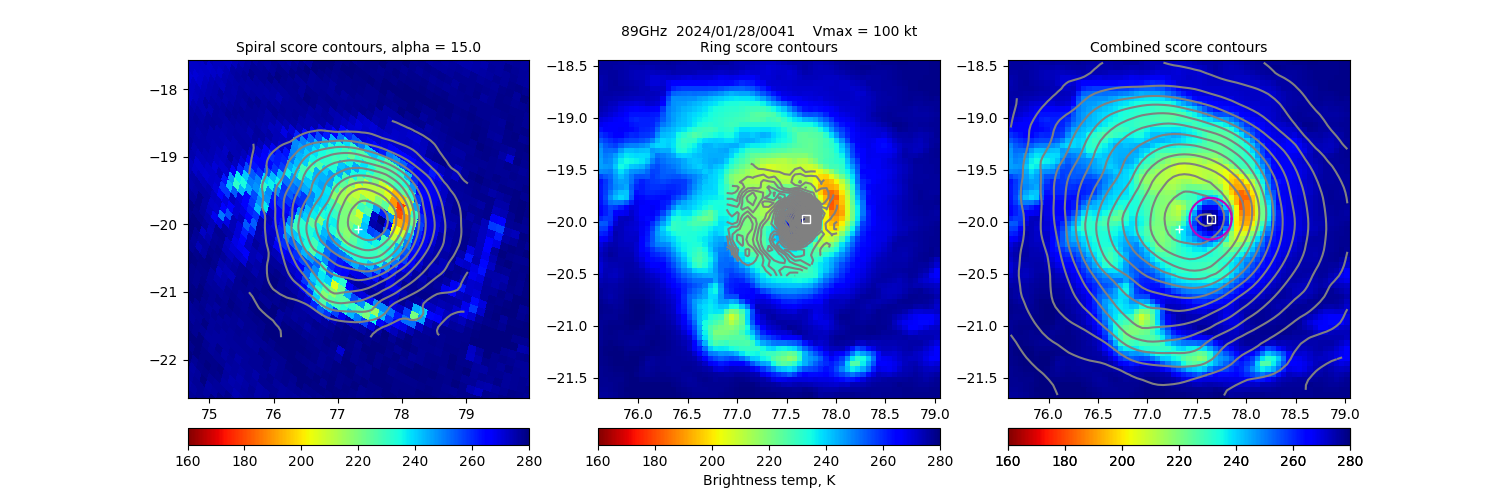
20240128 004140 SSMISF17 -20.0 77.6 34 100% 44.93 59.93 >65 kts 100.0 -20.1 77.3 Analysis Plot
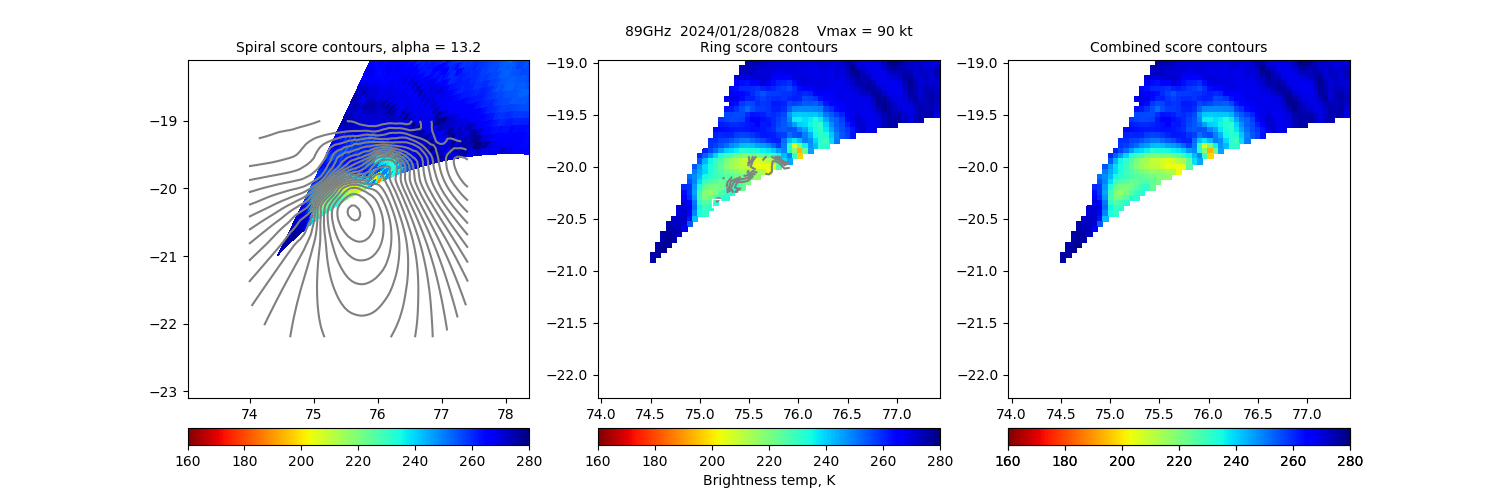
20240128 082856 GMI -20.4 75.7 N/A N/A N/A N/A N/A 90.0 -20.6 75.7 Analysis Plot
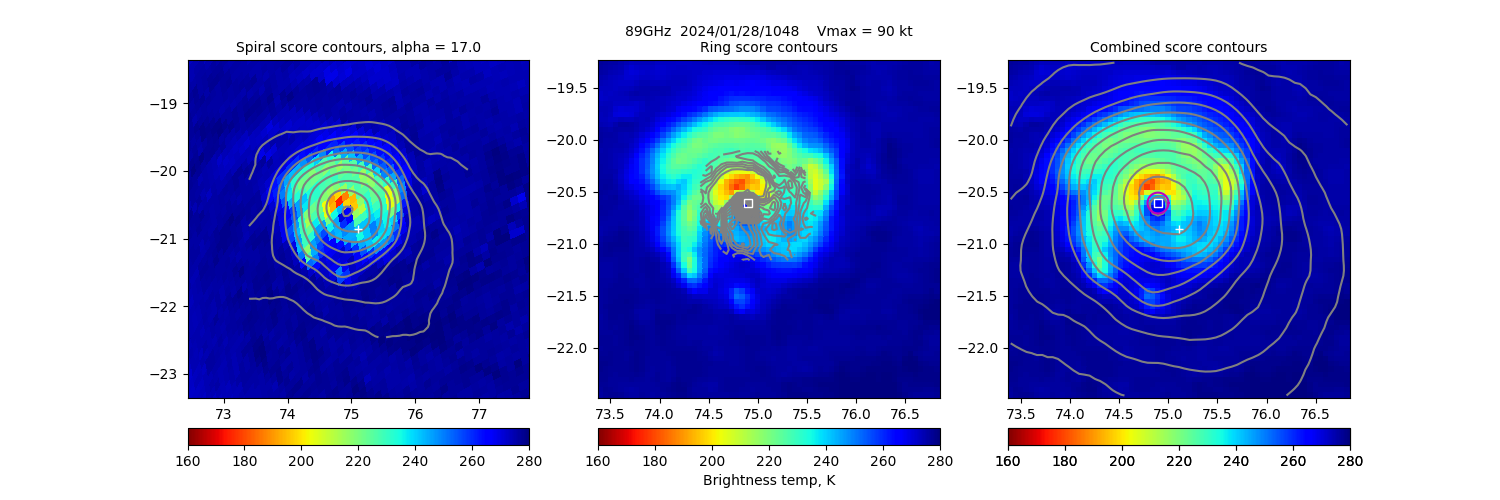
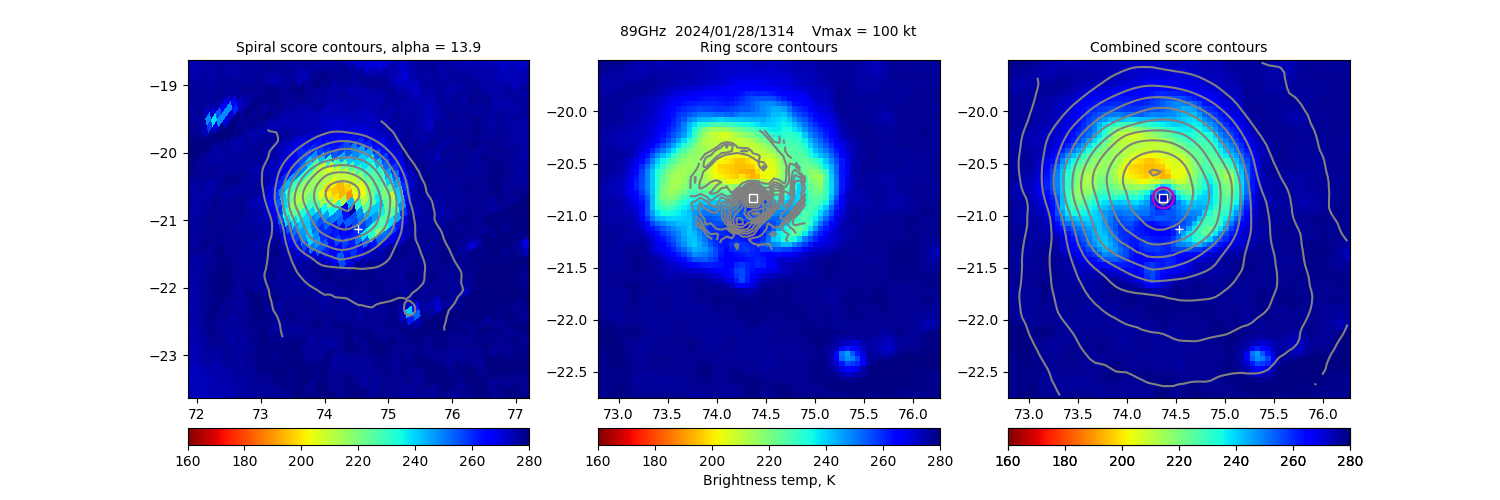
20240128 104801 SSMISF18 -20.6 74.9 12 100% 22.31 37.31 >65 kts 90.0 -20.9 75.1 Analysis Plot
20240128 131415 SSMISF17 -20.8 74.4 12 46% 17.52 17.52 N/A 100.0 -21.1 74.5 Analysis Plot
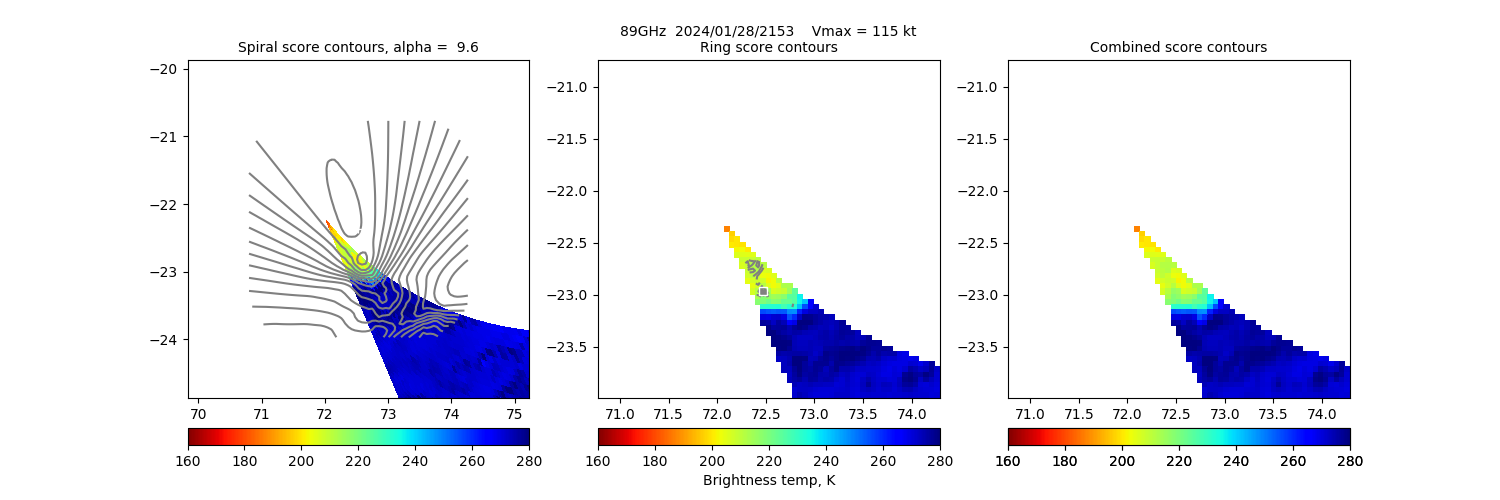
20240128 215355 GMI -22.3 72.5 N/A N/A N/A N/A N/A 115.0 -22.4 72.5 Analysis Plot
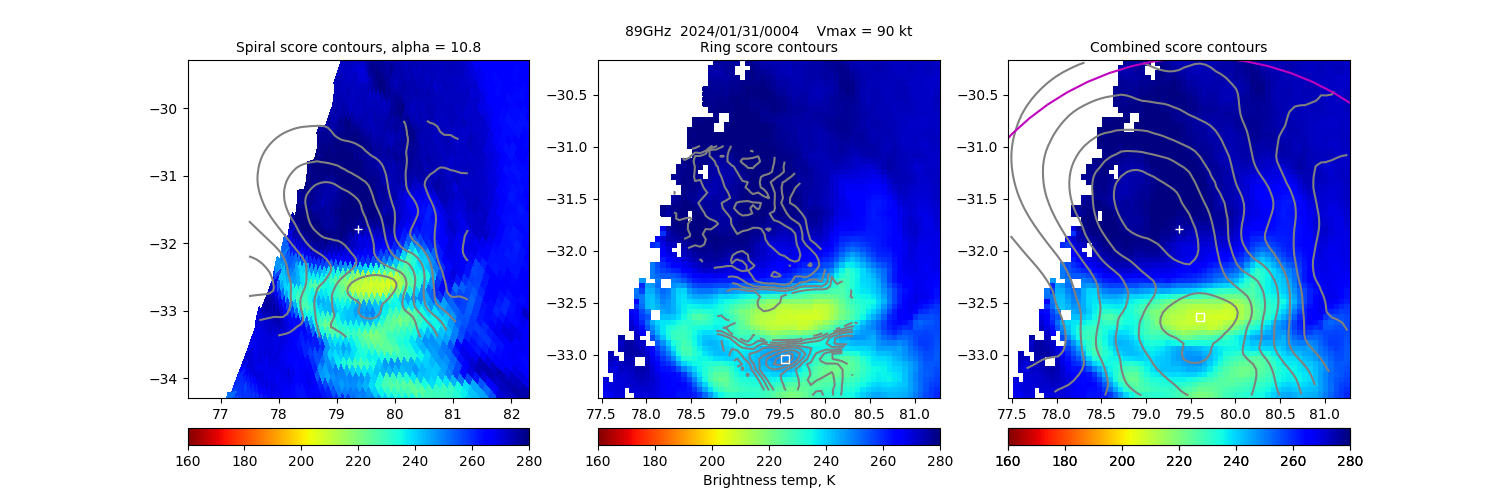
20240130 233400 SSMISF16 -31.4 78.8 N/A N/A N/A N/A N/A 90.0 -31.7 79.1 Analysis Plot
20240131 000442 SSMISF17 -32.6 79.6 N/A N/A N/A N/A N/A 90.0 -31.8 79.4 Analysis Plot
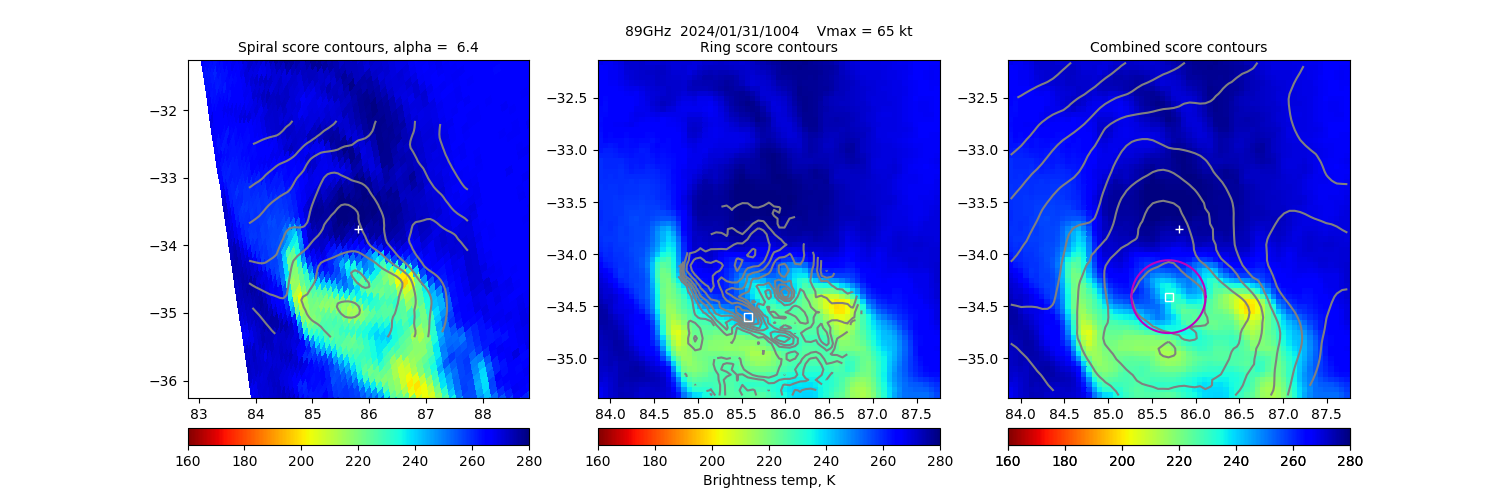
20240131 100429 SSMISF18 -34.4 85.7 N/A N/A N/A N/A N/A 65.0 -33.8 85.8 Analysis Plot
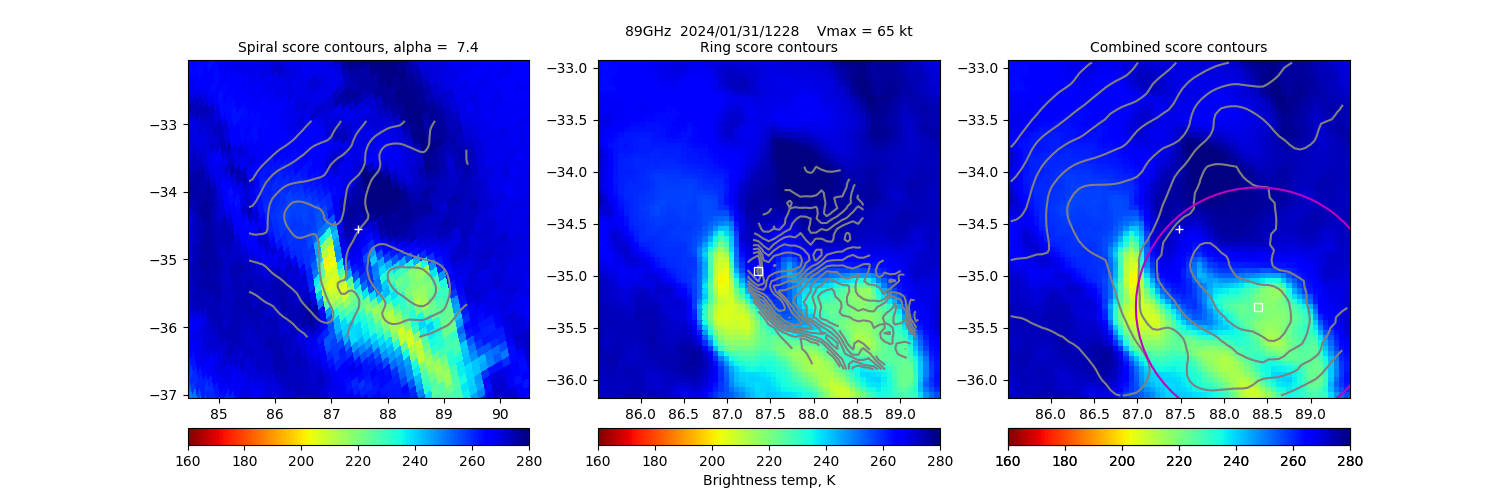
20240131 122856 SSMISF17 -35.3 88.4 N/A N/A N/A N/A N/A 65.0 -34.5 87.5 Analysis Plot
|
|
Legend - Overpass Date/Time are determined from satellite overpass of targeted TC (position determined from Best Track Lat/Lon position). Date is YYYYMMDD and time in HHMMSS (UTC). - Forecast (Best Track) and ARCHER positions (deg) of the TC center at overpass day/time. Positive/Negative: Latitude = North/South Hemisphere; Longitude = Eastern/Western Hemisphere. - BT Vmax is the concurrent ATCF Best Track (BT) wind speed intensity estimate (Vmax) value from either NOAA/National Hurricane Center (NHC) (North Atlantic and Northeast Pacific), NOAA/Central Pacific Hurricane Center (CPHC) (North-central Pacific) or Joint Typhoon Warning Center (JTWC) (Northwest Pacific, Indian Ocean, or Southwest Pacific). - Sat is the satellite descriptor providing the overpass. Currently the satellites used are the DMSP/SSMIS-16/17/18, GPM/GMI, and GCOM/AMSR2. - Ring Diam (km) indicates the estimated surface eyewall diameter if one is analyzed in the PMW imagery. The value listed is the average PMW-estimated inner eyewall edge diameter minus 10 km for eyewall slope. N/A indicates no appreciable eyewall is analyzed. - Ring Pct is the percentage of the analyzed "ring" (eyewall inner boundary) that is 1) colder than the eye Tb (the "hot spot" -- warmest eye pixel) by at least 20K, or 2) that is colder than 232K and colder than the eye Tb by 10K, whichever is greater. Values are red if Ring % ≤65,yellow/brown if Ring % ≤85 and green if Ring % >85. N/A indicates no appreciable eyewall is analyzed. A value over 85% is used in the intensity score by adding 15 points to it. - TbDiff is the difference between the warmest eye pixel and the warmest pixel on the eyewall. This value is used in the Intensity Score. N/A indicates no appreciable eyewall is analyzed. - Eye Score values are based on the strength and organization of the convective/eyewall signatures in the PMW imagery, and based on the ARCHER center location. They normally range from 0 to 100 with empirically-determined thresholds related to intensity (Vmax) in the "Meaning" column (≥20 suggests ≥65kts; ≥60 suggests ≥85kts). Scores are listed as negative, and not used by the ADT, when the NHC, CPHC, or JTWC Best Track Vmax is <55 kts in order to filter out occasional "false eye" cases. A value of -920 is used when the warmest eye pixel is <200K to prevent false positives; -930 means edge of overpass and <85% of eyewall is captured and therefore can't fully be analyzed. |