Tropical Depression 07P
|
Passive Microwave (PMW) Intensity Information Advanced Dvorak Technique Version 9.1 |
--Overpass-- --ARCHER-- Ring Ring Eye BT -Forecast-
Date Time Sat Lat Lon Diam Pct TbDiff Score Meaning Vmax Lat Lon
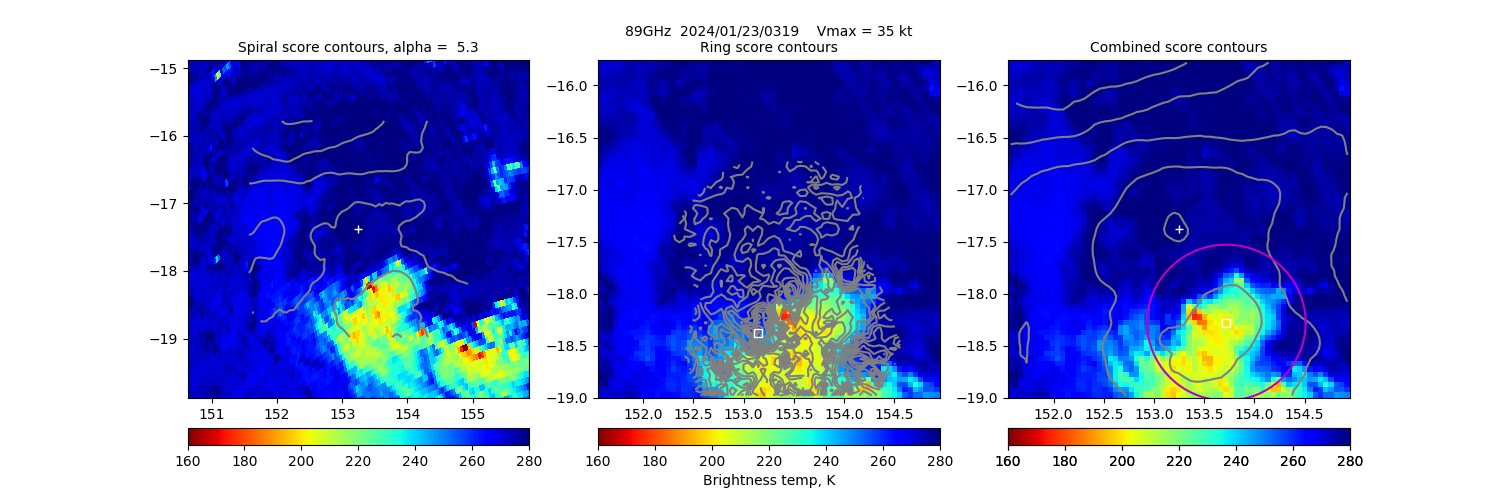
20240123 031900 AMSR2 -18.3 153.7 N/A N/A N/A N/A N/A 35.0 -17.4 153.3 Analysis Plot
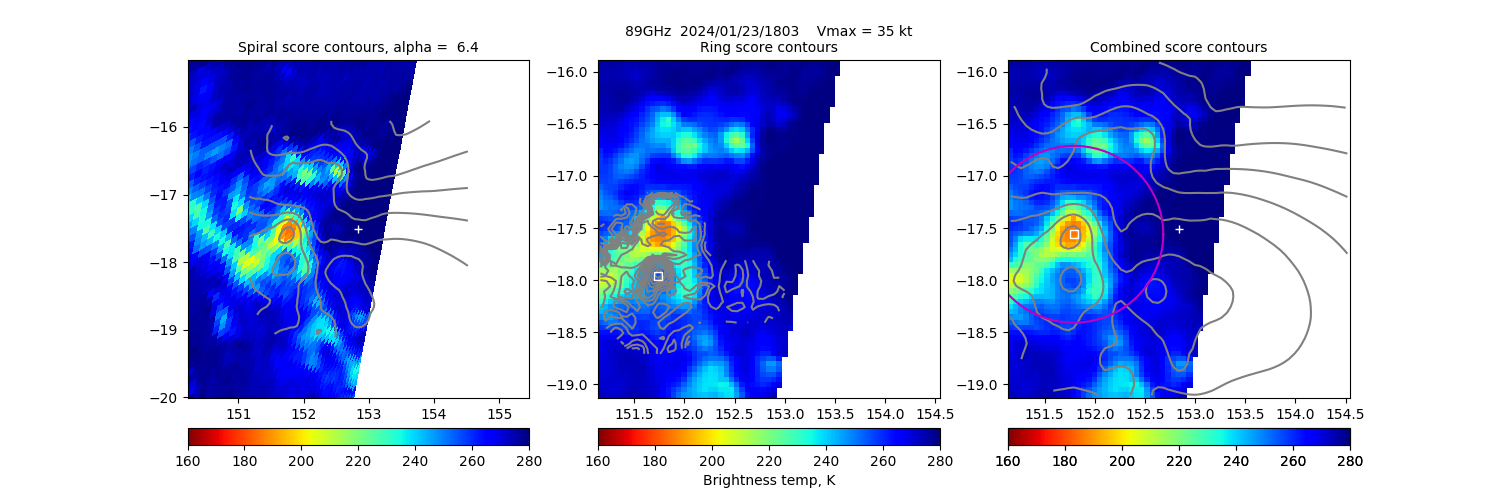
20240123 180312 SSMISF18 -17.6 151.8 N/A N/A N/A N/A N/A 35.0 -17.5 152.8 Analysis Plot
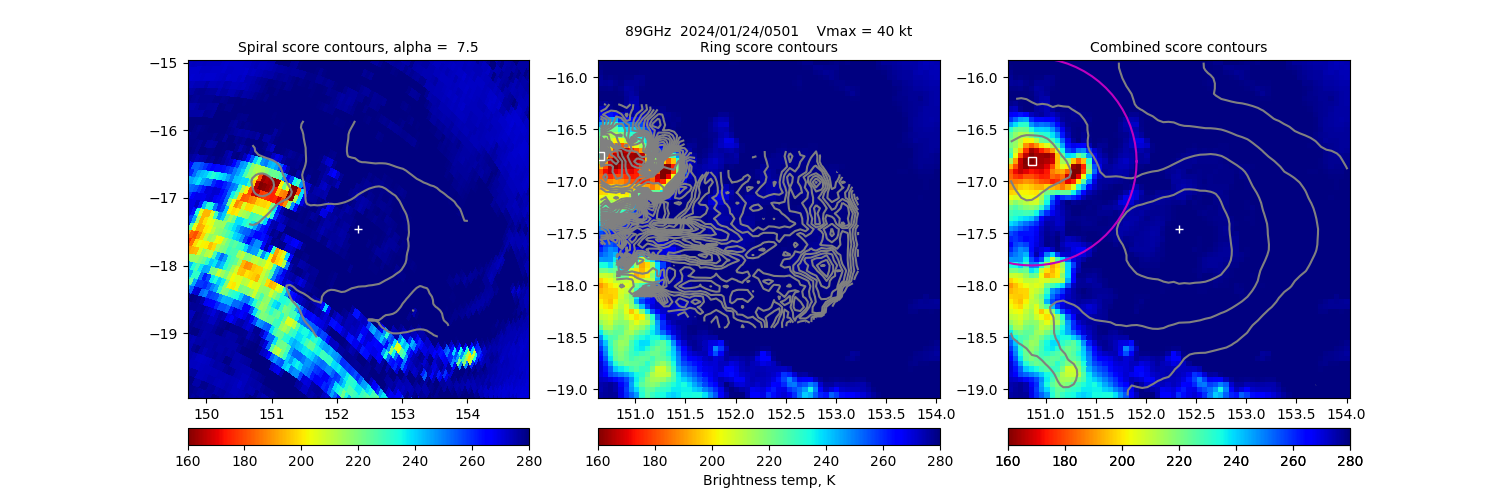
20240124 050147 GMI -16.8 150.9 N/A N/A N/A N/A N/A 40.0 -17.5 152.3 Analysis Plot
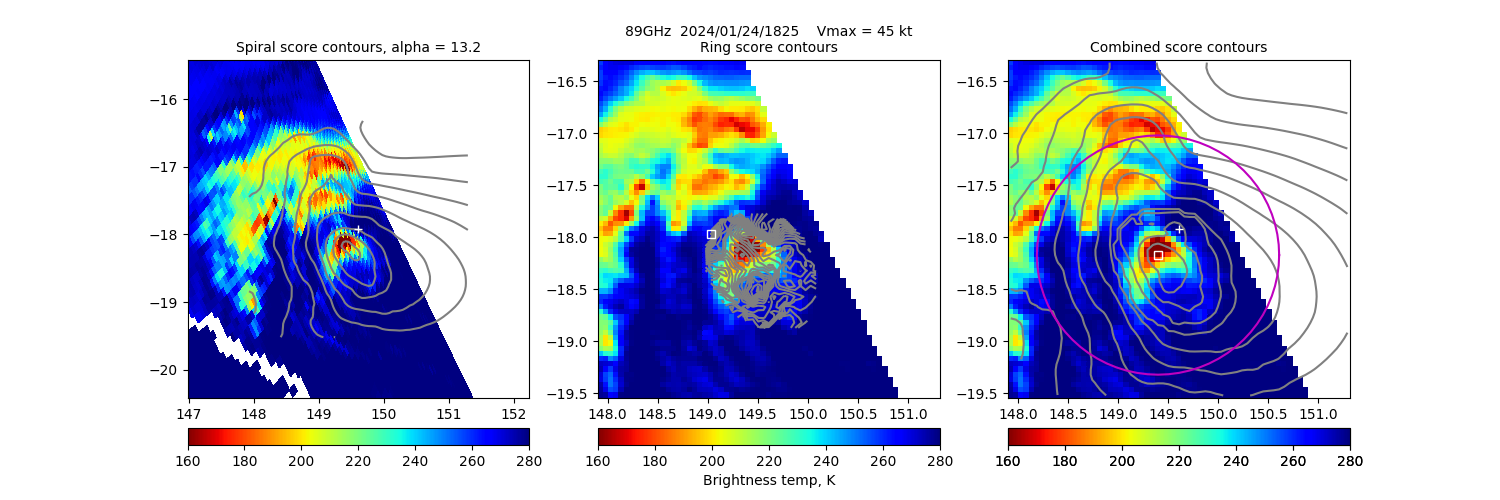
20240124 182528 GMI -18.2 149.4 N/A N/A N/A N/A N/A 45.0 -17.9 149.6 Analysis Plot
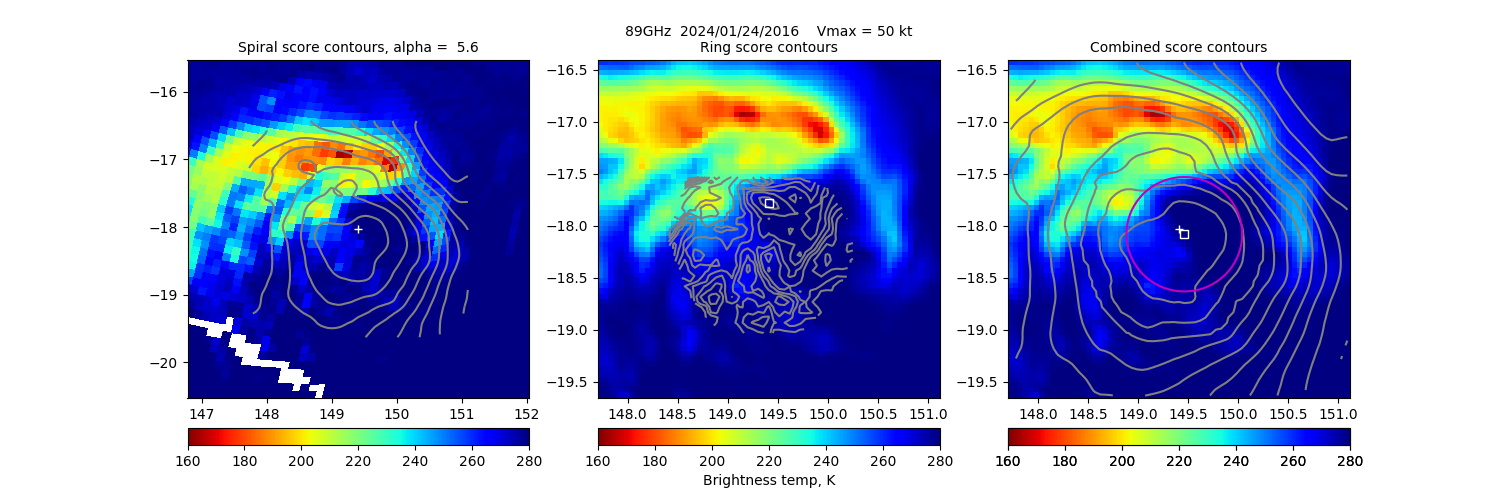
20240124 201635 SSMISF17 -18.1 149.5 112 6% 1.39 -1.39 N/A 50.0 -18.0 149.4 Analysis Plot
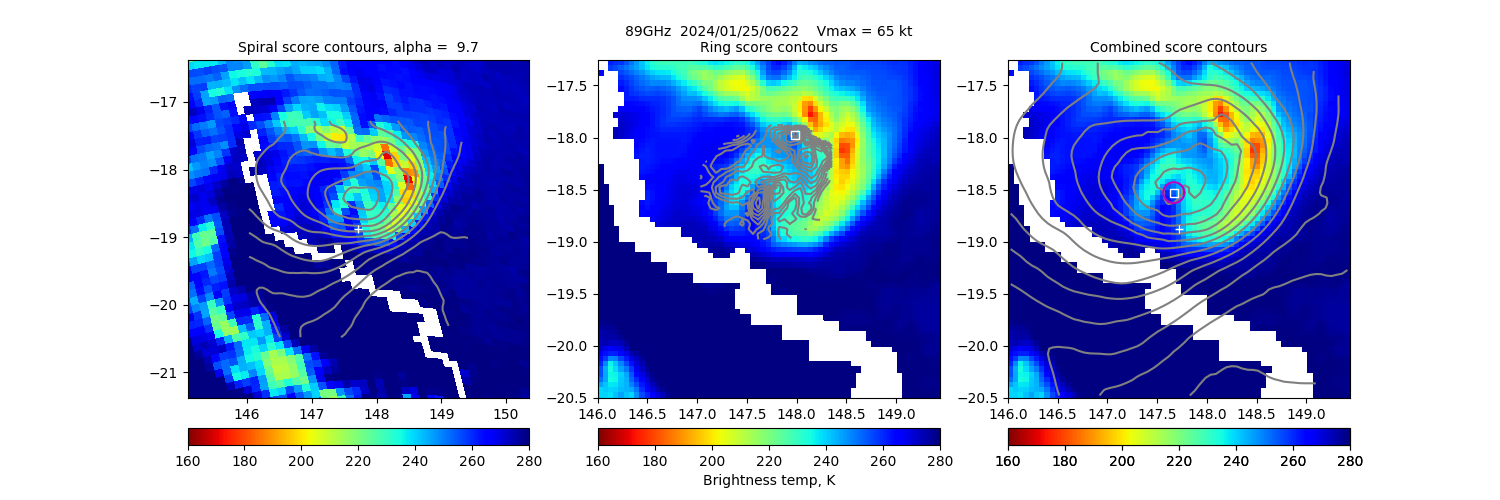
20240125 062237 SSMISF18 -18.5 147.7 12 14% 2.15 2.15 N/A 65.0 -18.9 147.7 Analysis Plot
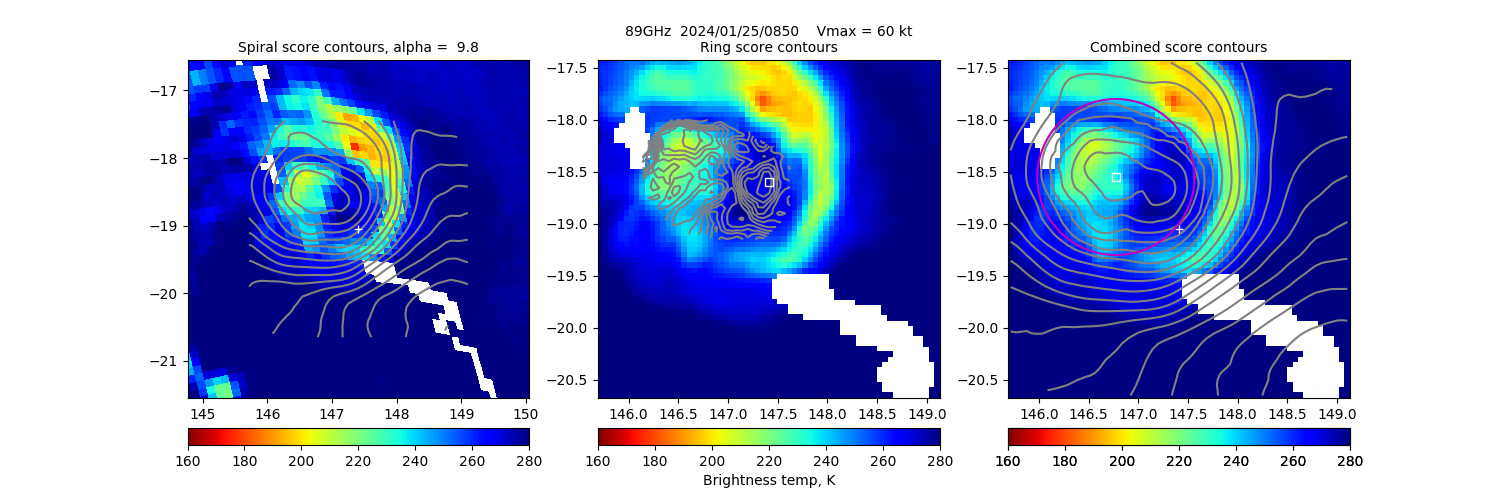
20240125 085007 SSMISF17 -18.5 146.8 157 13% 10.10 10.10 N/A 60.0 -19.0 147.4 Analysis Plot
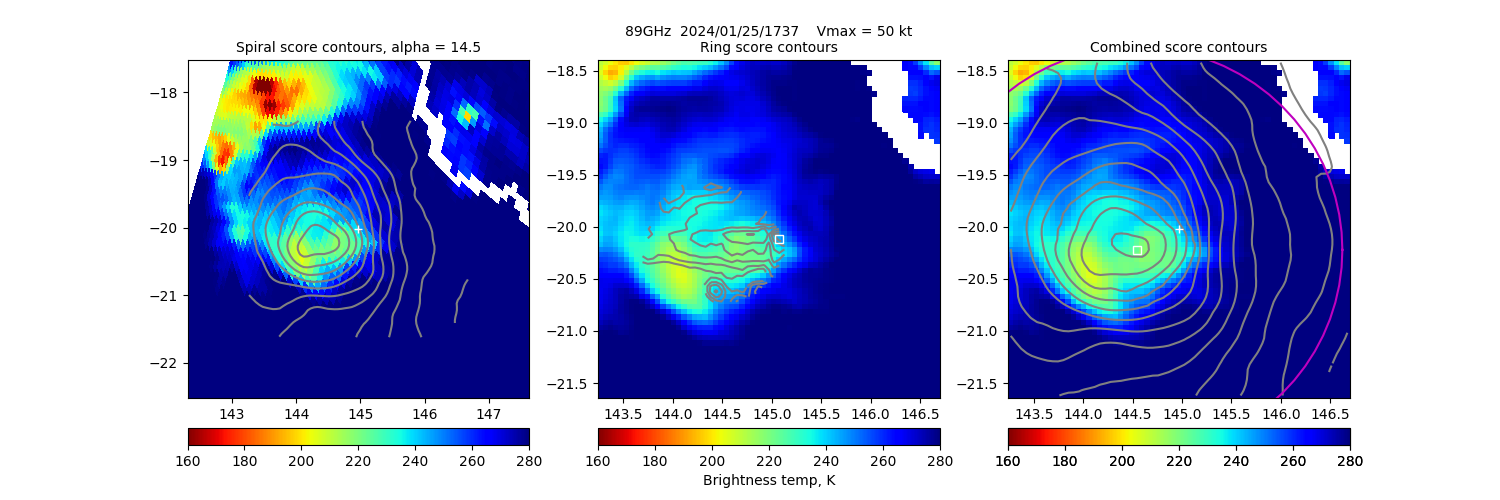
20240125 173703 SSMISF18 -20.2 144.5 N/A N/A N/A N/A N/A 50.0 -20.0 145.0 Analysis Plot
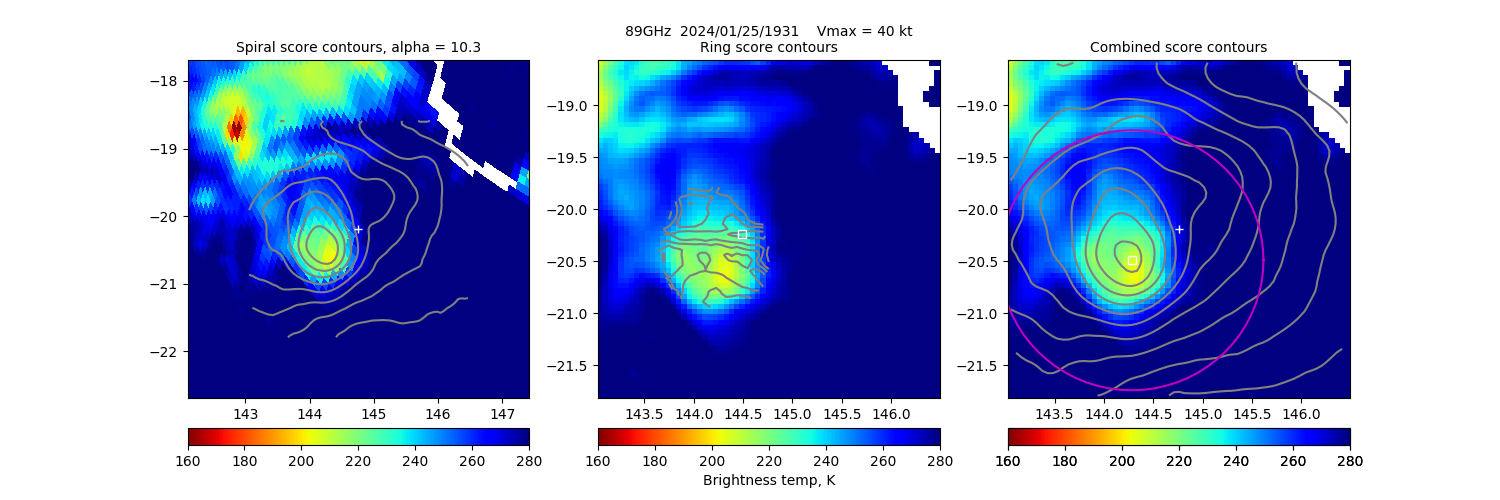
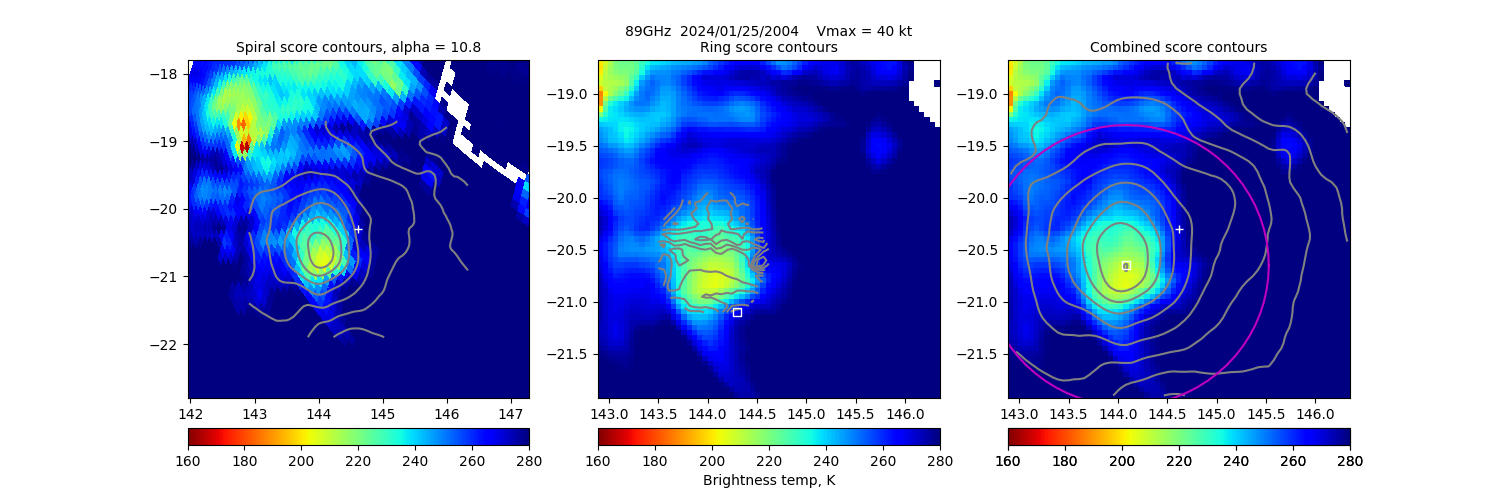
20240125 193117 SSMISF16 -20.5 144.3 N/A N/A N/A N/A N/A 40.0 -20.2 144.8 Analysis Plot
20240125 200415 SSMISF17 -20.6 144.1 N/A N/A N/A N/A N/A 40.0 -20.3 144.6 Analysis Plot
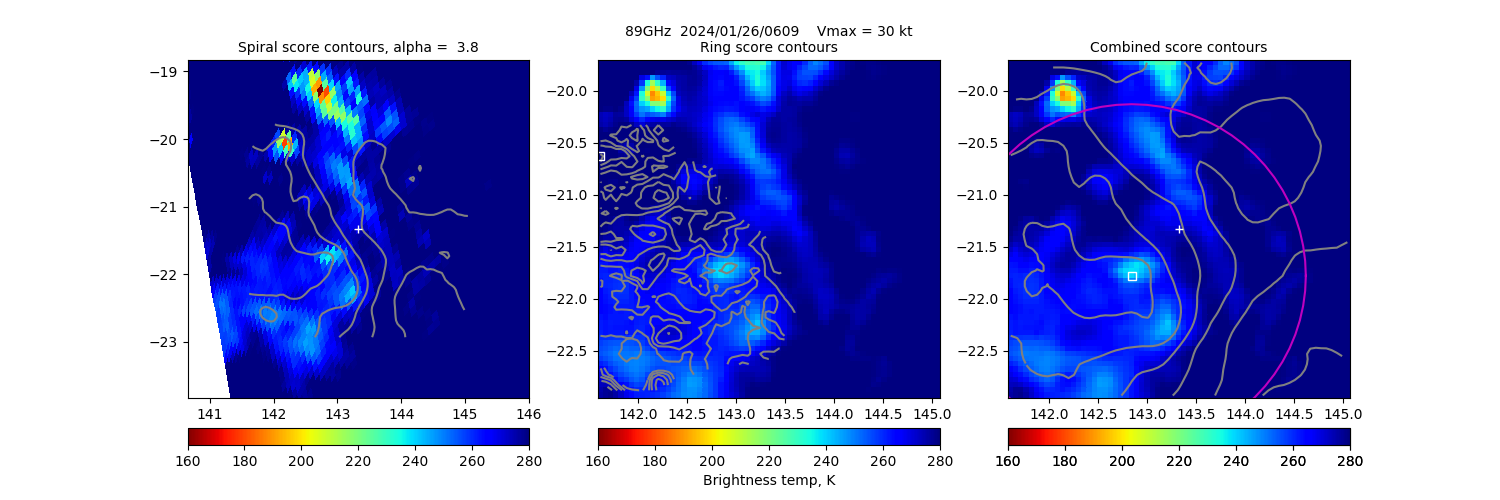
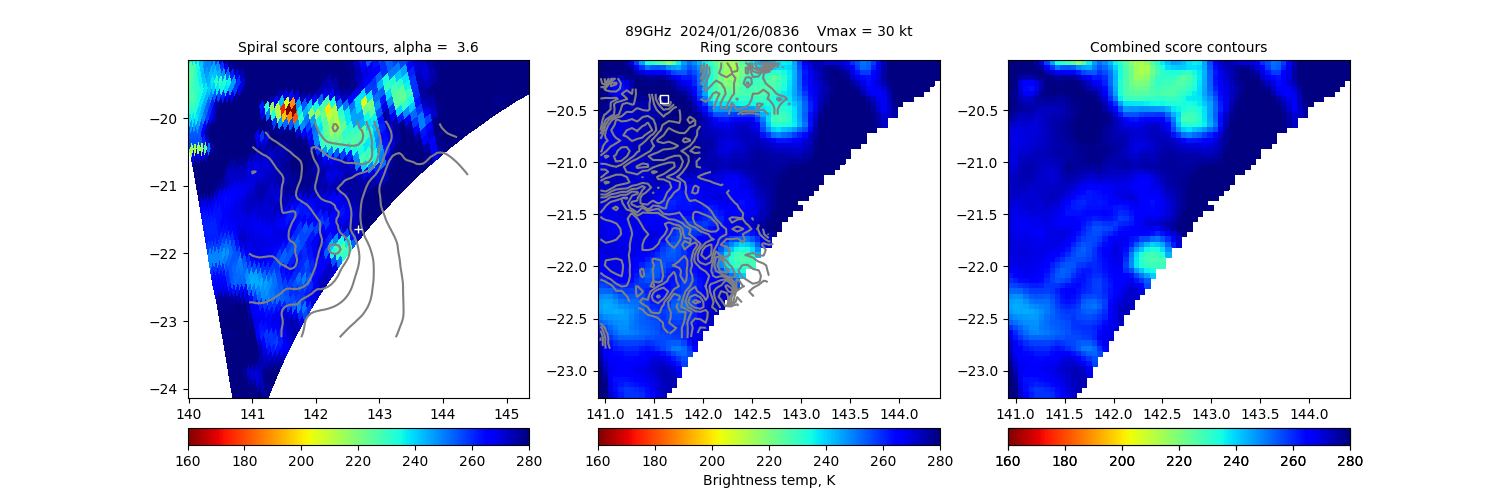
20240126 060926 SSMISF18 -21.8 142.9 N/A N/A N/A N/A N/A 30.0 -21.3 143.3 Analysis Plot
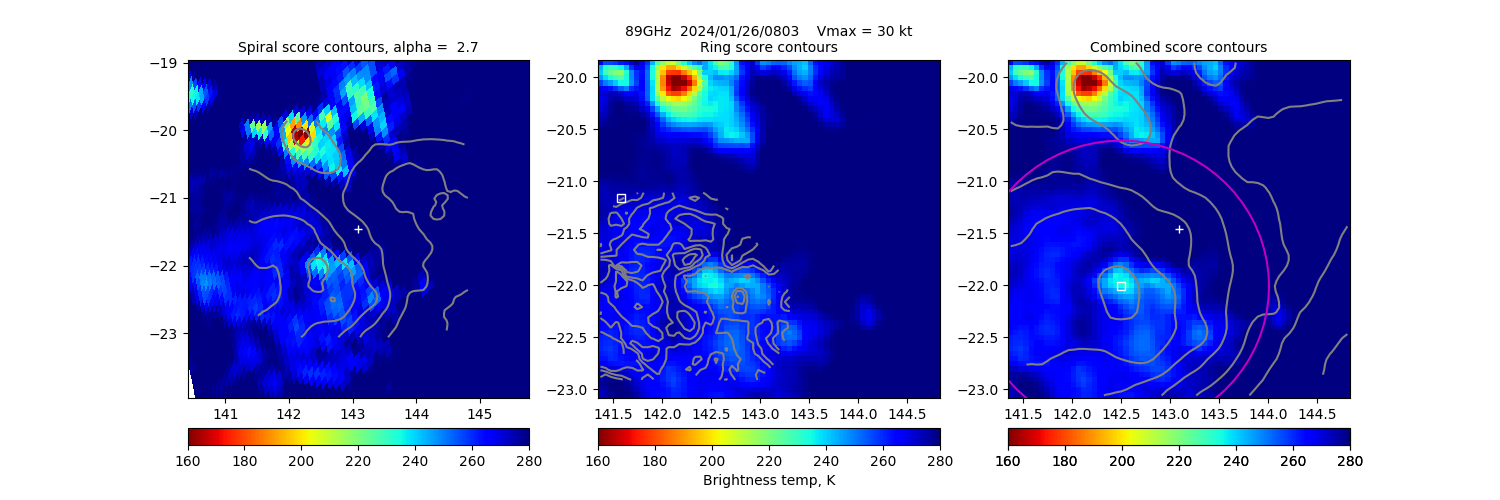
20240126 080337 SSMISF16 -22.0 142.5 N/A N/A N/A N/A N/A 30.0 -21.5 143.1 Analysis Plot
20240126 083632 SSMISF17 -21.7 141.2 N/A N/A N/A N/A N/A 30.0 -21.6 142.7 Analysis Plot
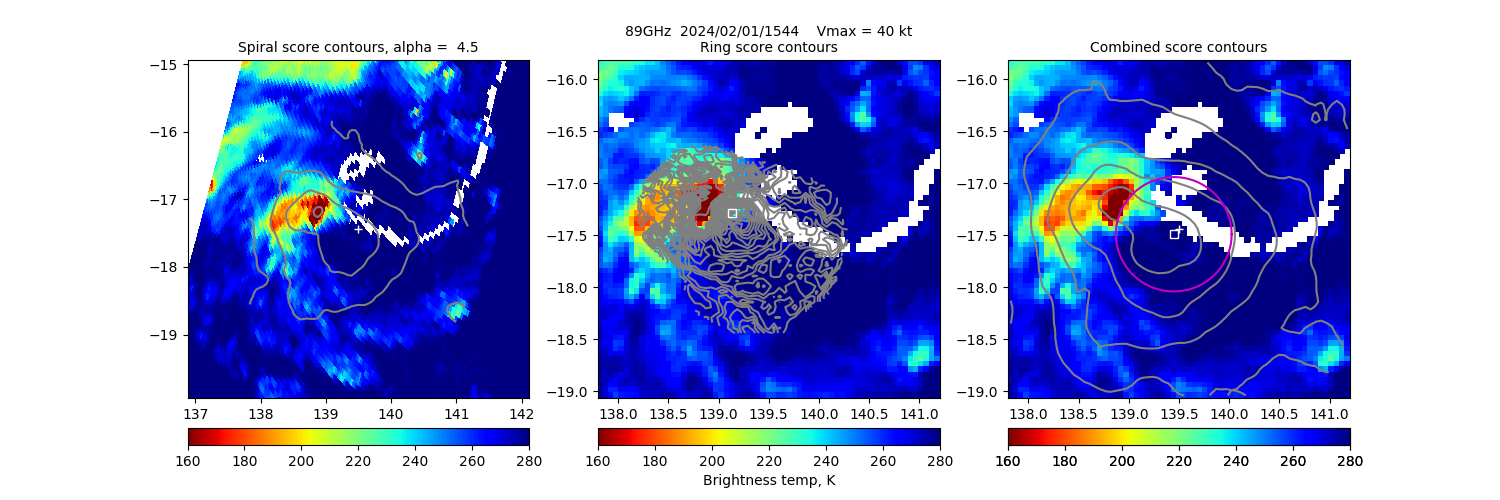
20240201 154412 AMSR2 -17.5 139.4 N/A N/A N/A N/A N/A 40.0 -17.4 139.5 Analysis Plot
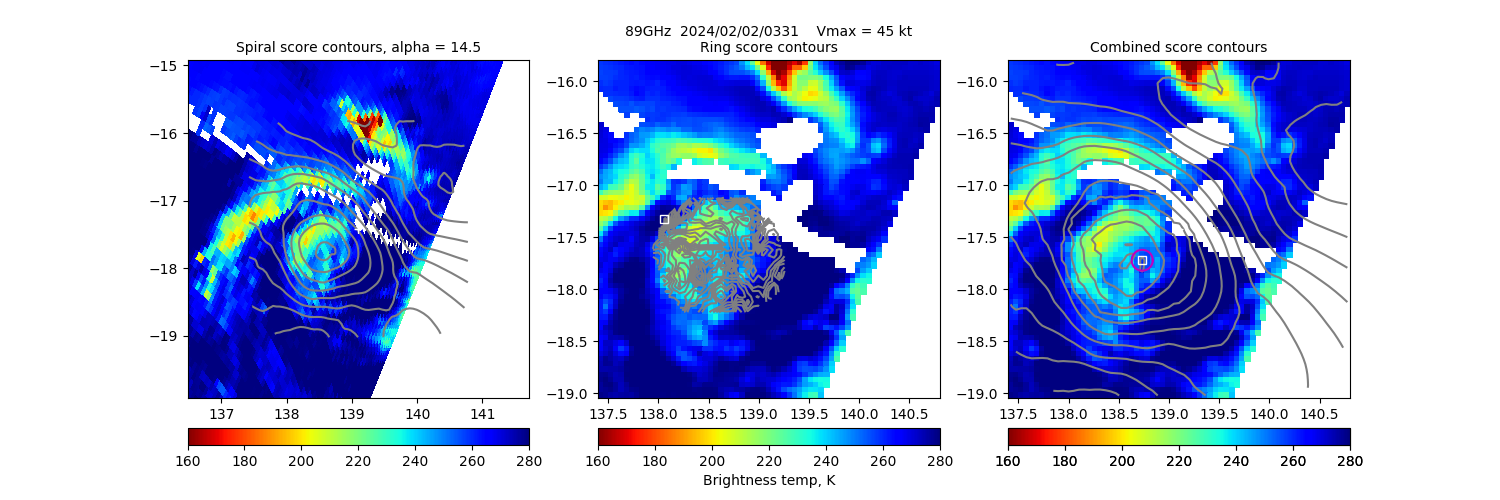
20240202 033108 GMI -17.7 138.7 12 10% 5.28 -5.28 N/A 45.0 -17.4 139.1 Analysis Plot
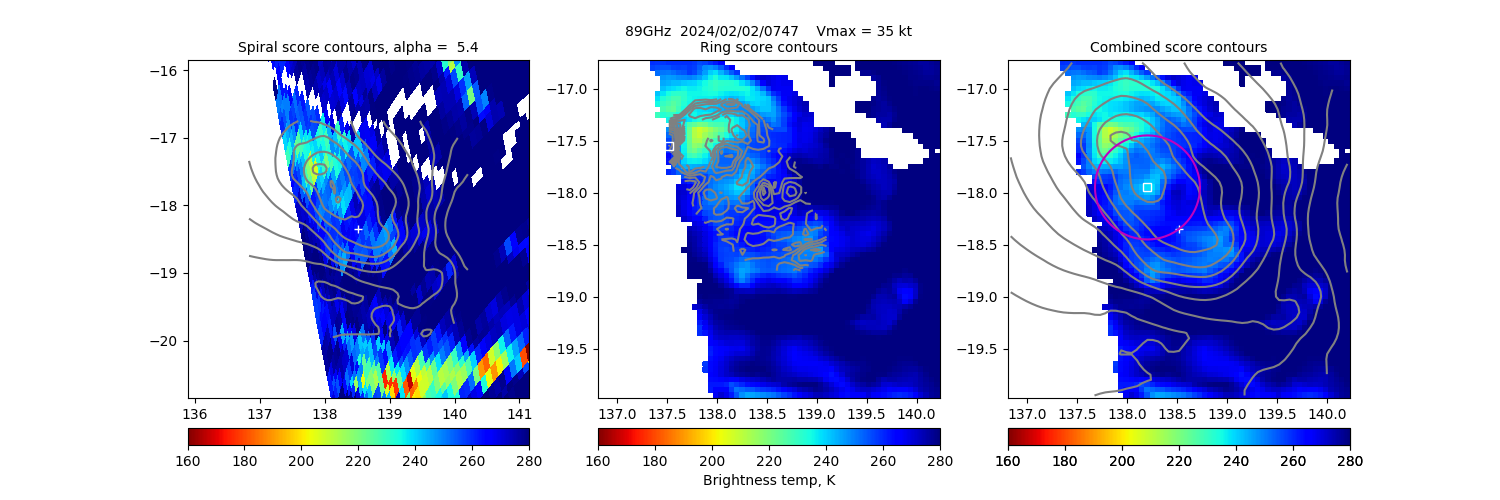
20240202 074705 SSMISF16 -18.0 138.2 N/A N/A N/A N/A N/A 35.0 -18.4 138.5 Analysis Plot
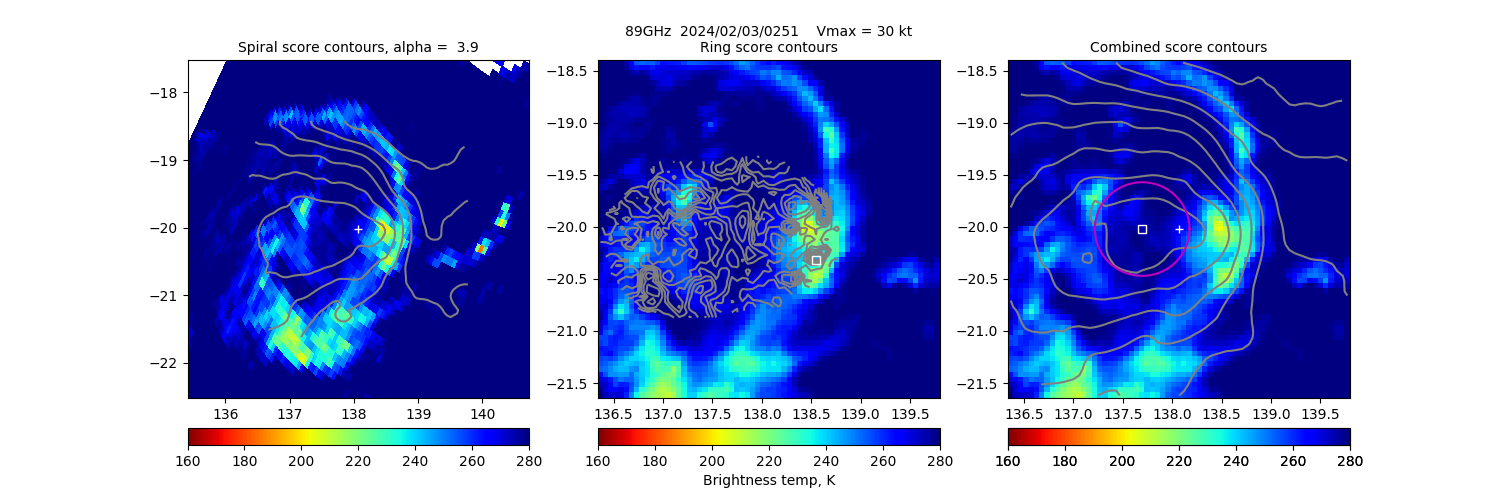
20240203 025104 GMI -20.0 137.7 N/A N/A N/A N/A N/A 30.0 -20.0 138.1 Analysis Plot
|
|
Legend - Overpass Date/Time are determined from satellite overpass of targeted TC (position determined from Best Track Lat/Lon position). Date is YYYYMMDD and time in HHMMSS (UTC). - Forecast (Best Track) and ARCHER positions (deg) of the TC center at overpass day/time. Positive/Negative: Latitude = North/South Hemisphere; Longitude = Eastern/Western Hemisphere. - BT Vmax is the concurrent ATCF Best Track (BT) wind speed intensity estimate (Vmax) value from either NOAA/National Hurricane Center (NHC) (North Atlantic and Northeast Pacific), NOAA/Central Pacific Hurricane Center (CPHC) (North-central Pacific) or Joint Typhoon Warning Center (JTWC) (Northwest Pacific, Indian Ocean, or Southwest Pacific). - Sat is the satellite descriptor providing the overpass. Currently the satellites used are the DMSP/SSMIS-16/17/18, GPM/GMI, and GCOM/AMSR2. - Ring Diam (km) indicates the estimated surface eyewall diameter if one is analyzed in the PMW imagery. The value listed is the average PMW-estimated inner eyewall edge diameter minus 10 km for eyewall slope. N/A indicates no appreciable eyewall is analyzed. - Ring Pct is the percentage of the analyzed "ring" (eyewall inner boundary) that is 1) colder than the eye Tb (the "hot spot" -- warmest eye pixel) by at least 20K, or 2) that is colder than 232K and colder than the eye Tb by 10K, whichever is greater. Values are red if Ring % ≤65,yellow/brown if Ring % ≤85 and green if Ring % >85. N/A indicates no appreciable eyewall is analyzed. A value over 85% is used in the intensity score by adding 15 points to it. - TbDiff is the difference between the warmest eye pixel and the warmest pixel on the eyewall. This value is used in the Intensity Score. N/A indicates no appreciable eyewall is analyzed. - Eye Score values are based on the strength and organization of the convective/eyewall signatures in the PMW imagery, and based on the ARCHER center location. They normally range from 0 to 100 with empirically-determined thresholds related to intensity (Vmax) in the "Meaning" column (≥20 suggests ≥65kts; ≥60 suggests ≥85kts). Scores are listed as negative, and not used by the ADT, when the NHC, CPHC, or JTWC Best Track Vmax is <55 kts in order to filter out occasional "false eye" cases. A value of -920 is used when the warmest eye pixel is <200K to prevent false positives; -930 means edge of overpass and <85% of eyewall is captured and therefore can't fully be analyzed. |