Tropical Depression 12P
|
Passive Microwave (PMW) Intensity Information Advanced Dvorak Technique Version 9.1 |
--Overpass-- --ARCHER-- Ring Ring Eye BT -Forecast-
Date Time Sat Lat Lon Diam Pct TbDiff Score Meaning Vmax Lat Lon
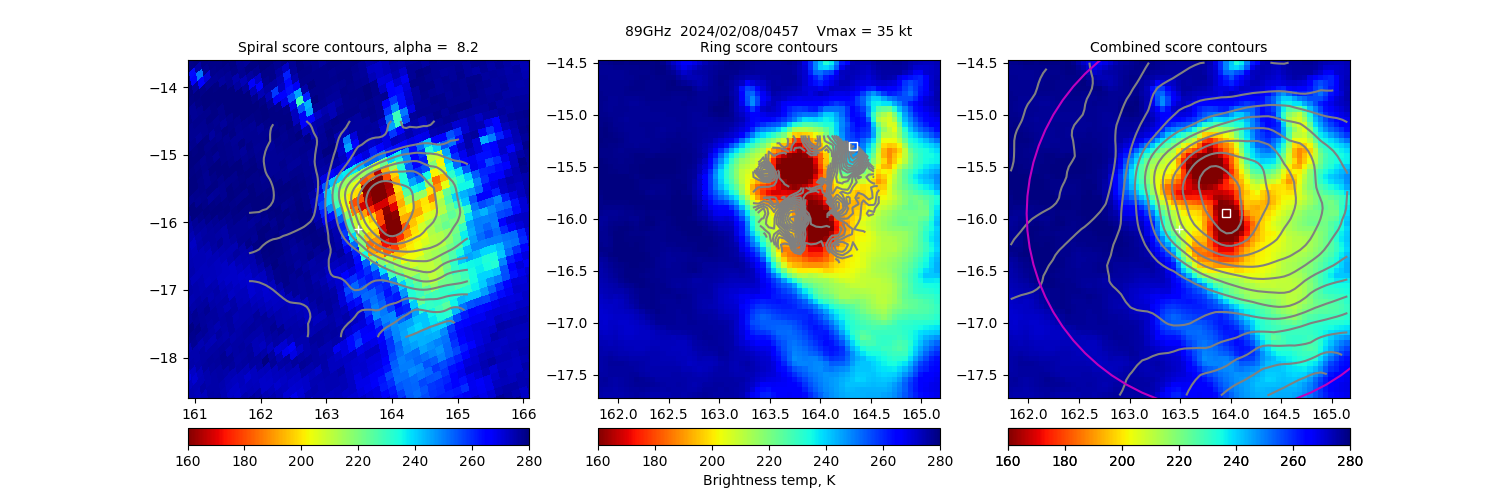
20240208 045728 SSMISF18 -15.9 164.0 N/A N/A N/A N/A N/A 35.0 -16.1 163.5 Analysis Plot
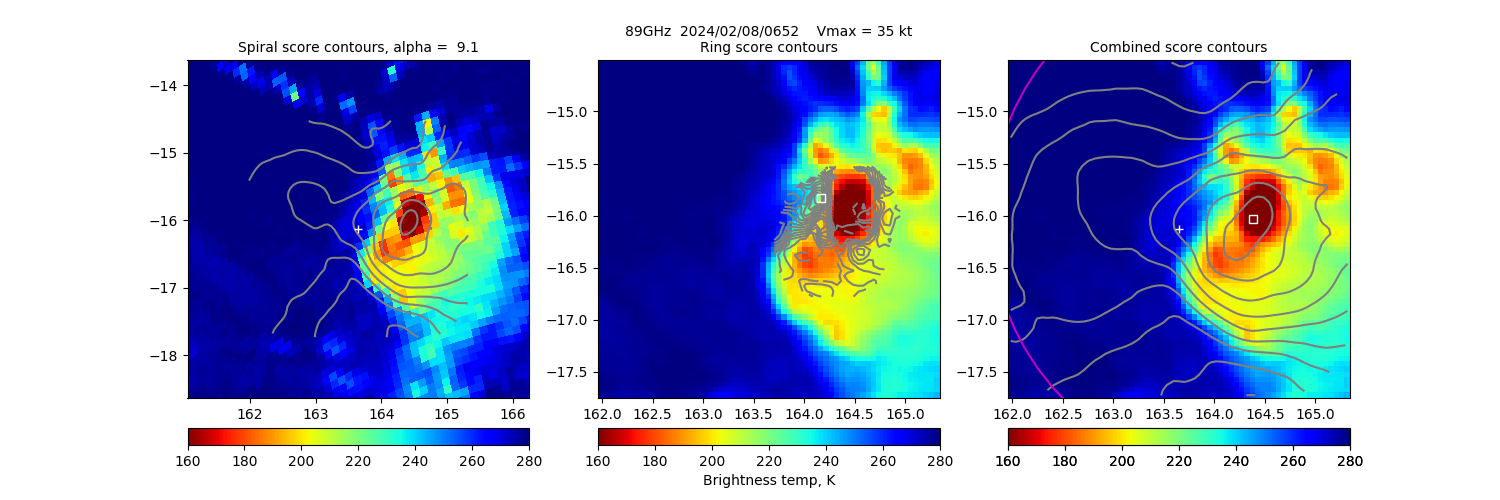
20240208 065226 SSMISF16 -16.0 164.4 N/A N/A N/A N/A N/A 35.0 -16.1 163.6 Analysis Plot
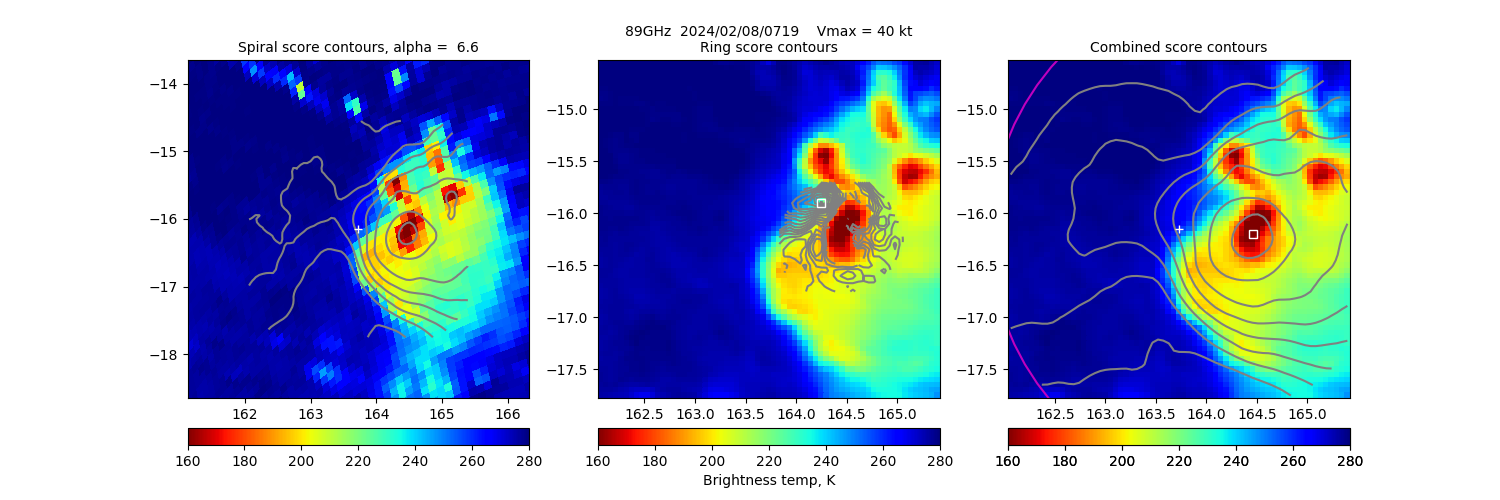
20240208 071921 SSMISF17 -16.2 164.5 N/A N/A N/A N/A N/A 40.0 -16.1 163.7 Analysis Plot
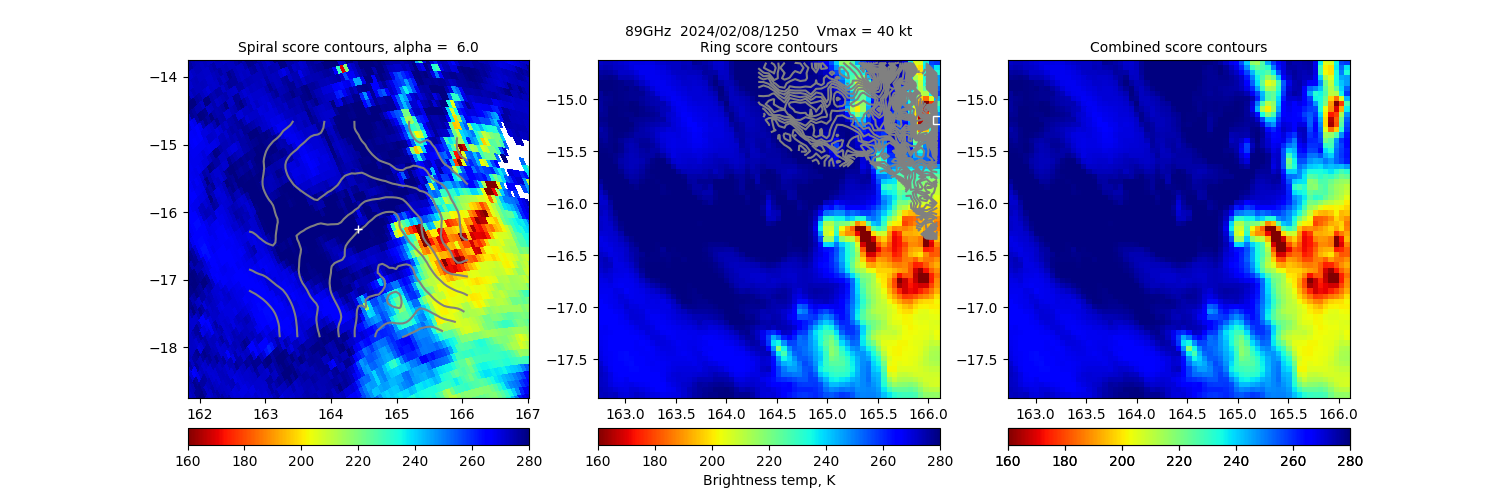
20240208 125016 GMI -15.1 166.1 N/A N/A N/A N/A N/A 40.0 -16.3 164.4 Analysis Plot
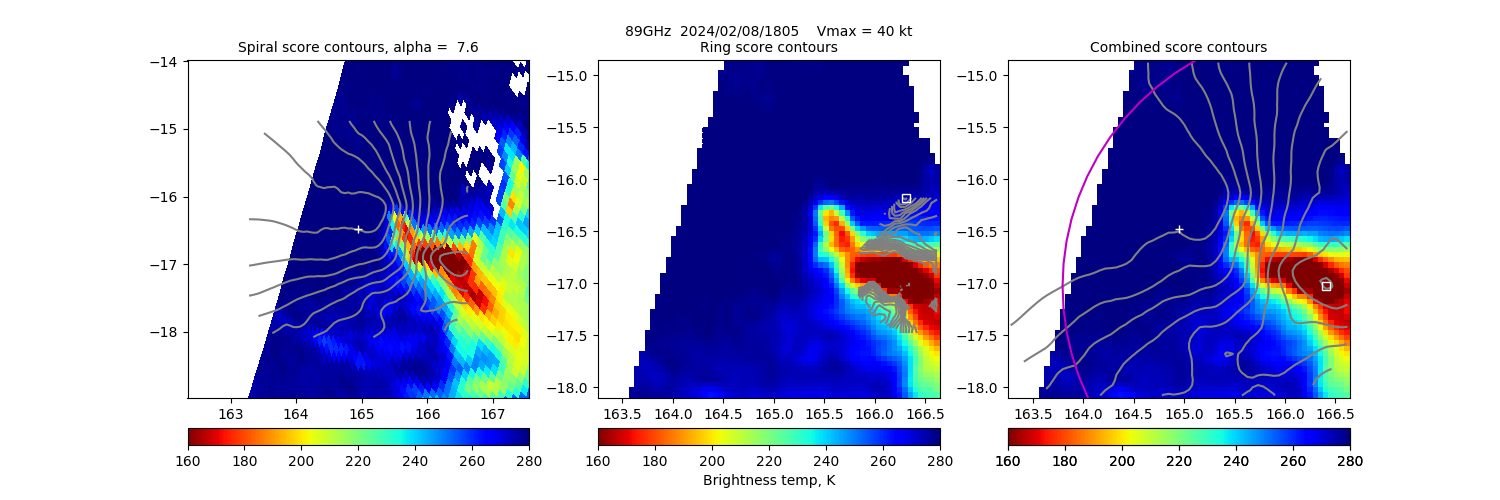
20240208 180522 SSMISF16 -17.0 166.4 N/A N/A N/A N/A N/A 40.0 -16.5 164.9 Analysis Plot
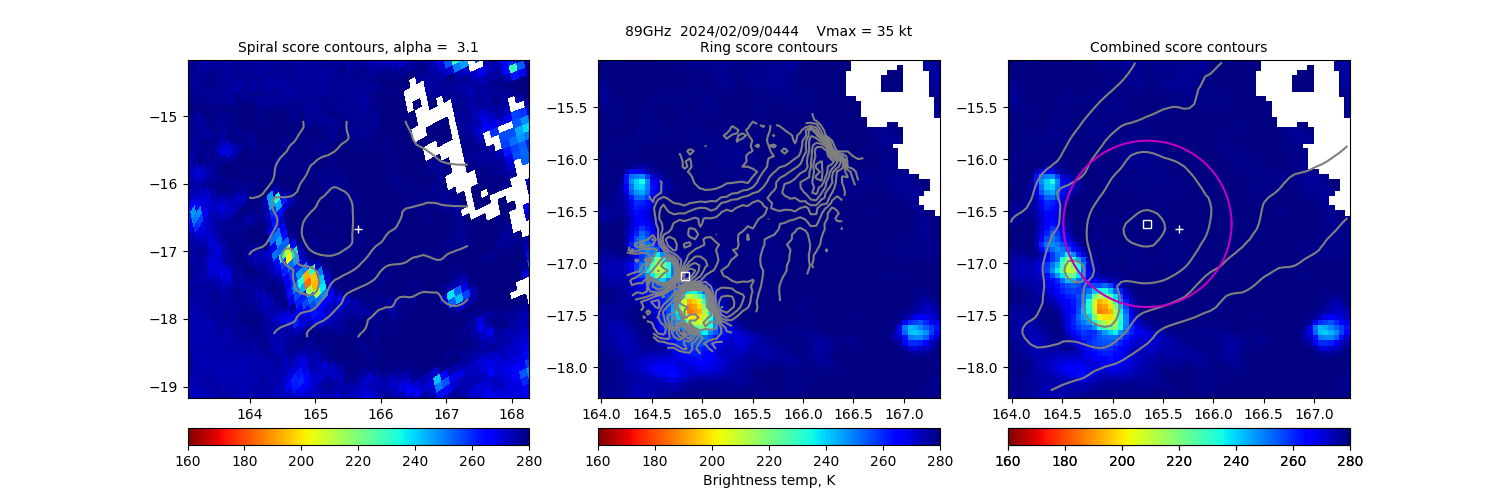
20240209 044400 SSMISF18 -16.6 165.4 168 4% 1.09 -1.09 N/A 35.0 -16.7 165.7 Analysis Plot
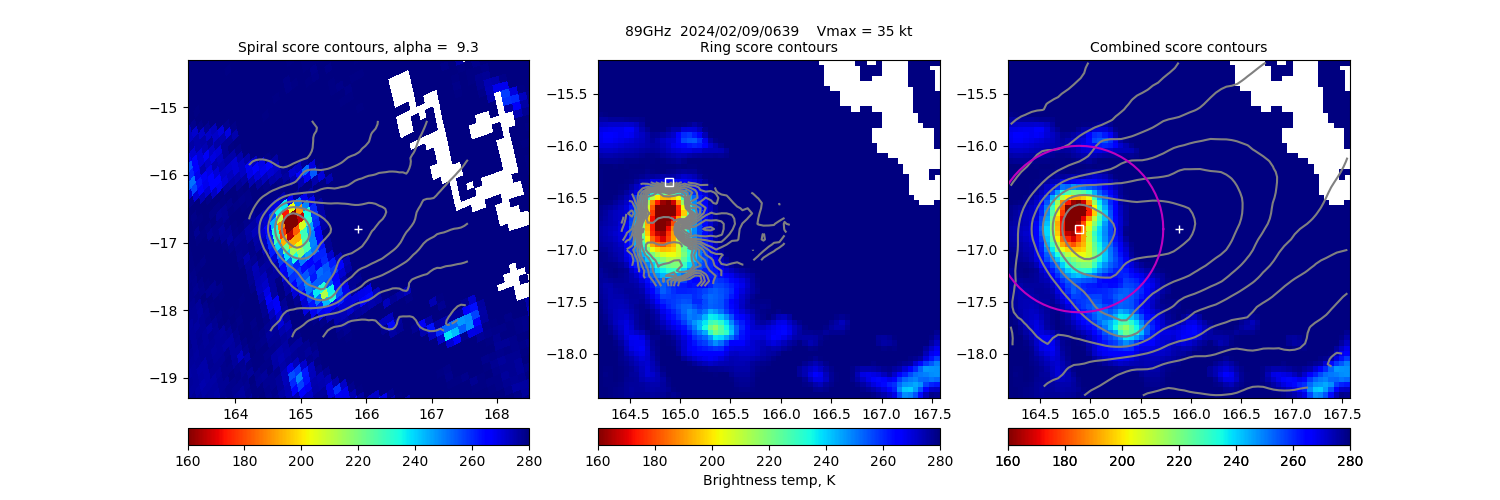
20240209 063901 SSMISF16 -16.8 164.9 N/A N/A N/A N/A N/A 35.0 -16.8 165.9 Analysis Plot
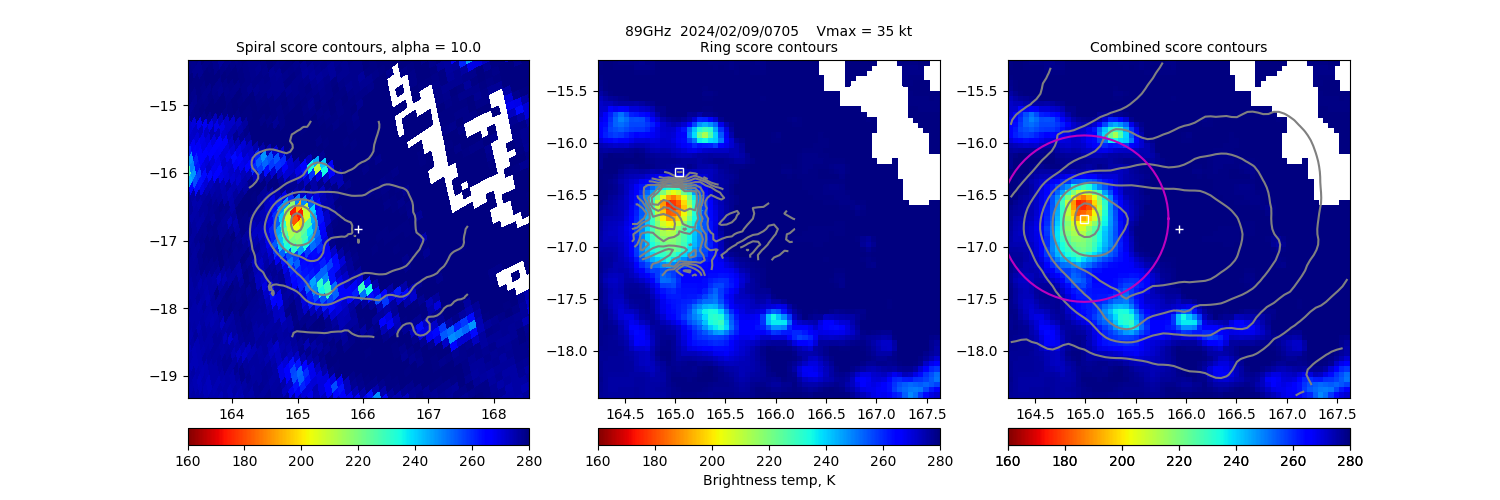
20240209 070531 SSMISF17 -16.7 165.0 N/A N/A N/A N/A N/A 35.0 -16.8 165.9 Analysis Plot
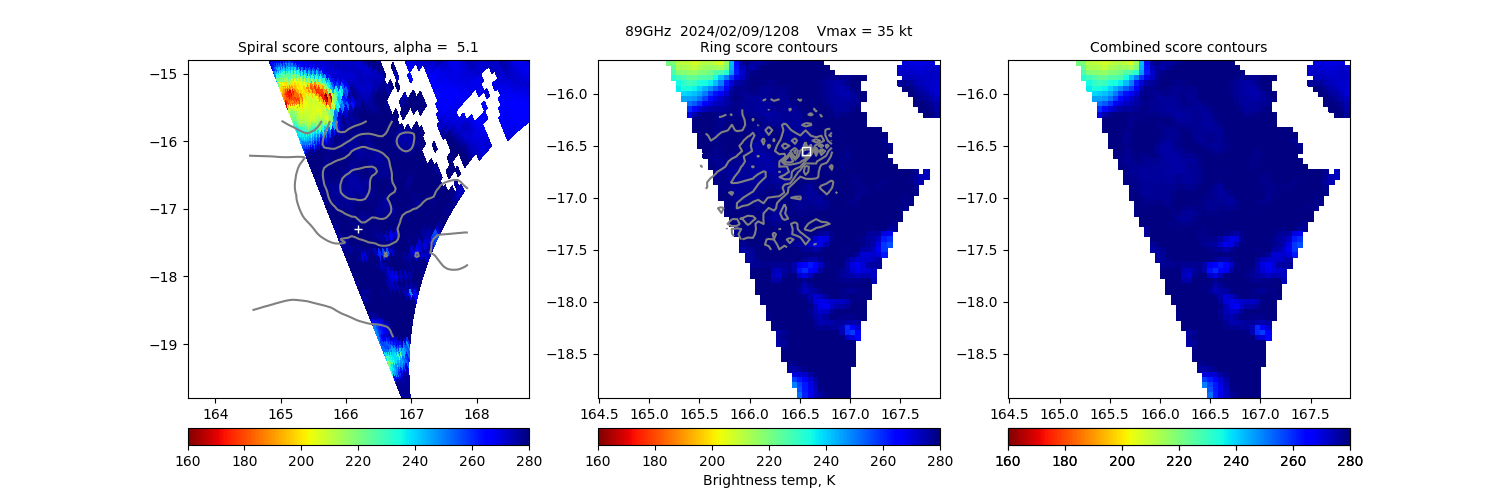
20240209 120827 GMI -16.7 166.2 N/A N/A N/A N/A N/A 35.0 -17.3 166.2 Analysis Plot
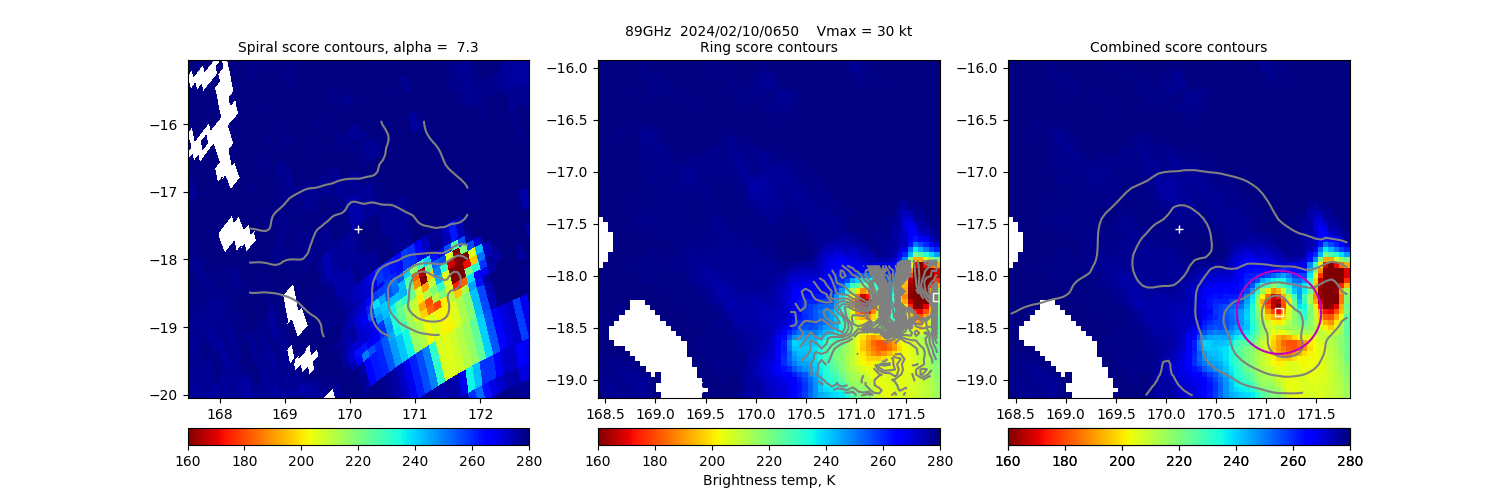
20240210 065039 SSMISF17 -18.4 171.1 N/A N/A N/A N/A N/A 30.0 -17.5 170.1 Analysis Plot
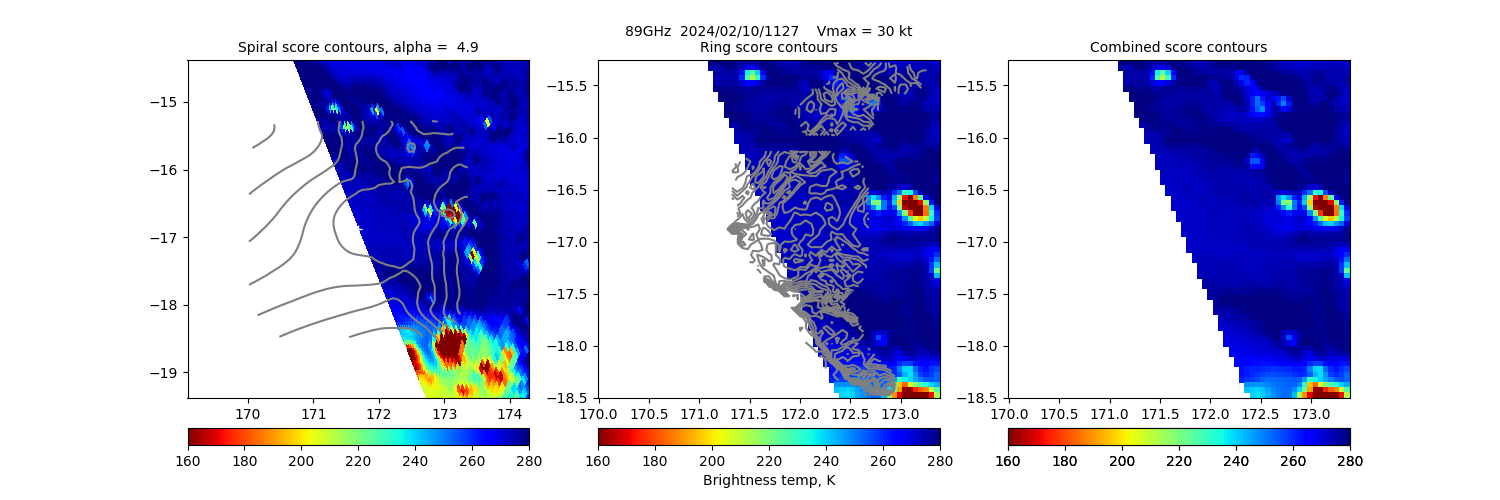
20240210 112702 GMI -18.5 172.4 N/A N/A N/A N/A N/A 30.0 -16.9 171.7 Analysis Plot
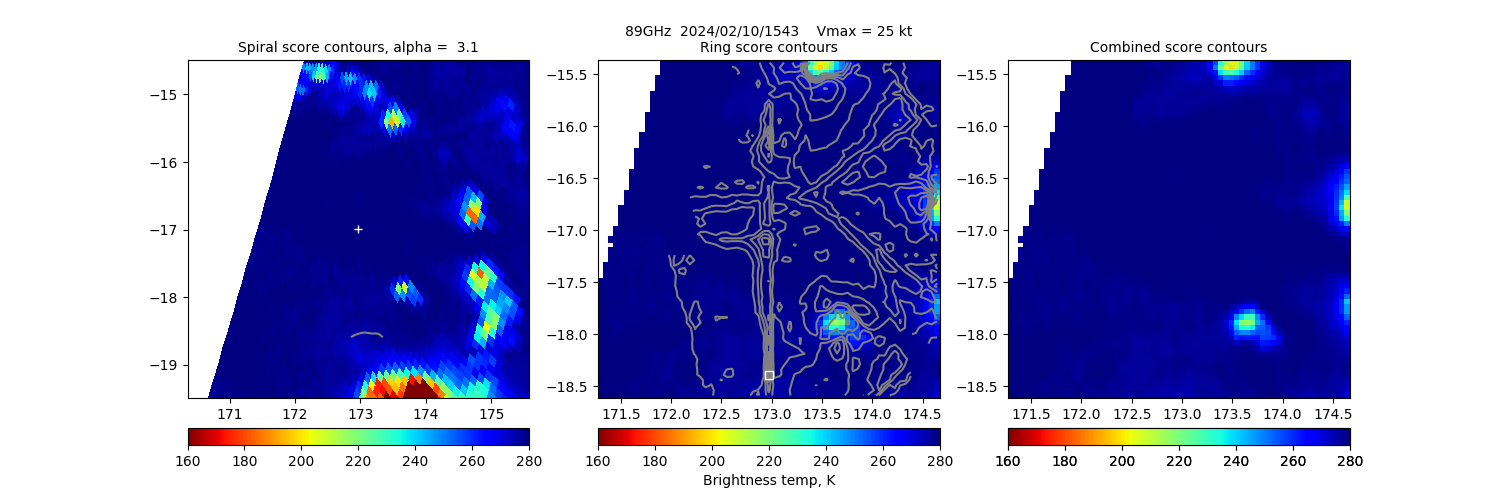
20240210 154317 SSMISF18 -18.6 173.0 N/A N/A N/A N/A N/A 25.0 -17.0 173.0 Analysis Plot
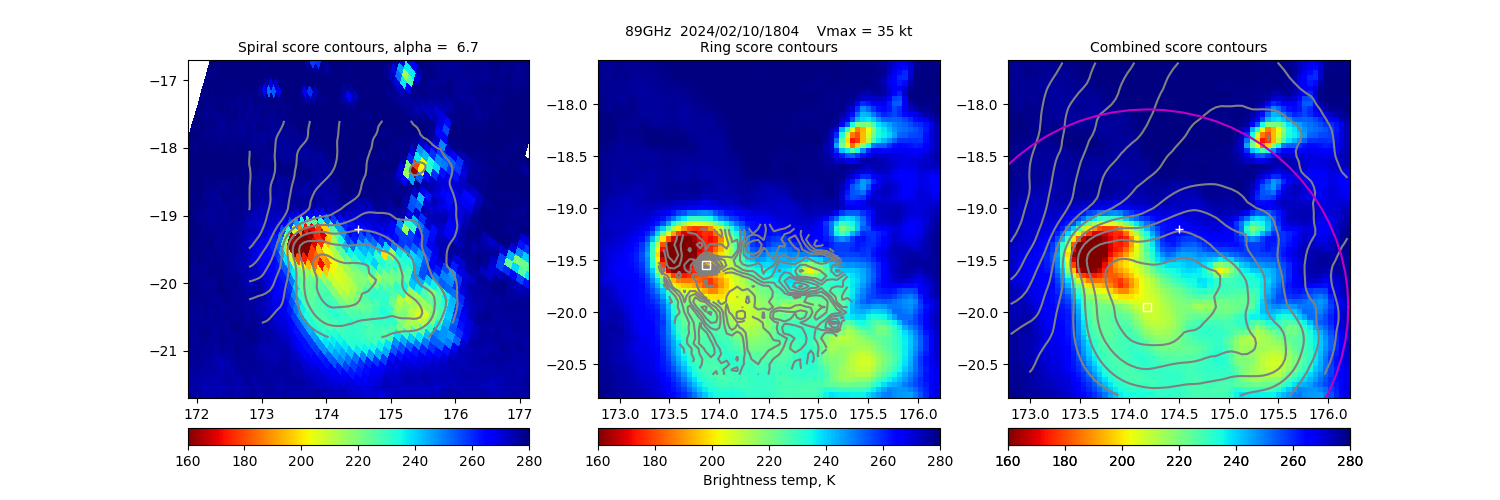
20240210 180416 SSMISF17 -20.0 174.2 N/A N/A N/A N/A N/A 35.0 -19.2 174.5 Analysis Plot
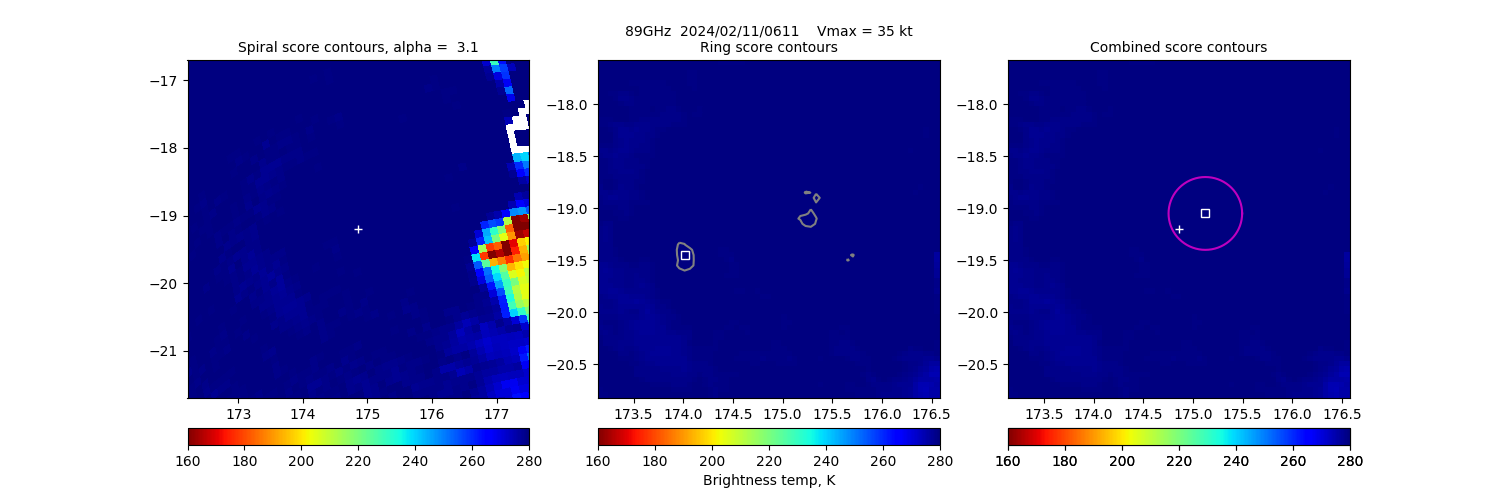
20240211 061101 SSMISF16 -19.0 175.1 68 N/A 2.88 -2.88 N/A 35.0 -19.2 174.9 Analysis Plot
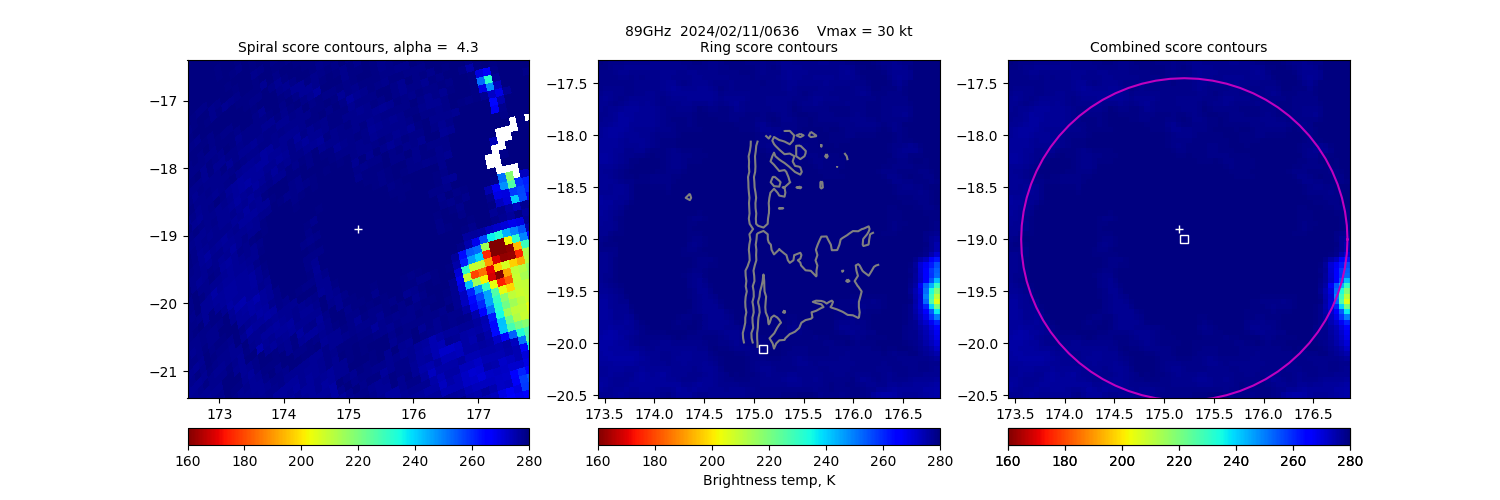
20240211 063658 SSMISF17 -19.0 175.2 N/A N/A N/A N/A N/A 30.0 -18.9 175.1 Analysis Plot
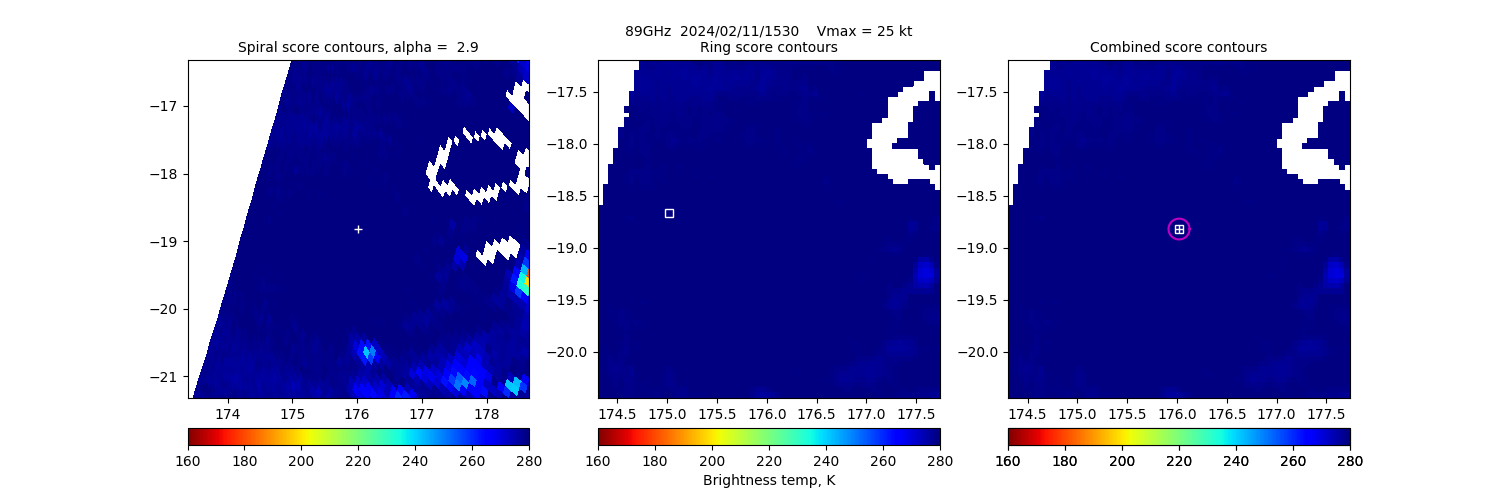
20240211 153017 SSMISF18 -18.8 176.0 12 N/A 0.54 -0.54 N/A 25.0 -18.8 176.0 Analysis Plot
|
|
Legend - Overpass Date/Time are determined from satellite overpass of targeted TC (position determined from Best Track Lat/Lon position). Date is YYYYMMDD and time in HHMMSS (UTC). - Forecast (Best Track) and ARCHER positions (deg) of the TC center at overpass day/time. Positive/Negative: Latitude = North/South Hemisphere; Longitude = Eastern/Western Hemisphere. - BT Vmax is the concurrent ATCF Best Track (BT) wind speed intensity estimate (Vmax) value from either NOAA/National Hurricane Center (NHC) (North Atlantic and Northeast Pacific), NOAA/Central Pacific Hurricane Center (CPHC) (North-central Pacific) or Joint Typhoon Warning Center (JTWC) (Northwest Pacific, Indian Ocean, or Southwest Pacific). - Sat is the satellite descriptor providing the overpass. Currently the satellites used are the DMSP/SSMIS-16/17/18, GPM/GMI, and GCOM/AMSR2. - Ring Diam (km) indicates the estimated surface eyewall diameter if one is analyzed in the PMW imagery. The value listed is the average PMW-estimated inner eyewall edge diameter minus 10 km for eyewall slope. N/A indicates no appreciable eyewall is analyzed. - Ring Pct is the percentage of the analyzed "ring" (eyewall inner boundary) that is 1) colder than the eye Tb (the "hot spot" -- warmest eye pixel) by at least 20K, or 2) that is colder than 232K and colder than the eye Tb by 10K, whichever is greater. Values are red if Ring % ≤65,yellow/brown if Ring % ≤85 and green if Ring % >85. N/A indicates no appreciable eyewall is analyzed. A value over 85% is used in the intensity score by adding 15 points to it. - TbDiff is the difference between the warmest eye pixel and the warmest pixel on the eyewall. This value is used in the Intensity Score. N/A indicates no appreciable eyewall is analyzed. - Eye Score values are based on the strength and organization of the convective/eyewall signatures in the PMW imagery, and based on the ARCHER center location. They normally range from 0 to 100 with empirically-determined thresholds related to intensity (Vmax) in the "Meaning" column (≥20 suggests ≥65kts; ≥60 suggests ≥85kts). Scores are listed as negative, and not used by the ADT, when the NHC, CPHC, or JTWC Best Track Vmax is <55 kts in order to filter out occasional "false eye" cases. A value of -920 is used when the warmest eye pixel is <200K to prevent false positives; -930 means edge of overpass and <85% of eyewall is captured and therefore can't fully be analyzed. |