|
||
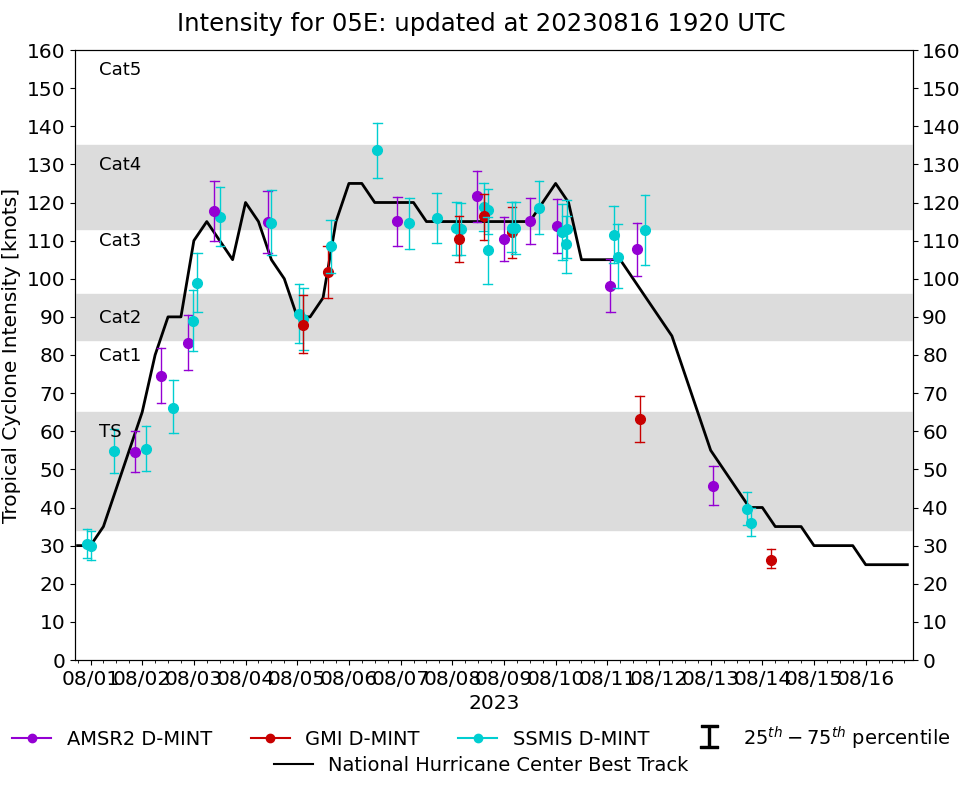 |
D-MINT HISTORY FILE for 2023_05E
| Date | Time | MW Sensor | MSLP | Vmax (30th-70th percentile average) | Vmax 25th percentile | Vmax 75th percentile | Image |
| 20230814 | 0406 UTC | GMI | 1008 hPa | 26 kts | 24 kts | 29 kts |  |
| 20230813 | 1844 UTC | SSMISF17 | 1005 hPa | 36 kts | 32 kts | 40 kts |  |
| 20230813 | 1646 UTC | SSMISF18 | 1002 hPa | 40 kts | 35 kts | 44 kts |  |
| 20230813 | 0117 UTC | AMSR2 | 999 hPa | 46 kts | 41 kts | 51 kts |  |
| 20230811 | 1725 UTC | SSMISF16 | 960 hPa | 113 kts | 104 kts | 122 kts |  |
| 20230811 | 1501 UTC | GMI | 984 hPa | 63 kts | 57 kts | 69 kts |  |
| 20230811 | 1341 UTC | AMSR2 | 955 hPa | 108 kts | 101 kts | 115 kts |  |
| 20230811 | 0449 UTC | SSMISF16 | 960 hPa | 106 kts | 98 kts | 114 kts |  |
| 20230811 | 0257 UTC | SSMISF18 | 957 hPa | 112 kts | 104 kts | 119 kts |  |
| 20230811 | 0127 UTC | AMSR2 | 964 hPa | 98 kts | 91 kts | 105 kts |  |
| 20230810 | 0508 UTC | SSMISF17 | 949 hPa | 113 kts | 105 kts | 121 kts |  |
| 20230810 | 0502 UTC | SSMISF16 | 954 hPa | 109 kts | 101 kts | 116 kts |  |
| 20230810 | 0308 UTC | SSMISF18 | 954 hPa | 112 kts | 105 kts | 120 kts |  |
| 20230810 | 0043 UTC | AMSR2 | 946 hPa | 114 kts | 107 kts | 121 kts |  |
| 20230809 | 1611 UTC | SSMISF16 | 944 hPa | 119 kts | 112 kts | 126 kts |  |
| 20230809 | 1215 UTC | AMSR2 | 954 hPa | 115 kts | 109 kts | 121 kts |  |
| 20230809 | 0522 UTC | SSMISF17 | 954 hPa | 113 kts | 106 kts | 120 kts |  |
| 20230809 | 0351 UTC | GMI | 953 hPa | 112 kts | 105 kts | 119 kts |  |
| 20230809 | 0334 UTC | SSMISF16 | 952 hPa | 113 kts | 107 kts | 120 kts |  |
| 20230809 | 0000 UTC | AMSR2 | 955 hPa | 110 kts | 105 kts | 116 kts |  |
| 20230808 | 1631 UTC | SSMISF17 | 956 hPa | 118 kts | 112 kts | 124 kts |  |
| 20230808 | 1624 UTC | SSMISF16 | 957 hPa | 107 kts | 99 kts | 116 kts |  |
| 20230808 | 1436 UTC | GMI | 956 hPa | 116 kts | 110 kts | 122 kts |  |
| 20230808 | 1431 UTC | SSMISF18 | 955 hPa | 119 kts | 112 kts | 125 kts |  |
| 20230808 | 1133 UTC | AMSR2 | 955 hPa | 122 kts | 115 kts | 128 kts |  |
| 20230808 | 0354 UTC | SSMISF17 | 959 hPa | 113 kts | 106 kts | 120 kts |  |
| 20230808 | 0306 UTC | GMI | 957 hPa | 110 kts | 104 kts | 116 kts |  |
| 20230808 | 0154 UTC | SSMISF18 | 959 hPa | 113 kts | 106 kts | 120 kts |  |
| 20230807 | 1644 UTC | SSMISF17 | 955 hPa | 116 kts | 109 kts | 123 kts |  |
| 20230807 | 0407 UTC | SSMISF17 | 953 hPa | 115 kts | 108 kts | 121 kts |  |
| 20230806 | 2234 UTC | AMSR2 | 960 hPa | 115 kts | 108 kts | 122 kts |  |
| 20230806 | 1315 UTC | SSMISF18 | 948 hPa | 134 kts | 126 kts | 141 kts |  |
| 20230805 | 1529 UTC | SSMISF17 | 964 hPa | 109 kts | 102 kts | 116 kts |  |
| 20230805 | 1406 UTC | GMI | 967 hPa | 102 kts | 95 kts | 109 kts |  |
| 20230805 | 0253 UTC | SSMISF17 | 969 hPa | 89 kts | 81 kts | 98 kts |  |
| 20230805 | 0241 UTC | GMI | 974 hPa | 88 kts | 80 kts | 96 kts |  |
| 20230805 | 0052 UTC | SSMISF18 | 980 hPa | 91 kts | 83 kts | 99 kts |  |
| 20230804 | 1200 UTC | SSMISF18 | 957 hPa | 115 kts | 106 kts | 123 kts |  |
| 20230804 | 1017 UTC | AMSR2 | 958 hPa | 115 kts | 107 kts | 123 kts |  |
| 20230803 | 1212 UTC | SSMISF18 | 958 hPa | 116 kts | 109 kts | 124 kts |  |
| 20230803 | 0933 UTC | AMSR2 | 959 hPa | 118 kts | 110 kts | 126 kts |  |
| 20230803 | 0139 UTC | SSMISF17 | 969 hPa | 99 kts | 91 kts | 107 kts |  |
| 20230802 | 2337 UTC | SSMISF18 | 972 hPa | 89 kts | 81 kts | 97 kts |  |
| 20230802 | 2120 UTC | AMSR2 | 976 hPa | 83 kts | 76 kts | 91 kts |  |
| 20230802 | 1428 UTC | SSMISF17 | 988 hPa | 66 kts | 59 kts | 73 kts |  |
| 20230802 | 0851 UTC | AMSR2 | 987 hPa | 74 kts | 68 kts | 82 kts |  |
| 20230802 | 0153 UTC | SSMISF17 | 990 hPa | 55 kts | 49 kts | 61 kts |  |
| 20230801 | 2037 UTC | AMSR2 | 1000 hPa | 55 kts | 49 kts | 60 kts |  |
| 20230801 | 1057 UTC | SSMISF18 | 996 hPa | 55 kts | 49 kts | 61 kts |  |
| 20230801 | 0015 UTC | SSMISF16 | 1009 hPa | 30 kts | 26 kts | 34 kts |  |
| 20230731 | 2222 UTC | SSMISF18 | 1007 hPa | 30 kts | 27 kts | 34 kts |  |