|
||
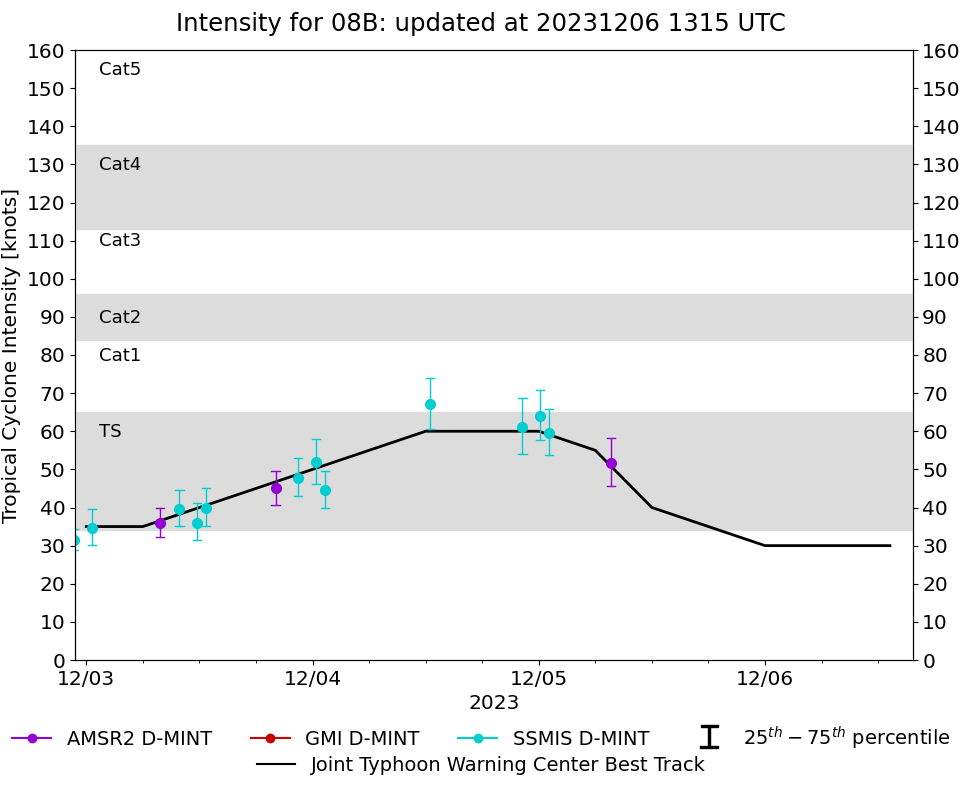 |
D-MINT HISTORY FILE for 2023_08B
| Date | Time | MW Sensor | MSLP | Vmax (30th-70th percentile average) | Vmax 25th percentile | Vmax 75th percentile | Image |
| 20231205 | 0740 UTC | AMSR2 | 986 hPa | 52 kts | 46 kts | 58 kts |  |
| 20231205 | 0104 UTC | SSMISF17 | 979 hPa | 60 kts | 54 kts | 66 kts |  |
| 20231205 | 0009 UTC | SSMISF16 | 978 hPa | 64 kts | 58 kts | 71 kts |  |
| 20231204 | 2216 UTC | SSMISF18 | 978 hPa | 61 kts | 54 kts | 69 kts |  |
| 20231204 | 1229 UTC | SSMISF17 | 976 hPa | 67 kts | 61 kts | 74 kts |  |
| 20231204 | 0119 UTC | SSMISF17 | 987 hPa | 45 kts | 40 kts | 50 kts |  |
| 20231204 | 0022 UTC | SSMISF16 | 979 hPa | 52 kts | 46 kts | 58 kts |  |
| 20231203 | 2229 UTC | SSMISF18 | 987 hPa | 48 kts | 43 kts | 53 kts |  |
| 20231203 | 2005 UTC | AMSR2 | 992 hPa | 45 kts | 41 kts | 49 kts |  |
| 20231203 | 1241 UTC | SSMISF17 | 999 hPa | 40 kts | 35 kts | 45 kts |  |
| 20231203 | 1146 UTC | SSMISF16 | 999 hPa | 36 kts | 31 kts | 41 kts |  |
| 20231203 | 0953 UTC | SSMISF18 | 1000 hPa | 40 kts | 35 kts | 44 kts |  |
| 20231203 | 0750 UTC | AMSR2 | 1001 hPa | 36 kts | 32 kts | 40 kts |  |
| 20231203 | 0036 UTC | SSMISF16 | 995 hPa | 35 kts | 30 kts | 40 kts |  |
| 20231202 | 2243 UTC | SSMISF18 | 999 hPa | 31 kts | 29 kts | 34 kts |  |
| 20231202 | 1255 UTC | SSMISF17 | 999 hPa | 32 kts | 28 kts | 37 kts |  |
| 20231202 | 1158 UTC | SSMISF16 | 1002 hPa | 28 kts | 25 kts | 31 kts |  |
| 20231201 | 2019 UTC | AMSR2 | 1004 hPa | 23 kts | 21 kts | 25 kts |  |