|
||

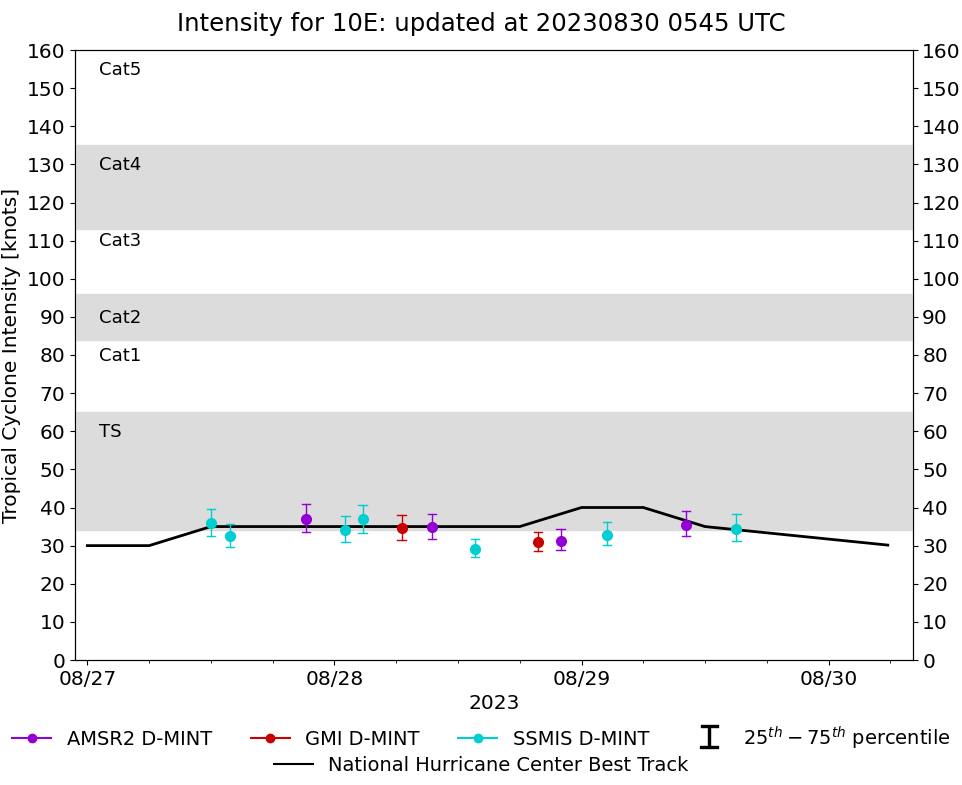 |
D-MINT HISTORY FILE for 2023_10E
| Date | Time | MW Sensor | MSLP | Vmax (30th-70th percentile average) | Vmax 25th percentile | Vmax 75th percentile | Image |
| 20230829 | 1503 UTC | SSMISF17 | 1004 hPa | 34 kts | 31 kts | 38 kts | 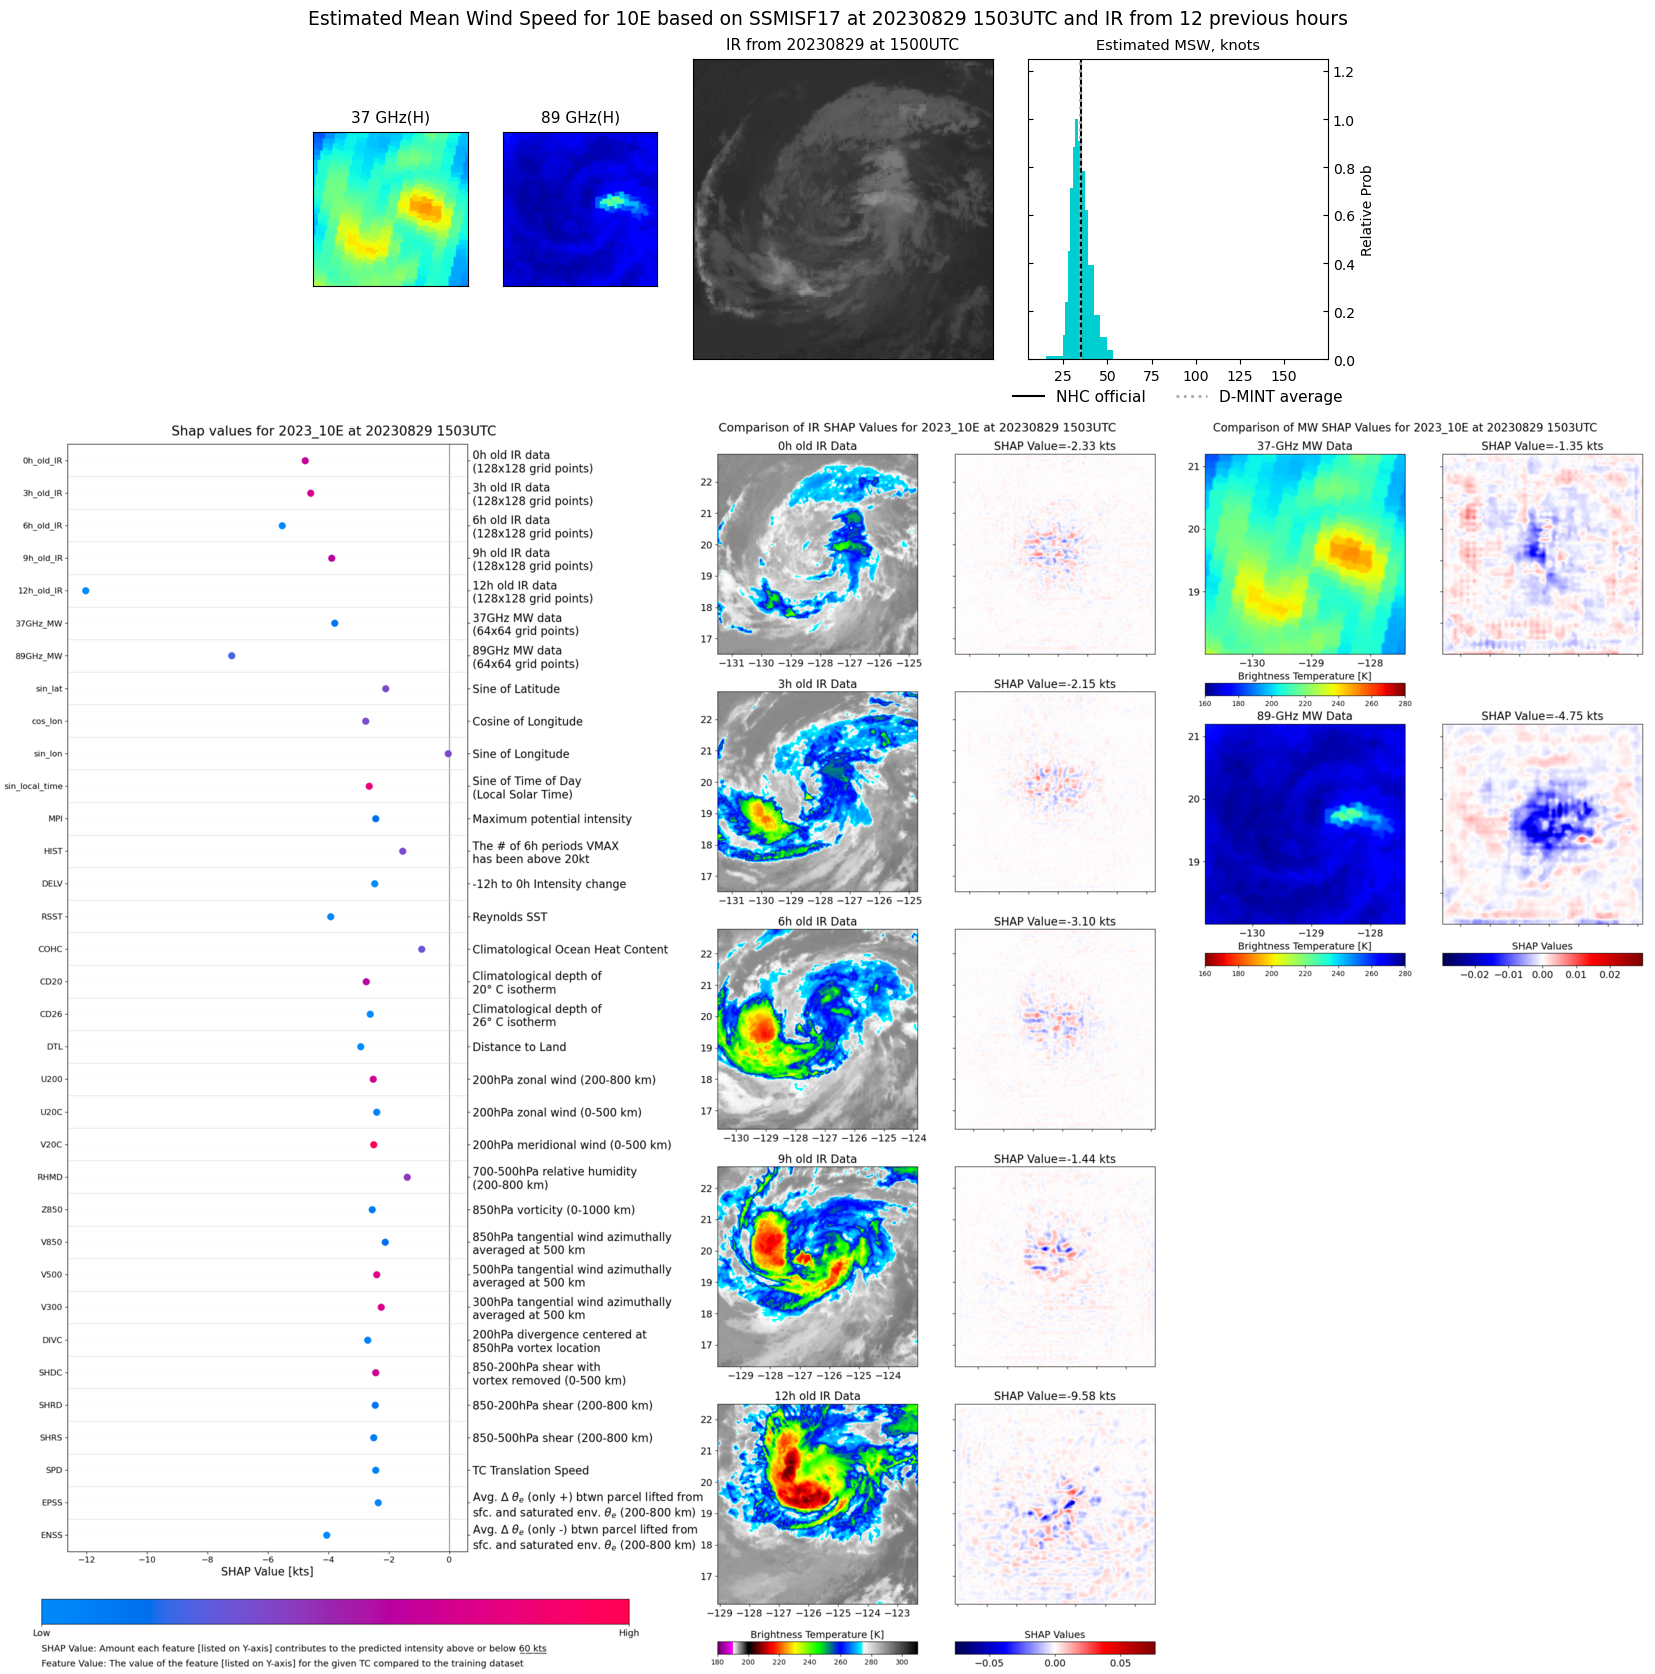 |
| 20230829 | 1009 UTC | AMSR2 | 1002 hPa | 35 kts | 32 kts | 39 kts |  |
| 20230829 | 0230 UTC | SSMISF17 | 1003 hPa | 33 kts | 30 kts | 36 kts | 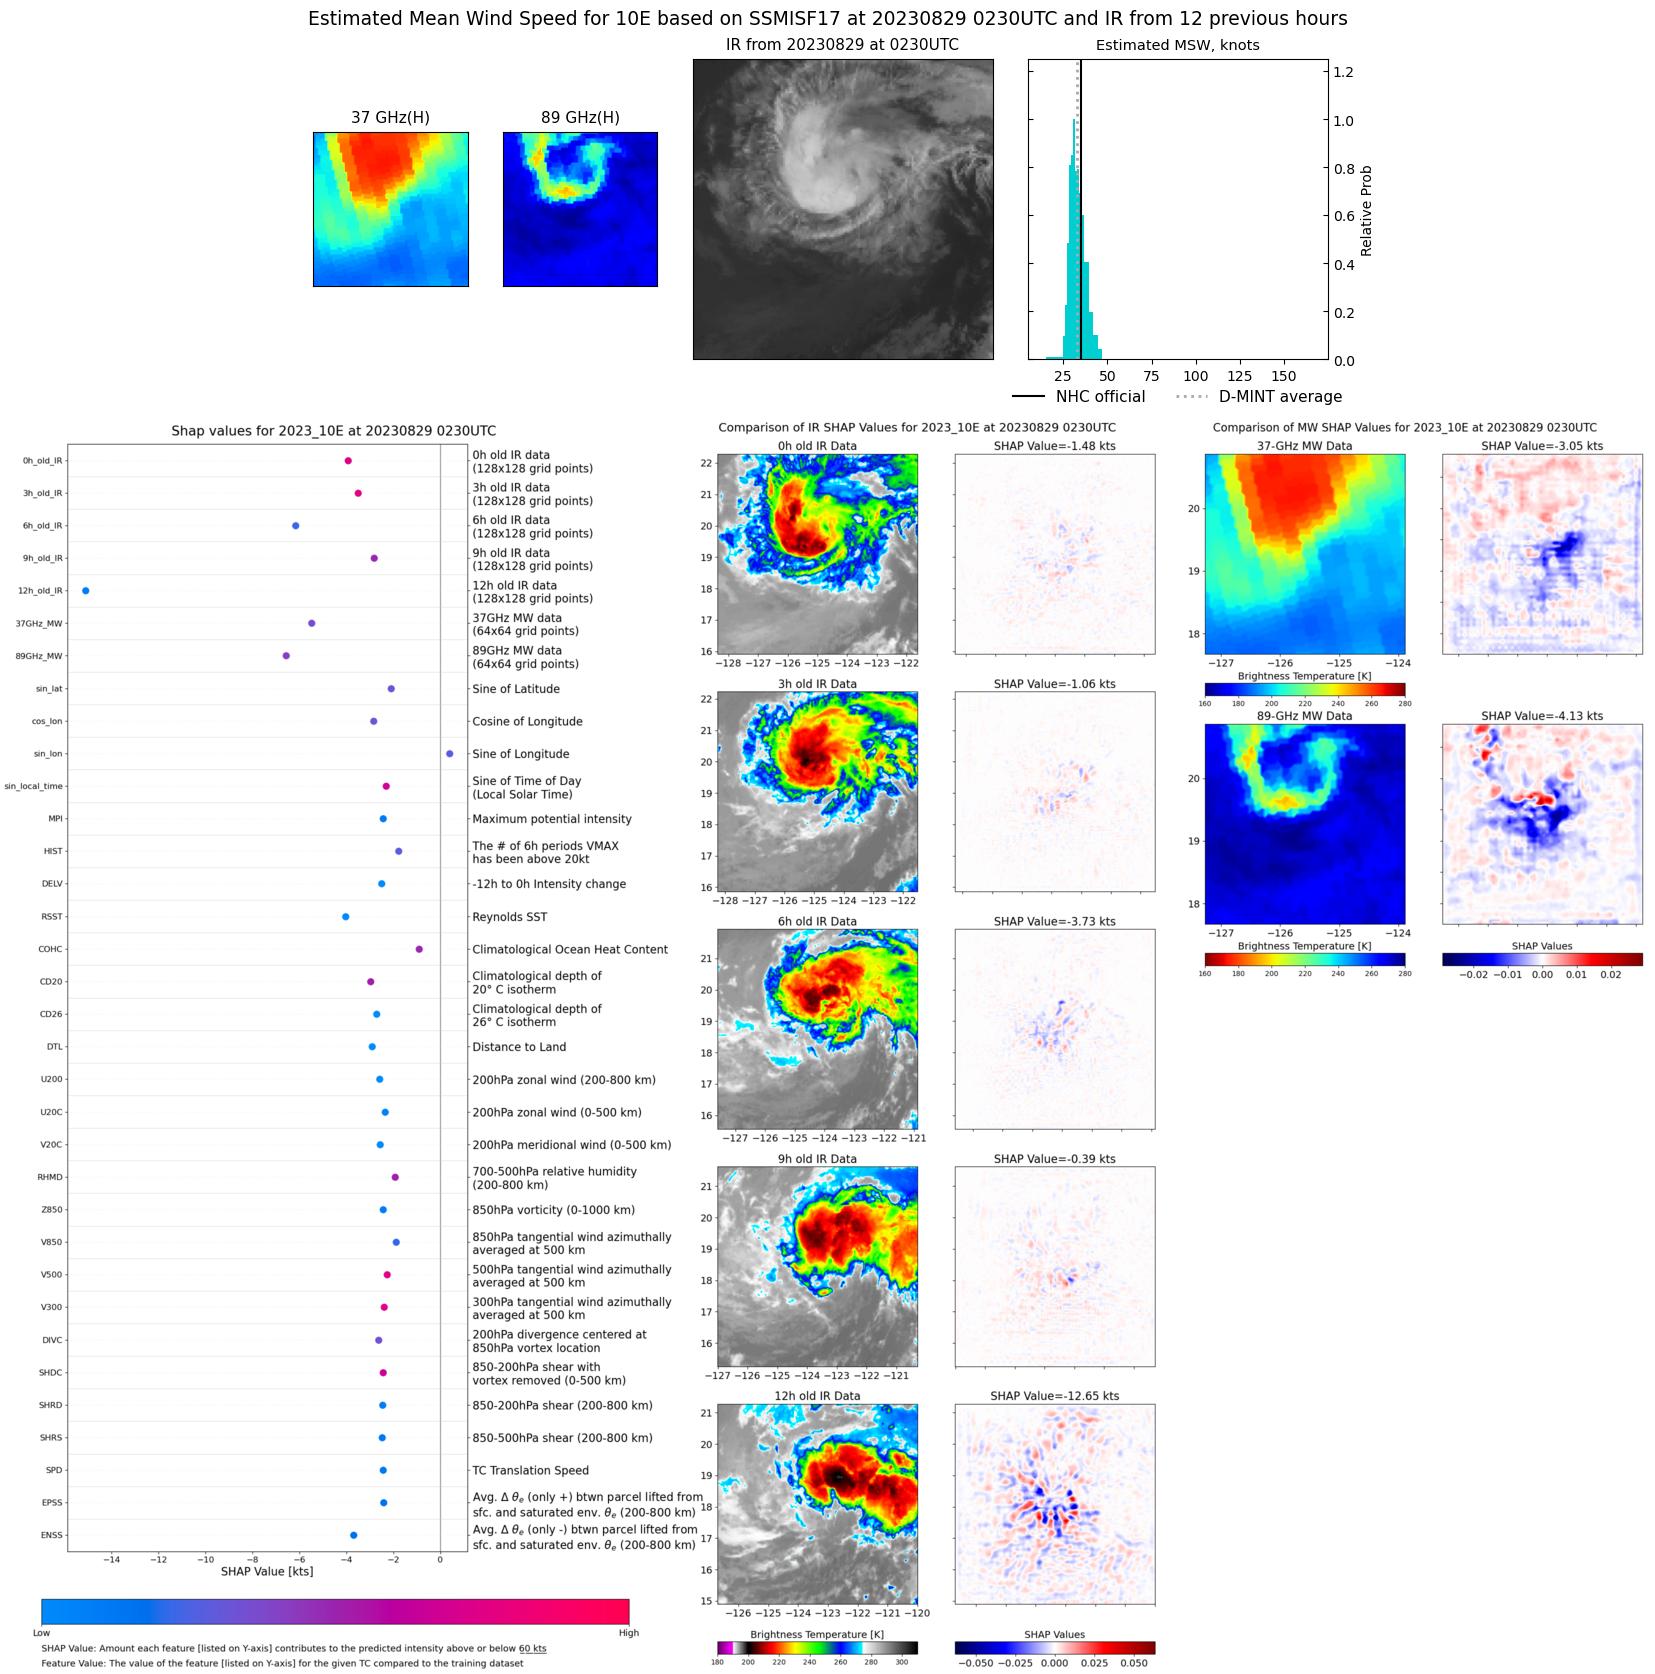 |
| 20230828 | 2158 UTC | AMSR2 | 1000 hPa | 31 kts | 29 kts | 34 kts | 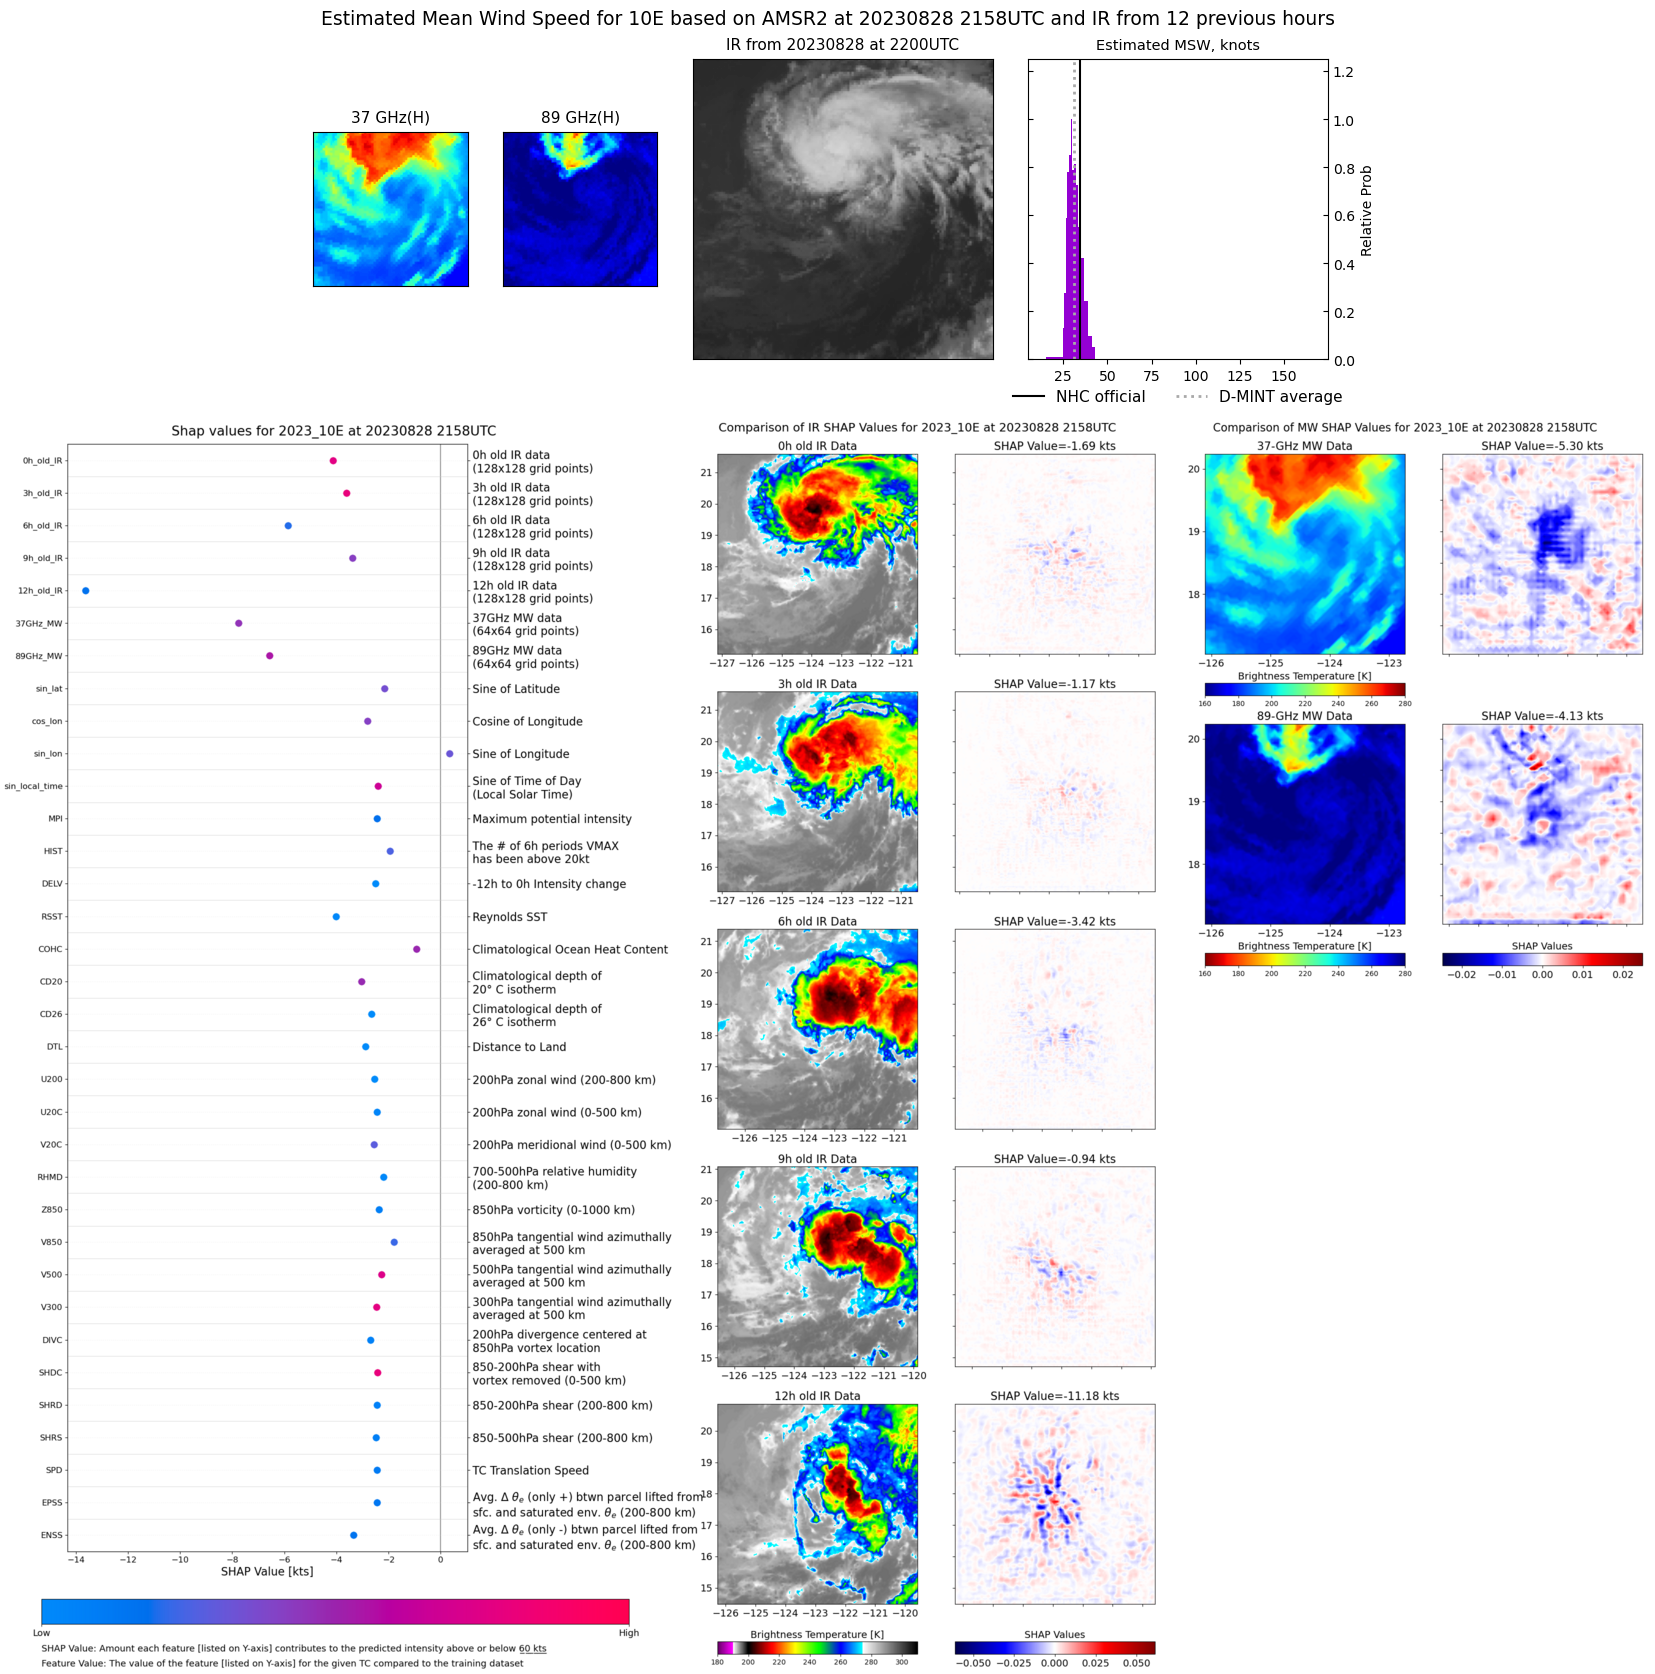 |
| 20230828 | 1946 UTC | GMI | 1001 hPa | 31 kts | 29 kts | 34 kts | 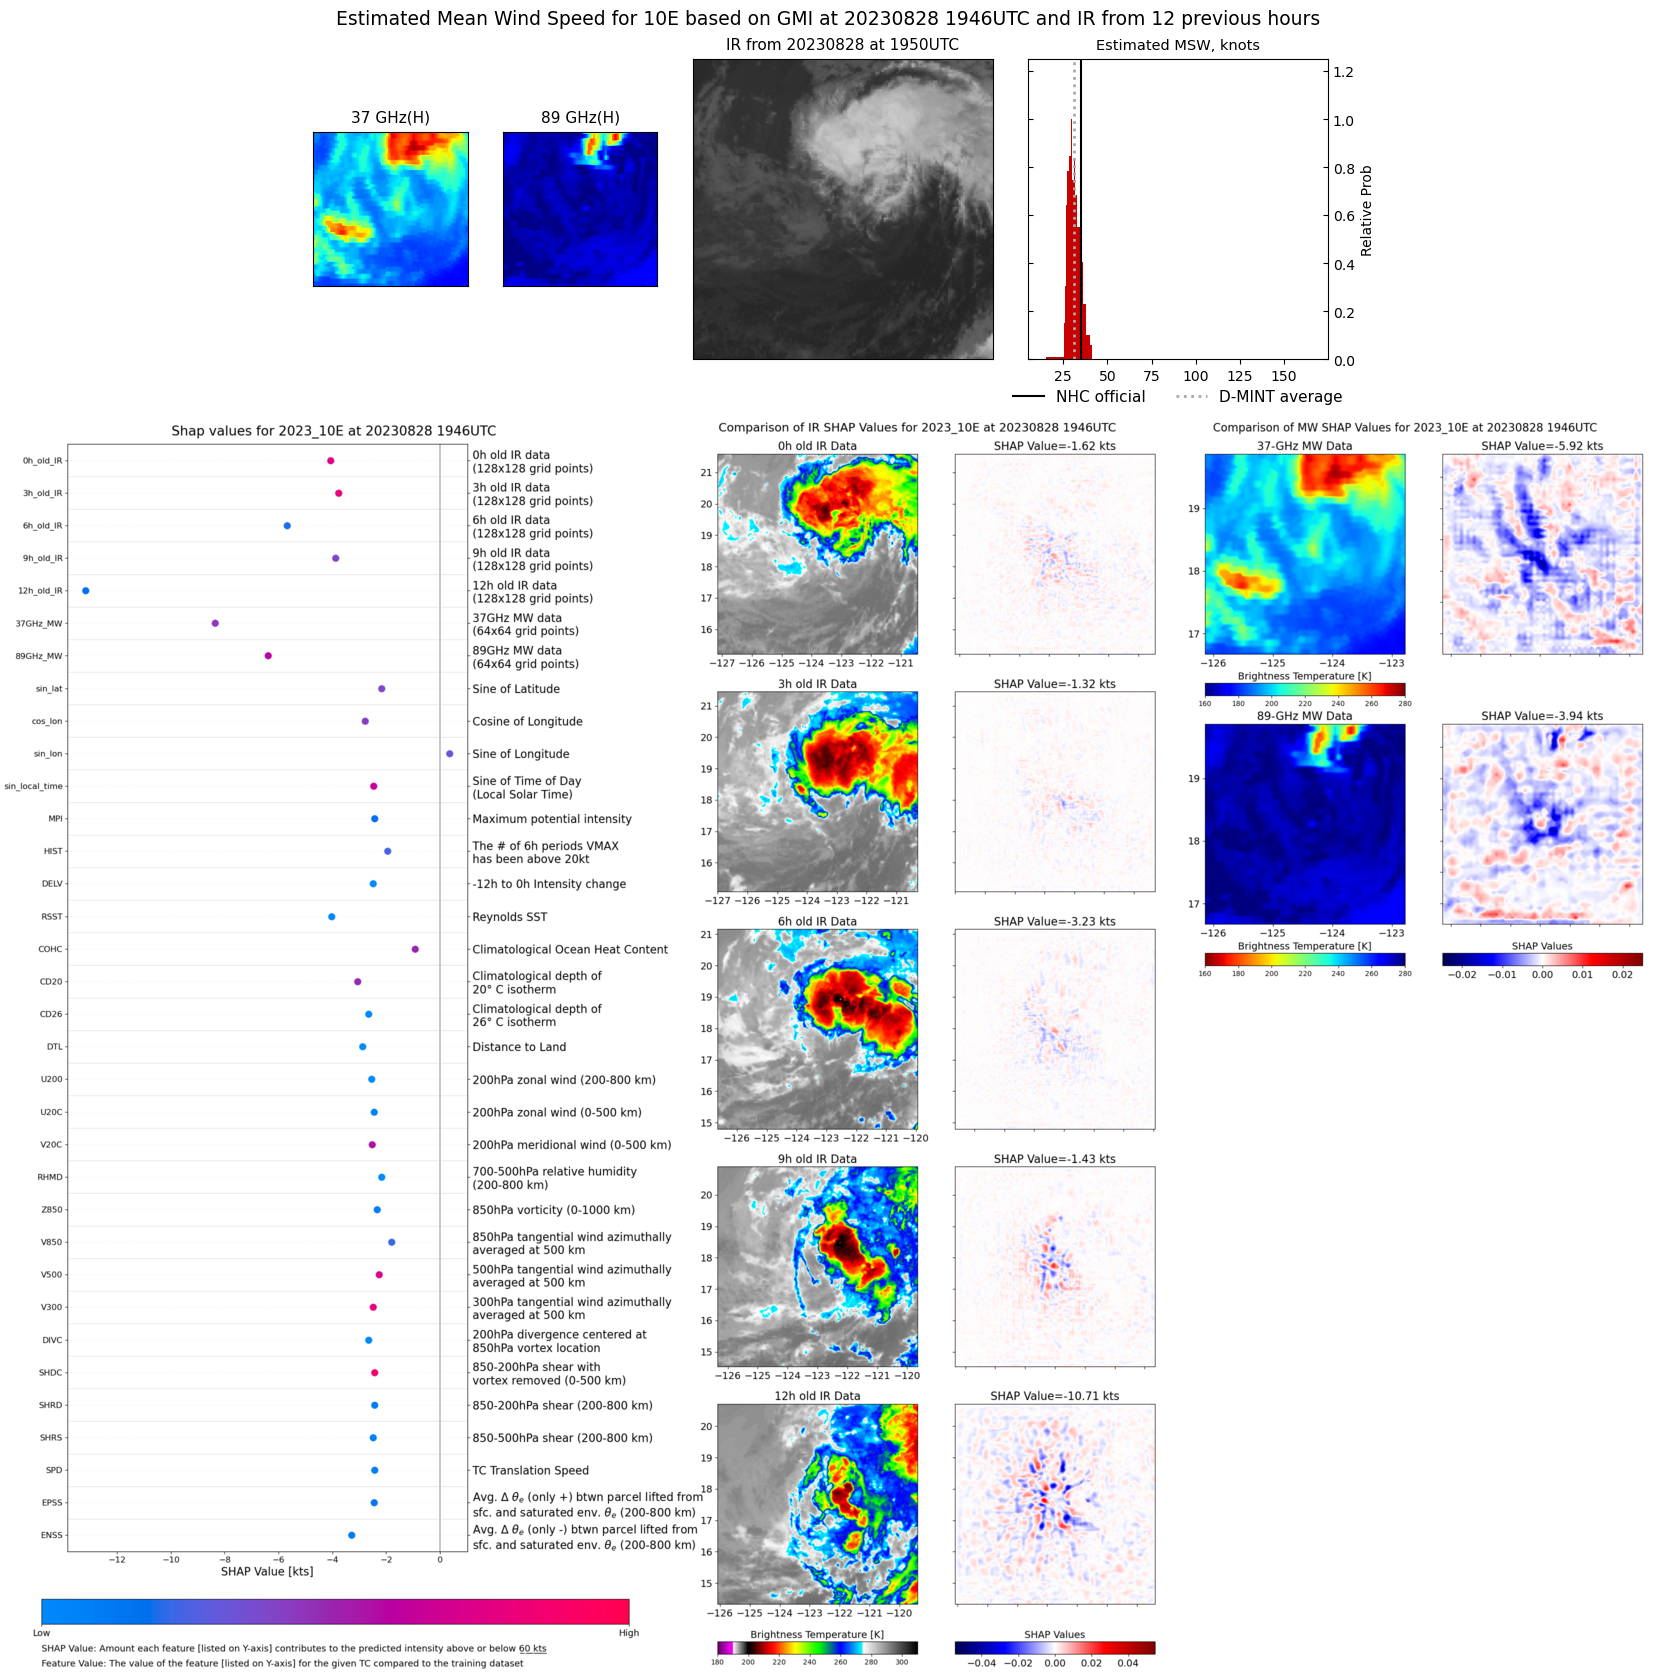 |
| 20230828 | 1339 UTC | SSMISF16 | 1002 hPa | 29 kts | 27 kts | 32 kts | 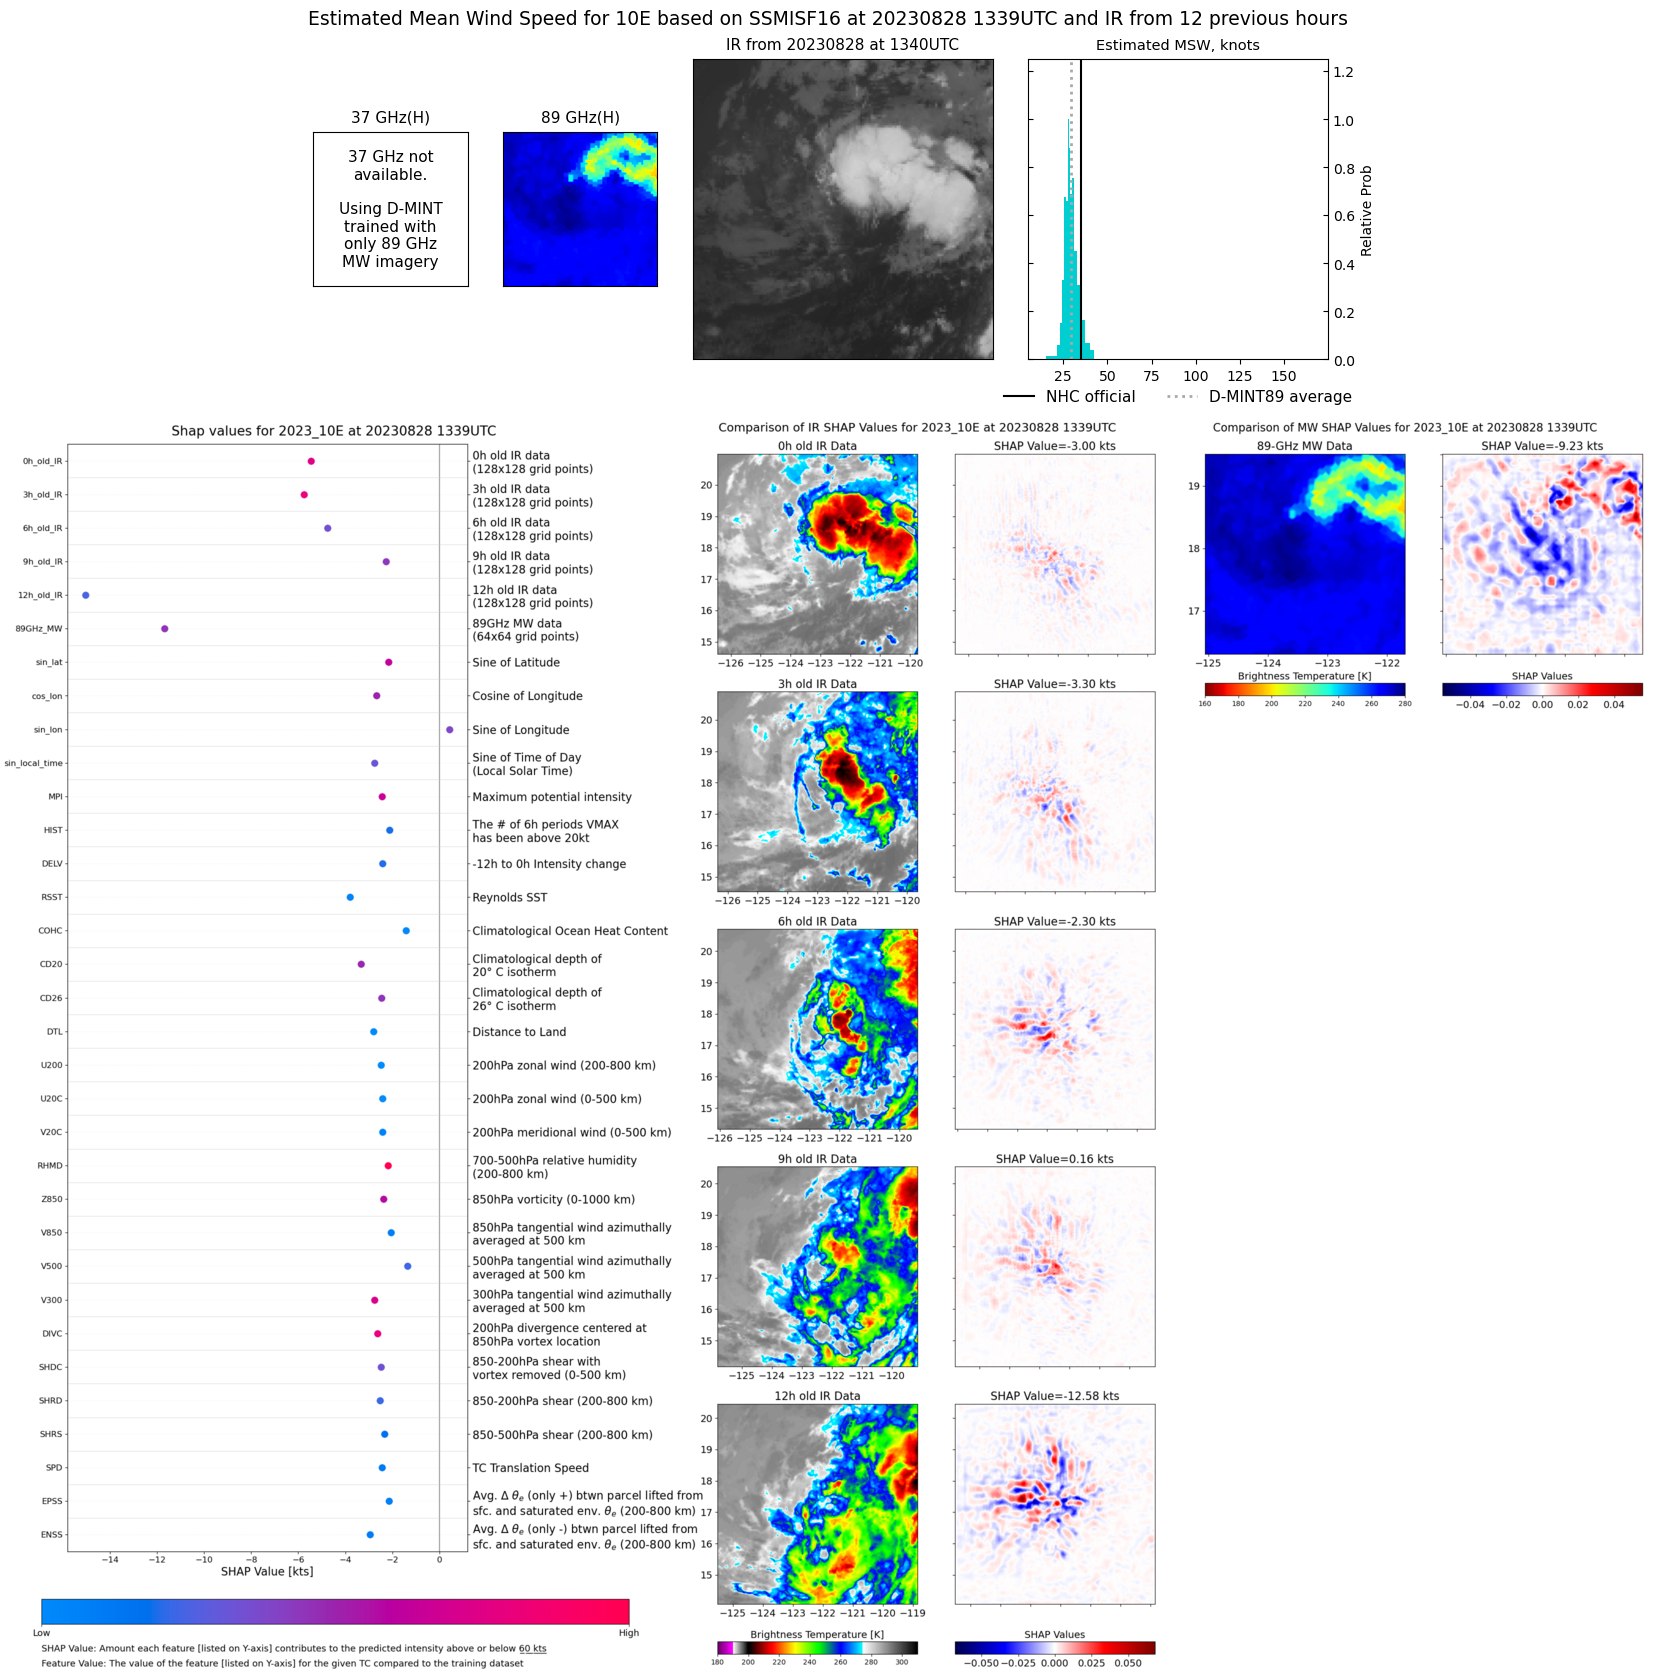 |
| 20230828 | 0928 UTC | AMSR2 | 1001 hPa | 35 kts | 32 kts | 38 kts |  |
| 20230828 | 0631 UTC | GMI | 1001 hPa | 35 kts | 32 kts | 38 kts | 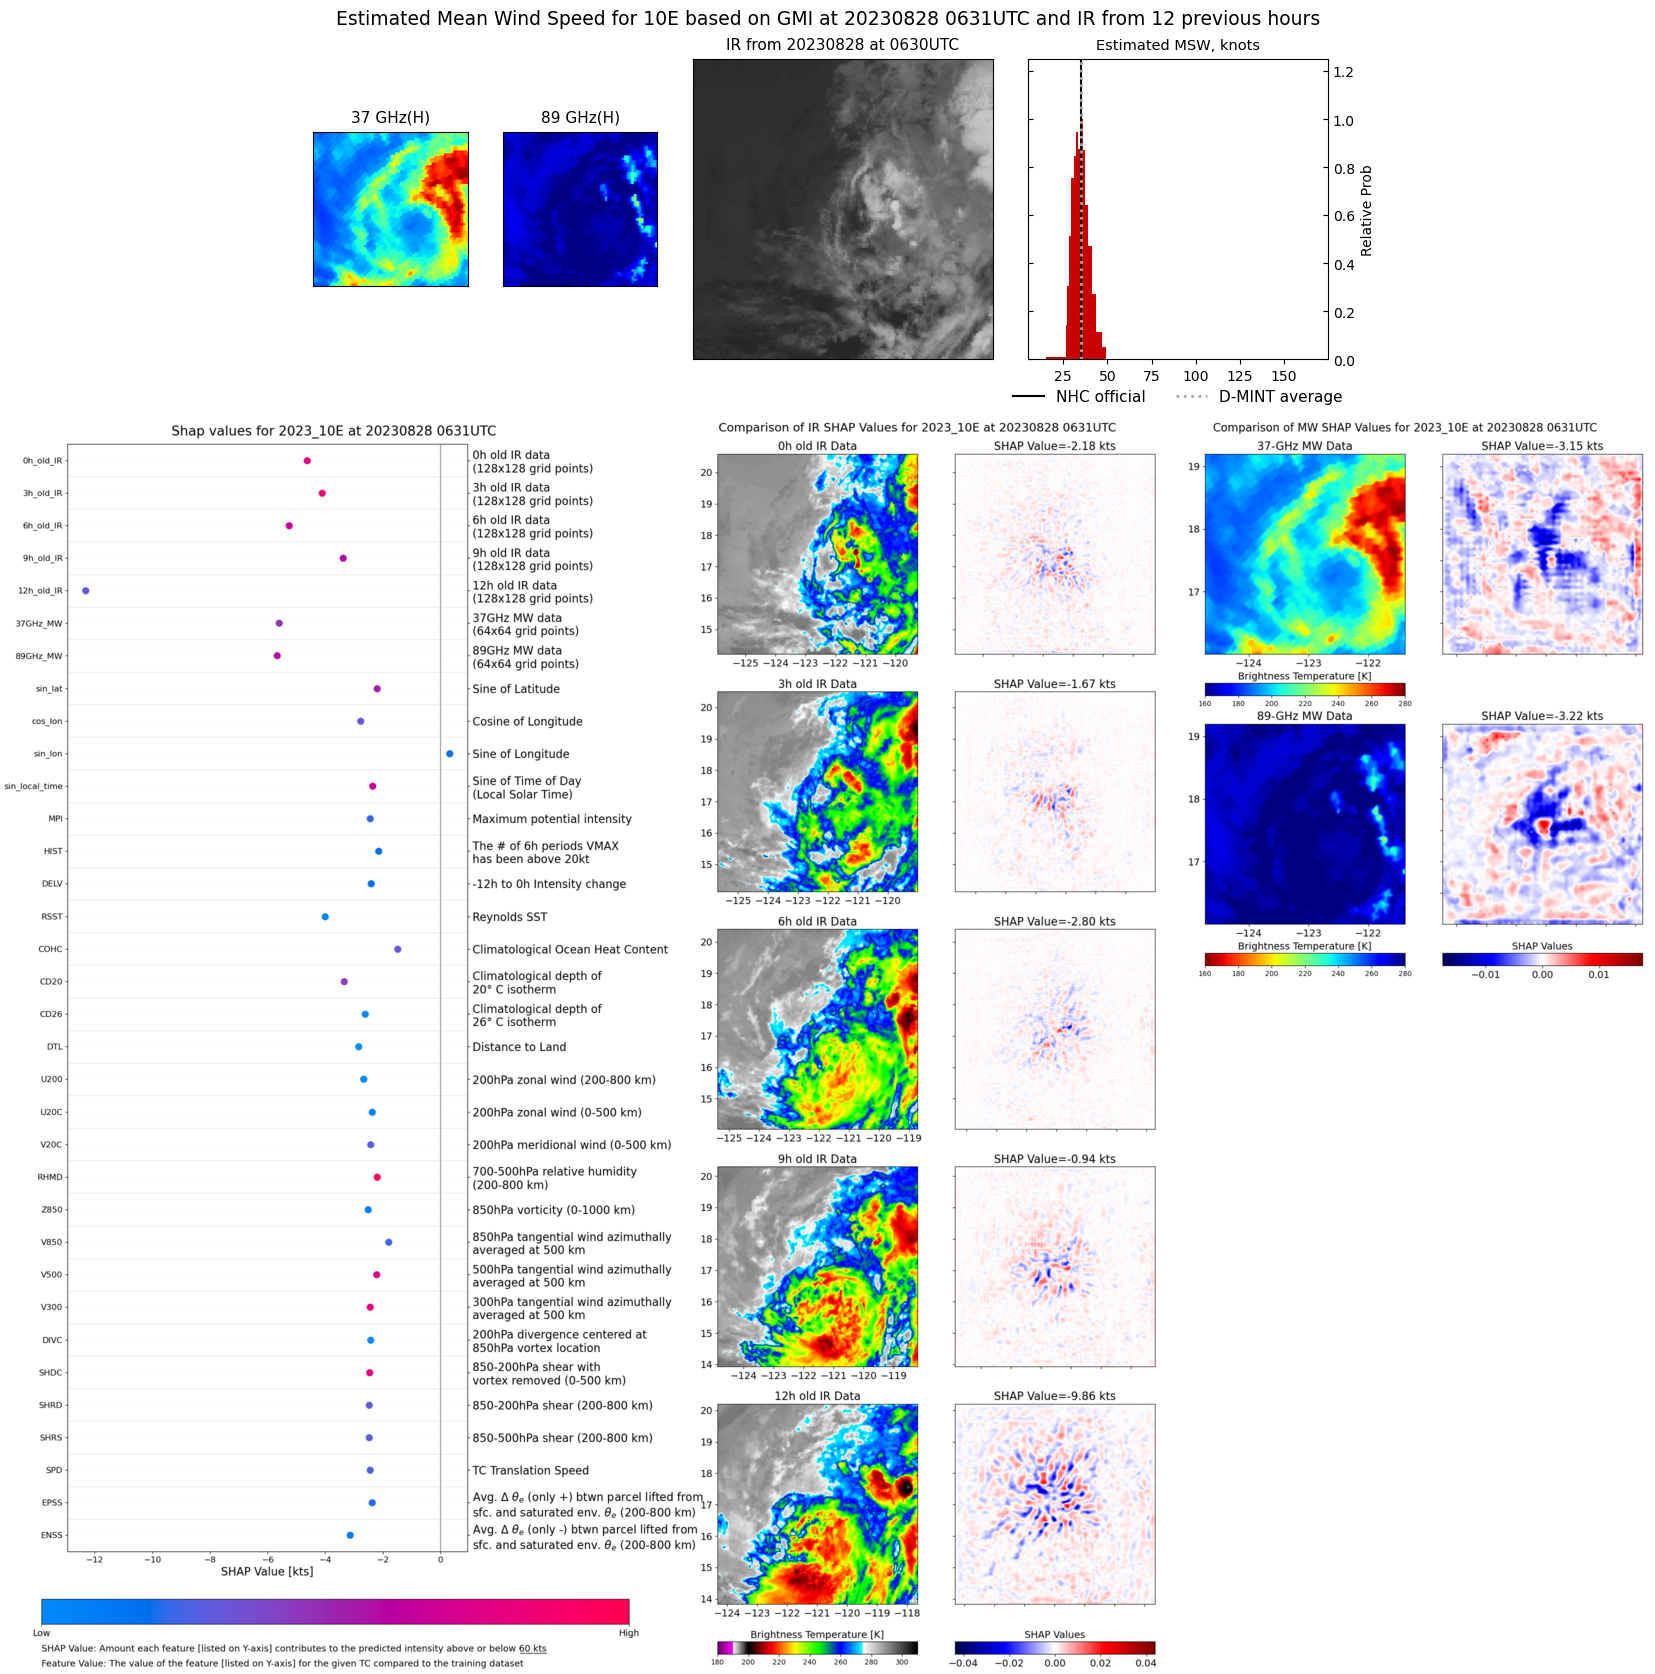 |
| 20230828 | 0244 UTC | SSMISF17 | 1001 hPa | 37 kts | 33 kts | 41 kts | 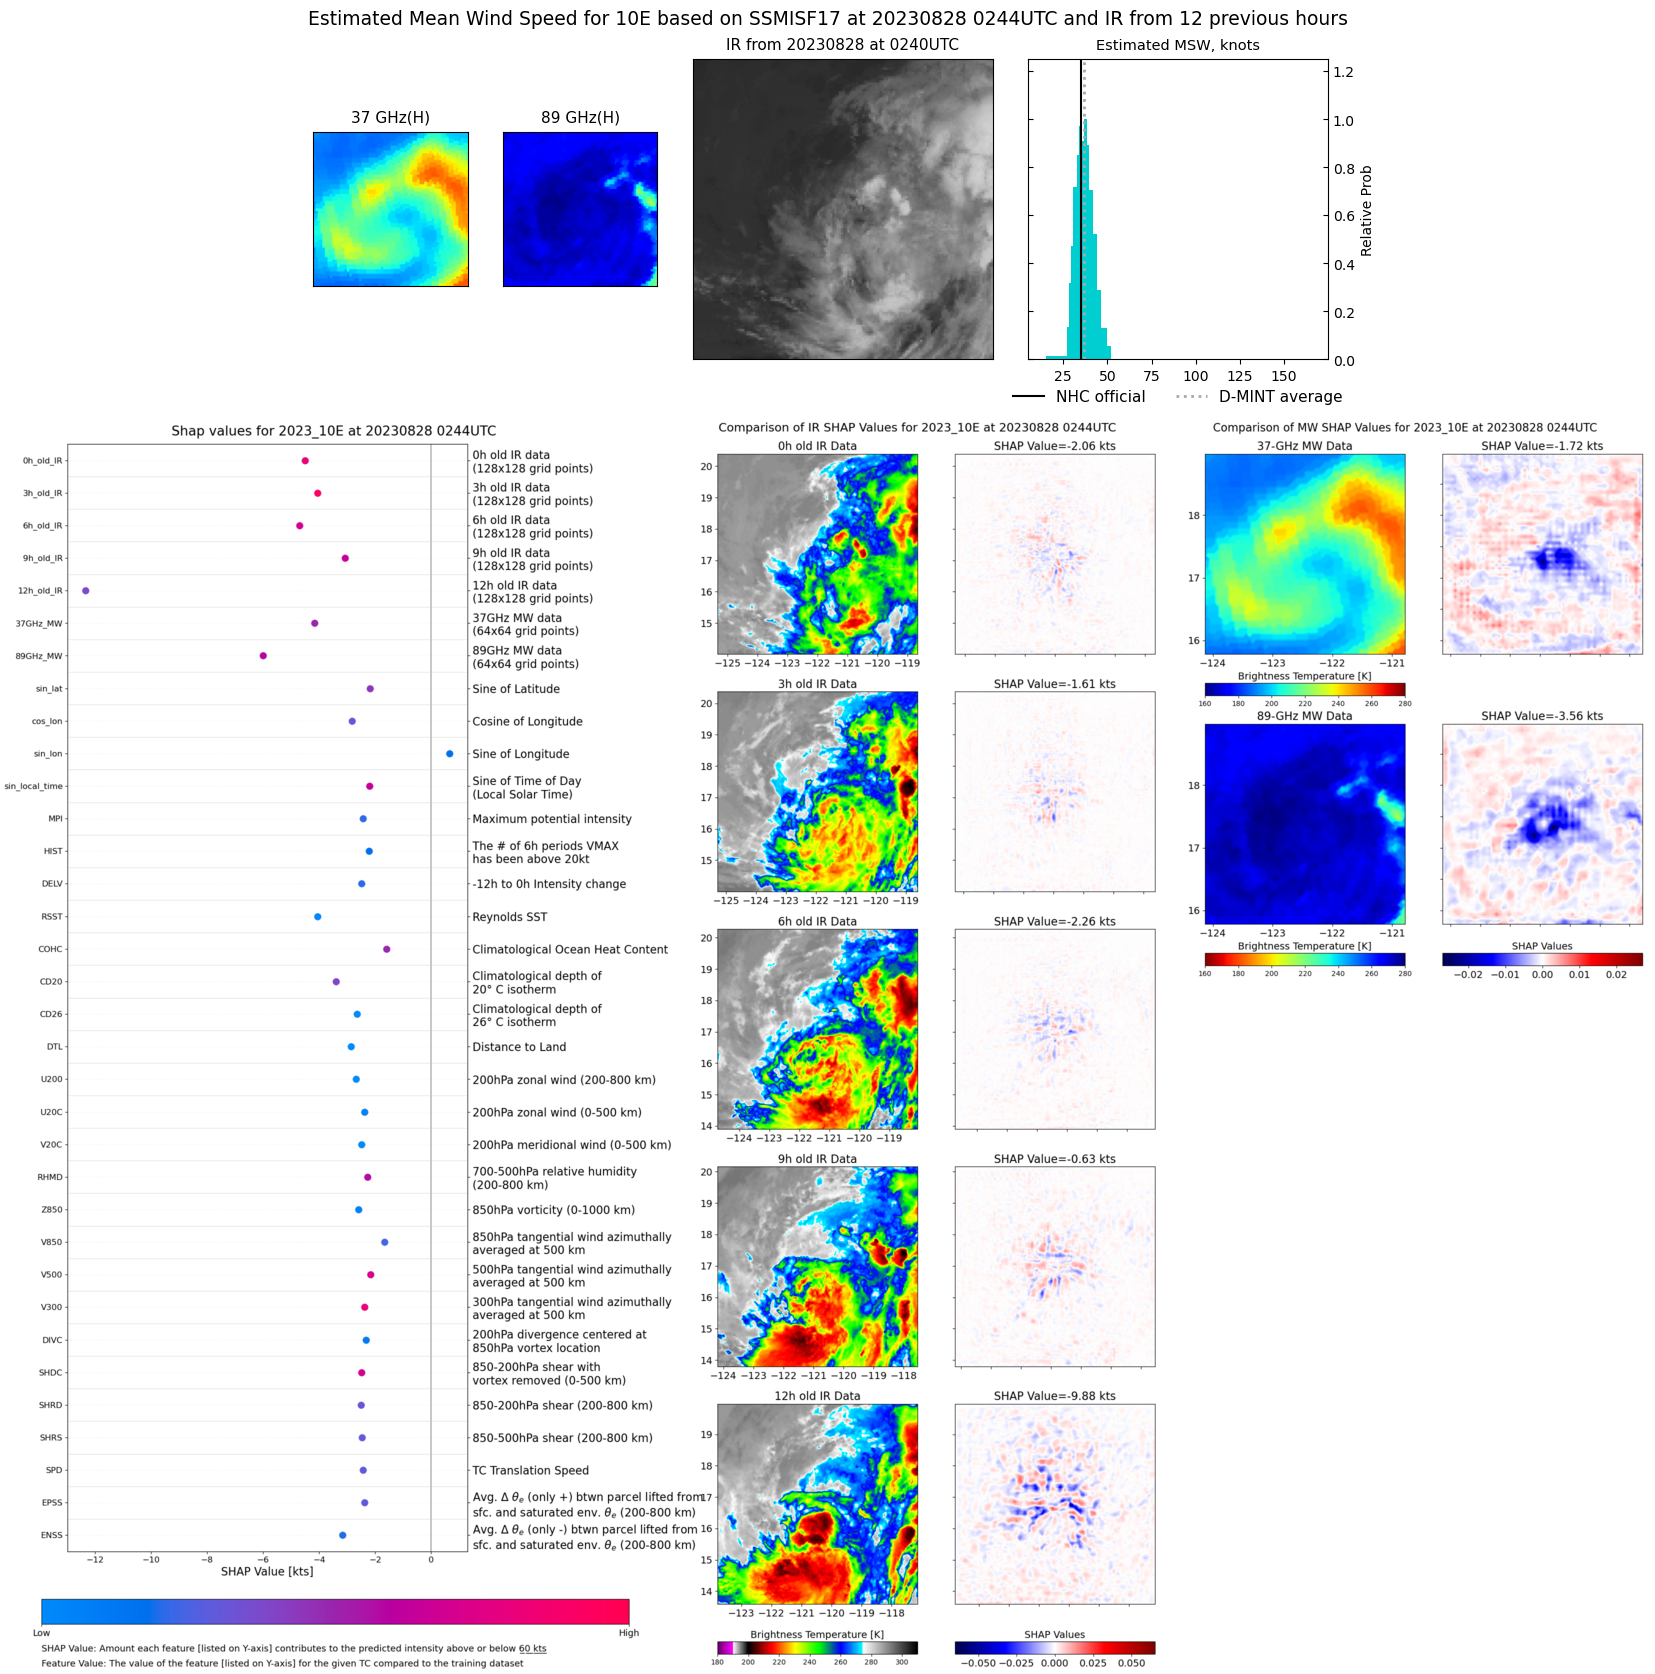 |
| 20230828 | 0104 UTC | SSMISF16 | 1001 hPa | 34 kts | 31 kts | 38 kts | 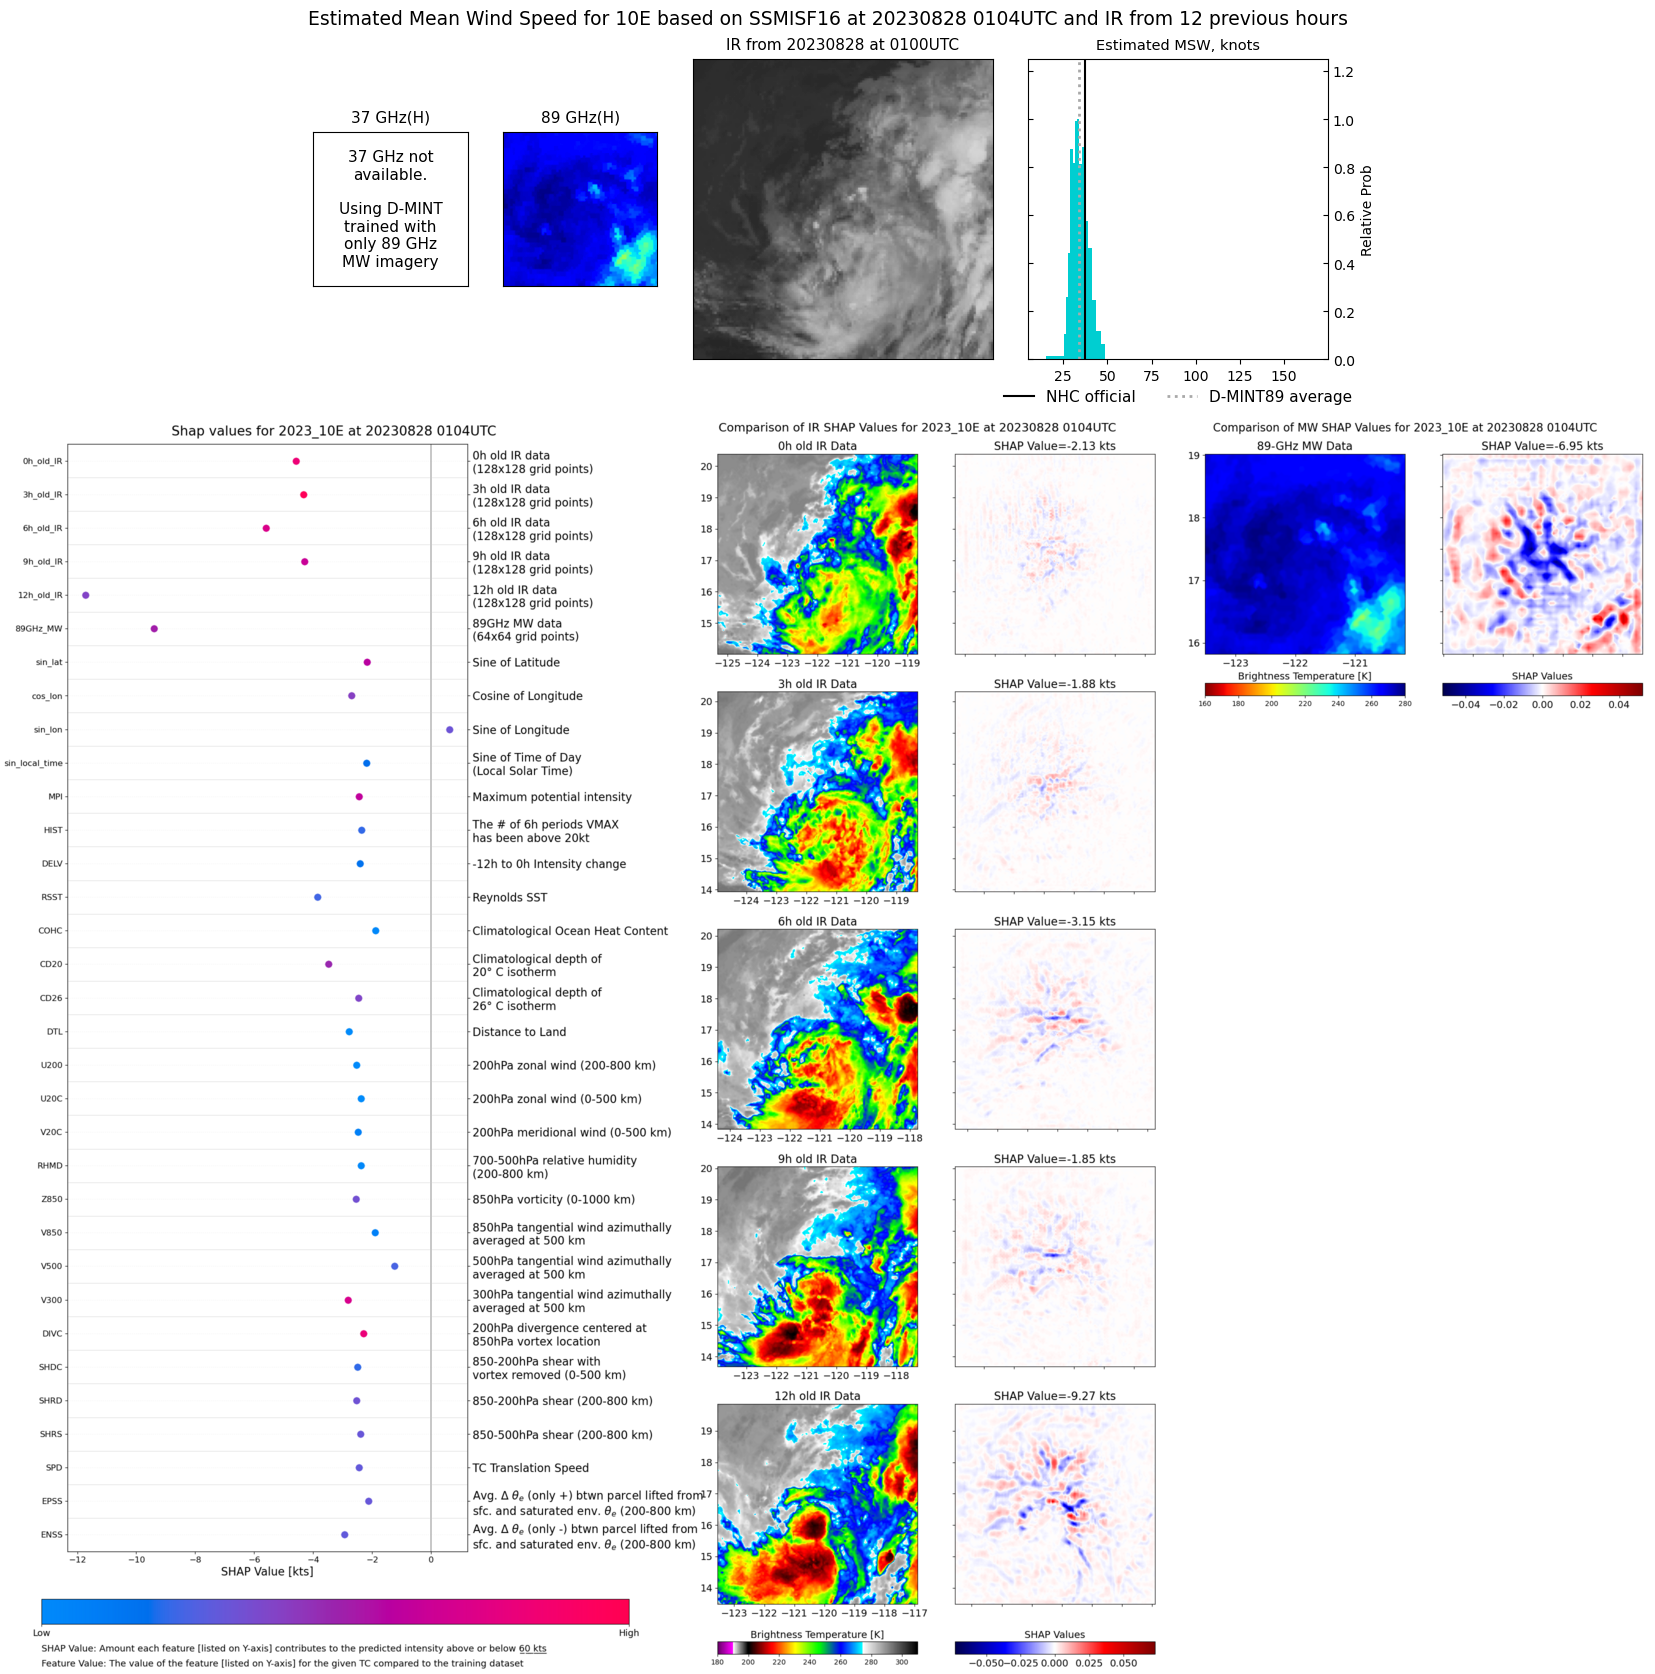 |
| 20230827 | 2115 UTC | AMSR2 | 1001 hPa | 37 kts | 34 kts | 41 kts | 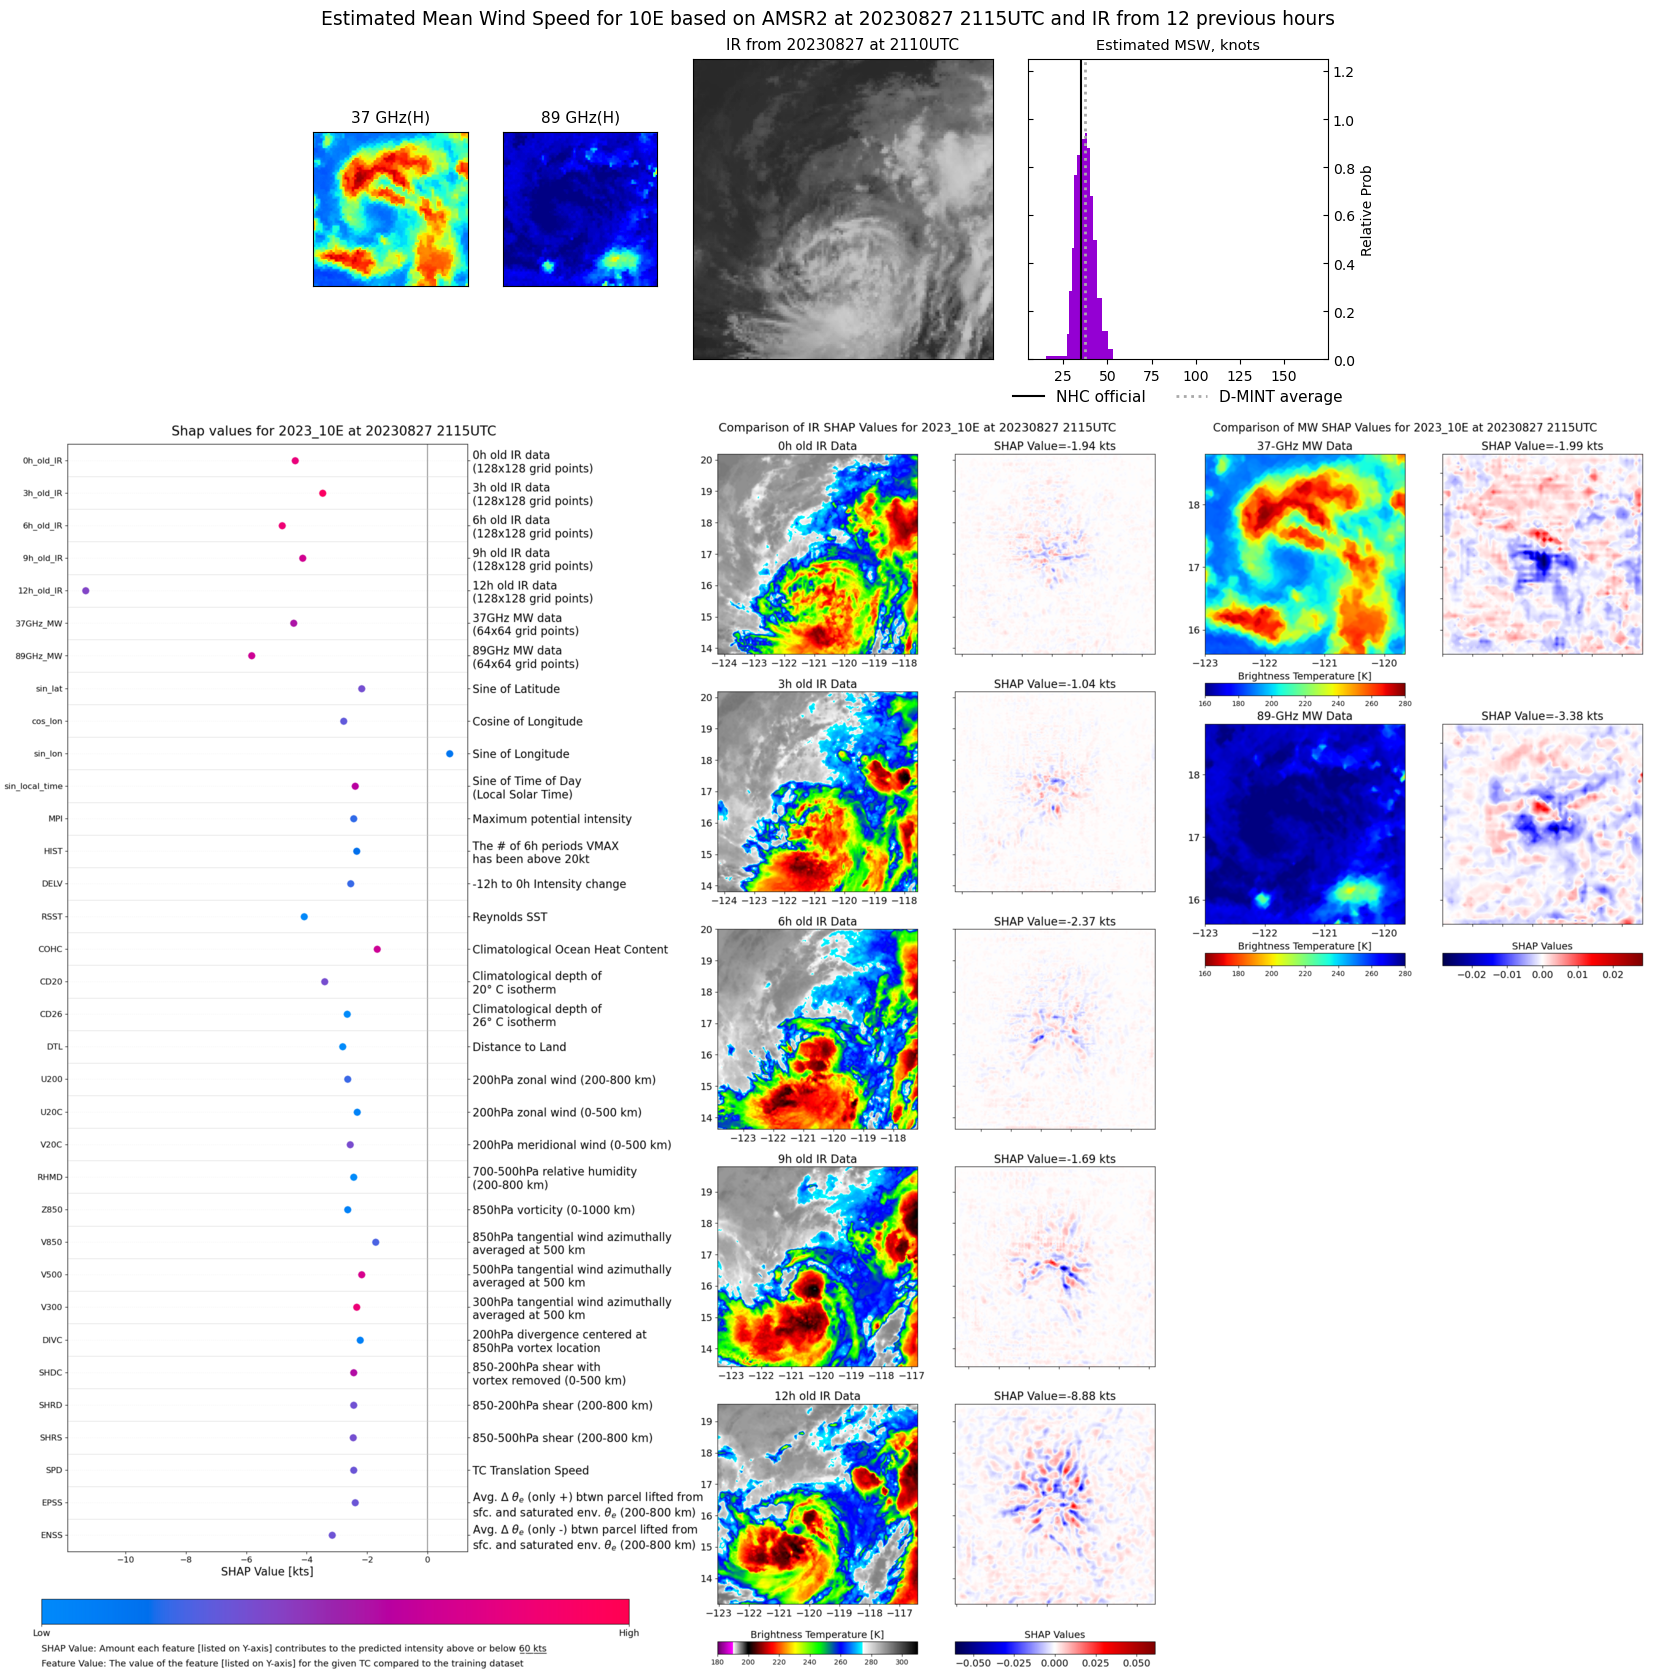 |
| 20230827 | 1352 UTC | SSMISF16 | 1002 hPa | 33 kts | 30 kts | 36 kts | 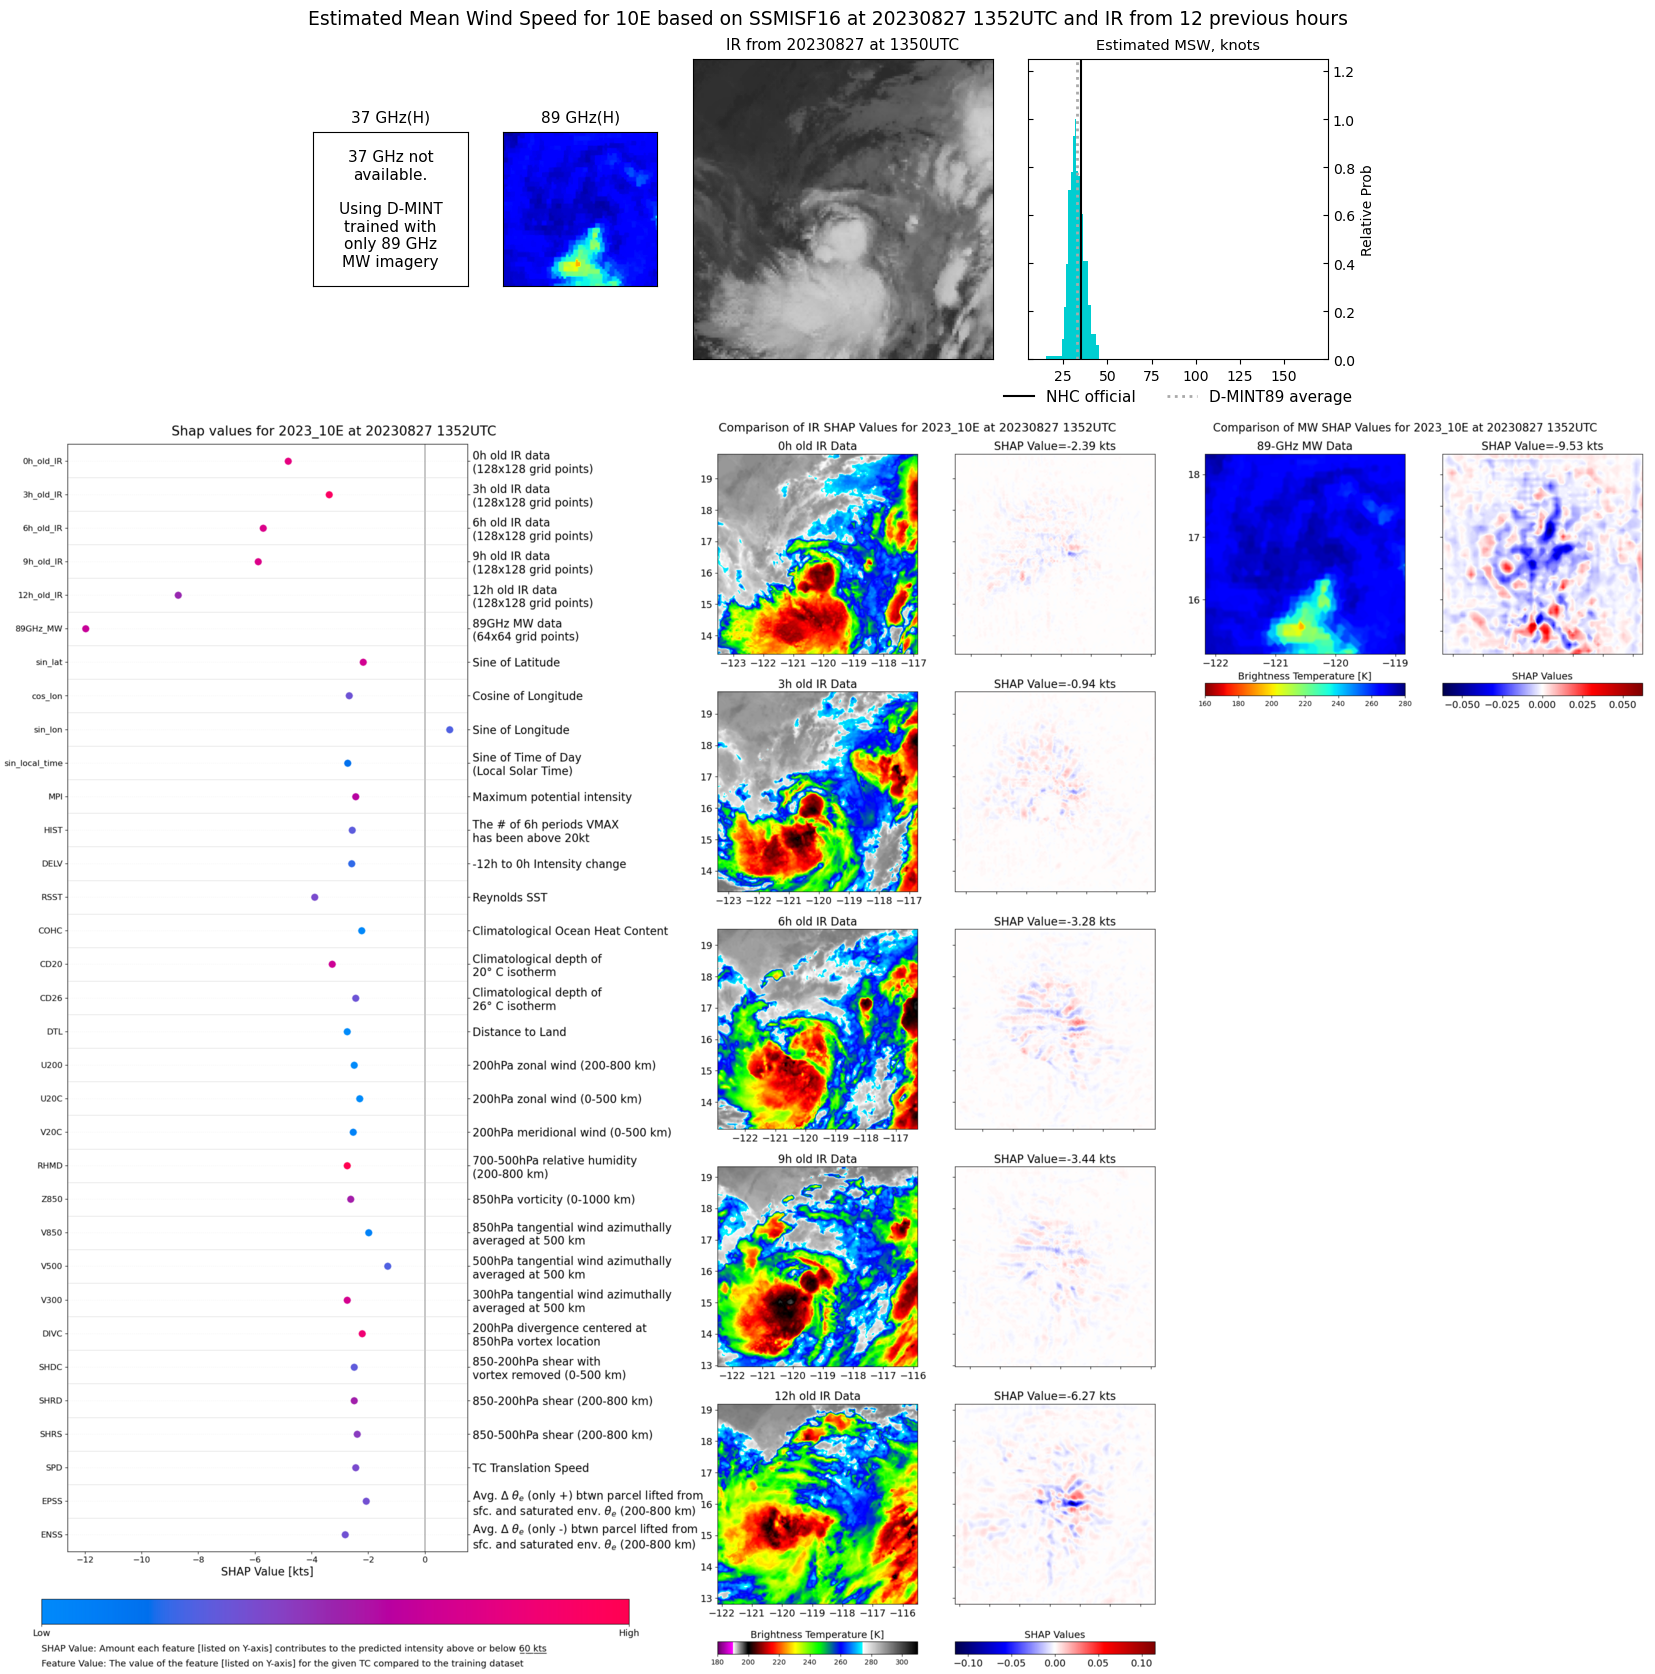 |
| 20230827 | 1159 UTC | SSMISF18 | 1002 hPa | 36 kts | 32 kts | 40 kts | 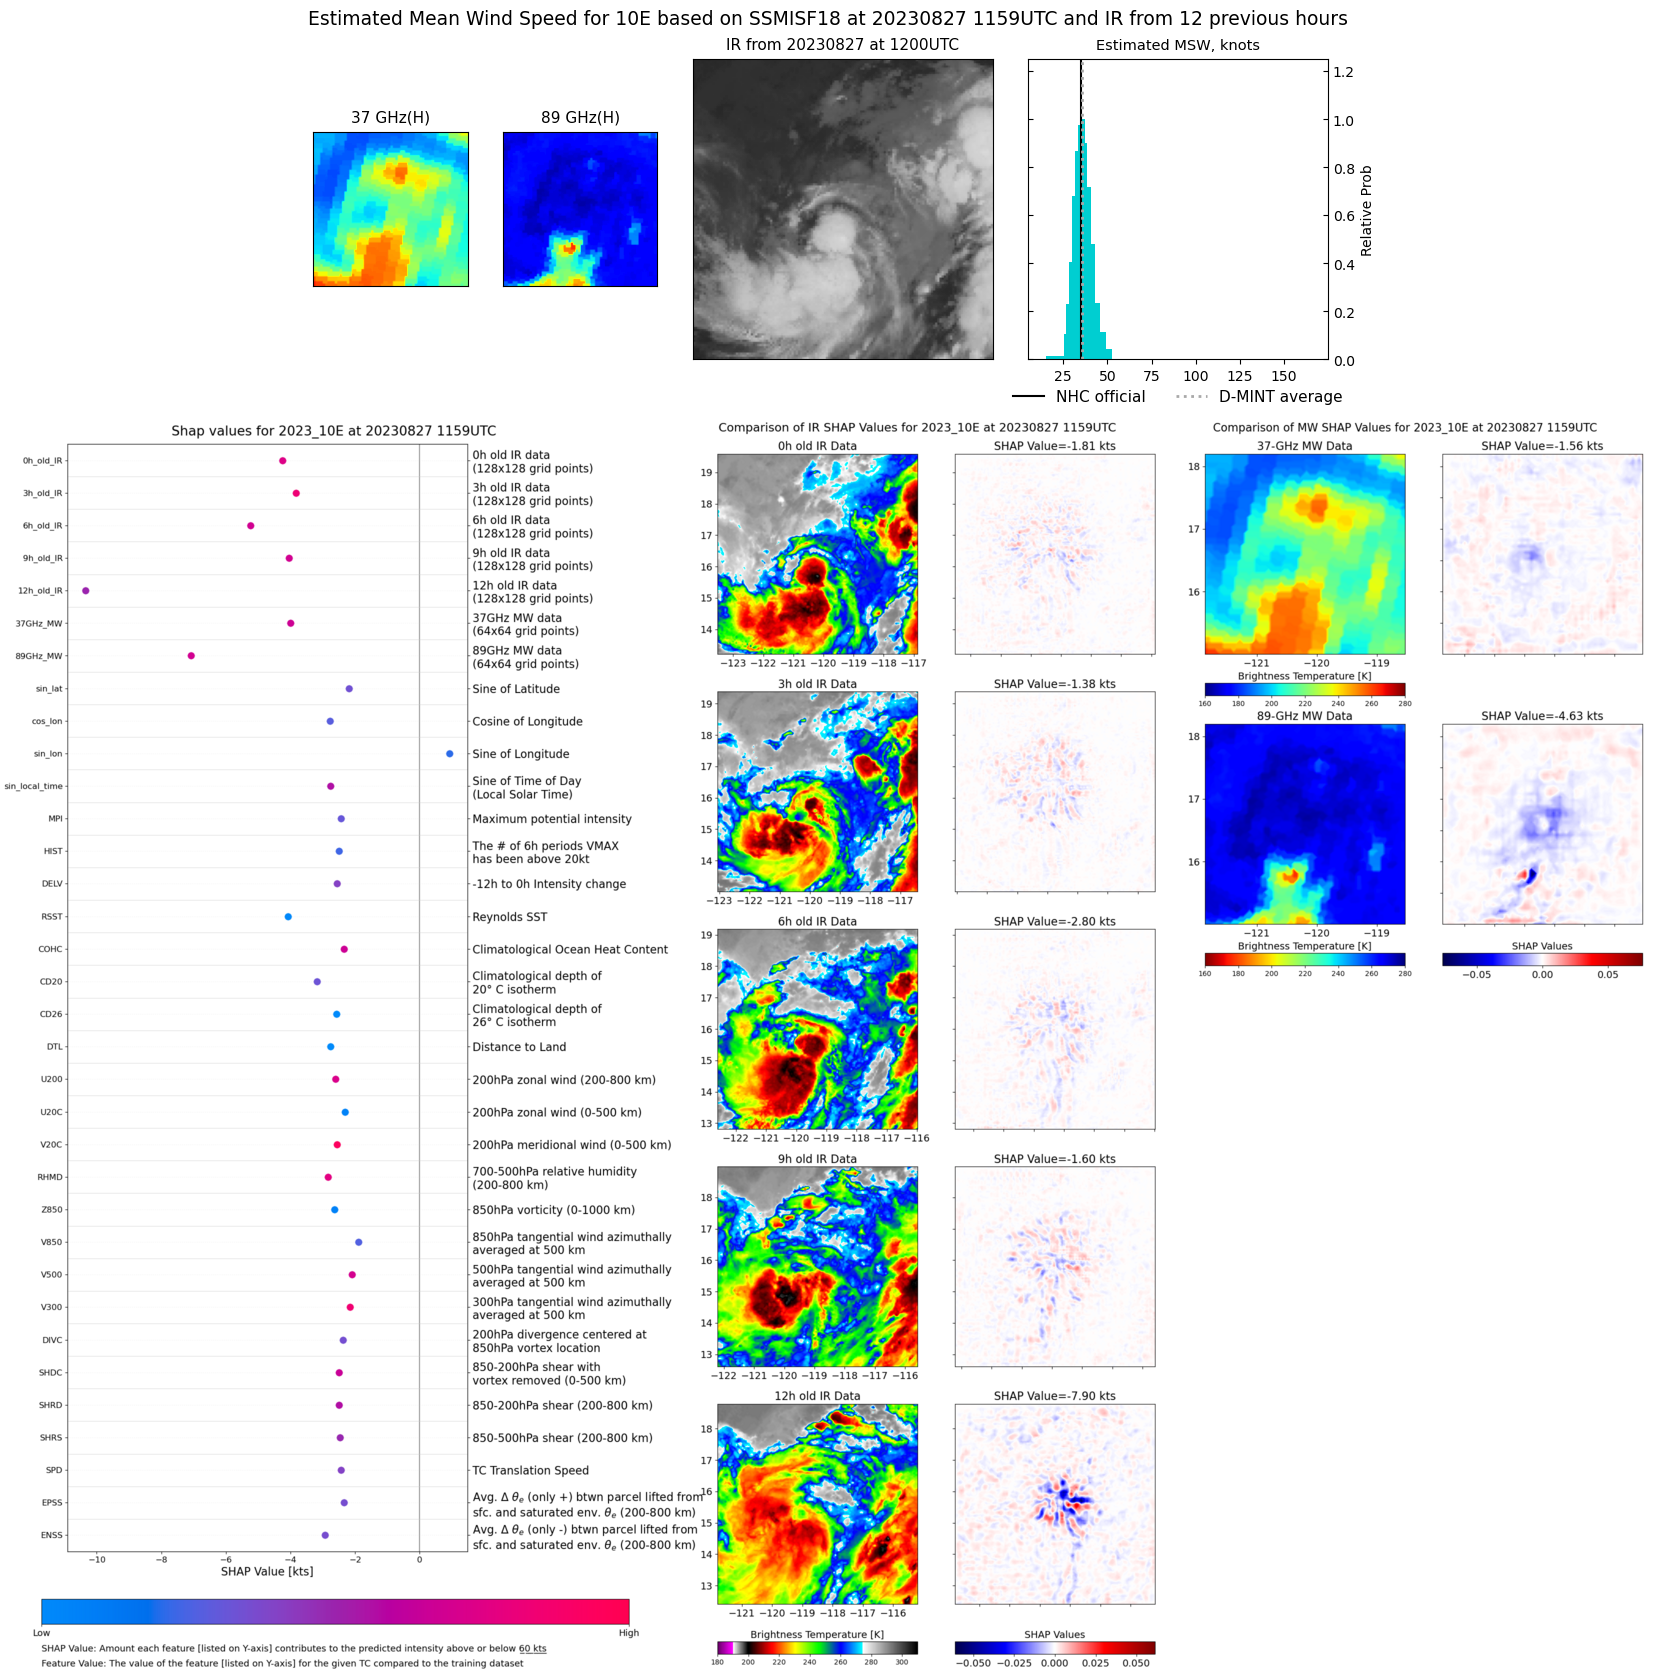 |