|
||
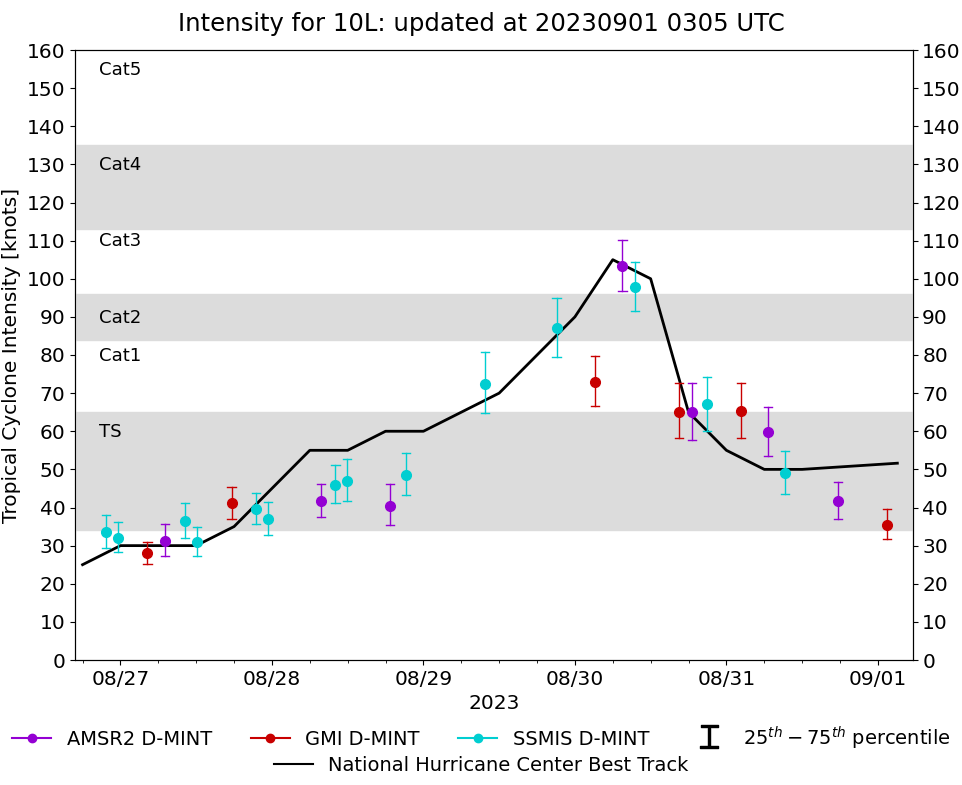 |
D-MINT HISTORY FILE for 2023_10L
| Date | Time | MW Sensor | MSLP | Vmax (30th-70th percentile average) | Vmax 25th percentile | Vmax 75th percentile | Image |
| 20230901 | 0126 UTC | GMI | 999 hPa | 35 kts | 32 kts | 40 kts |  |
| 20230831 | 1738 UTC | AMSR2 | 999 hPa | 42 kts | 37 kts | 47 kts |  |
| 20230831 | 0919 UTC | SSMISF18 | 992 hPa | 49 kts | 43 kts | 55 kts |  |
| 20230831 | 0637 UTC | AMSR2 | 991 hPa | 60 kts | 54 kts | 66 kts |  |
| 20230831 | 0216 UTC | GMI | 989 hPa | 65 kts | 58 kts | 73 kts |  |
| 20230830 | 2053 UTC | SSMISF18 | 981 hPa | 67 kts | 60 kts | 74 kts |  |
| 20230830 | 1832 UTC | AMSR2 | 980 hPa | 65 kts | 58 kts | 73 kts |  |
| 20230830 | 1631 UTC | GMI | 979 hPa | 65 kts | 58 kts | 73 kts |  |
| 20230830 | 0934 UTC | SSMISF18 | 955 hPa | 98 kts | 92 kts | 105 kts |  |
| 20230830 | 0732 UTC | AMSR2 | 955 hPa | 103 kts | 97 kts | 110 kts |  |
| 20230830 | 0311 UTC | GMI | 979 hPa | 73 kts | 67 kts | 80 kts |  |
| 20230829 | 2105 UTC | SSMISF18 | 978 hPa | 87 kts | 79 kts | 95 kts | 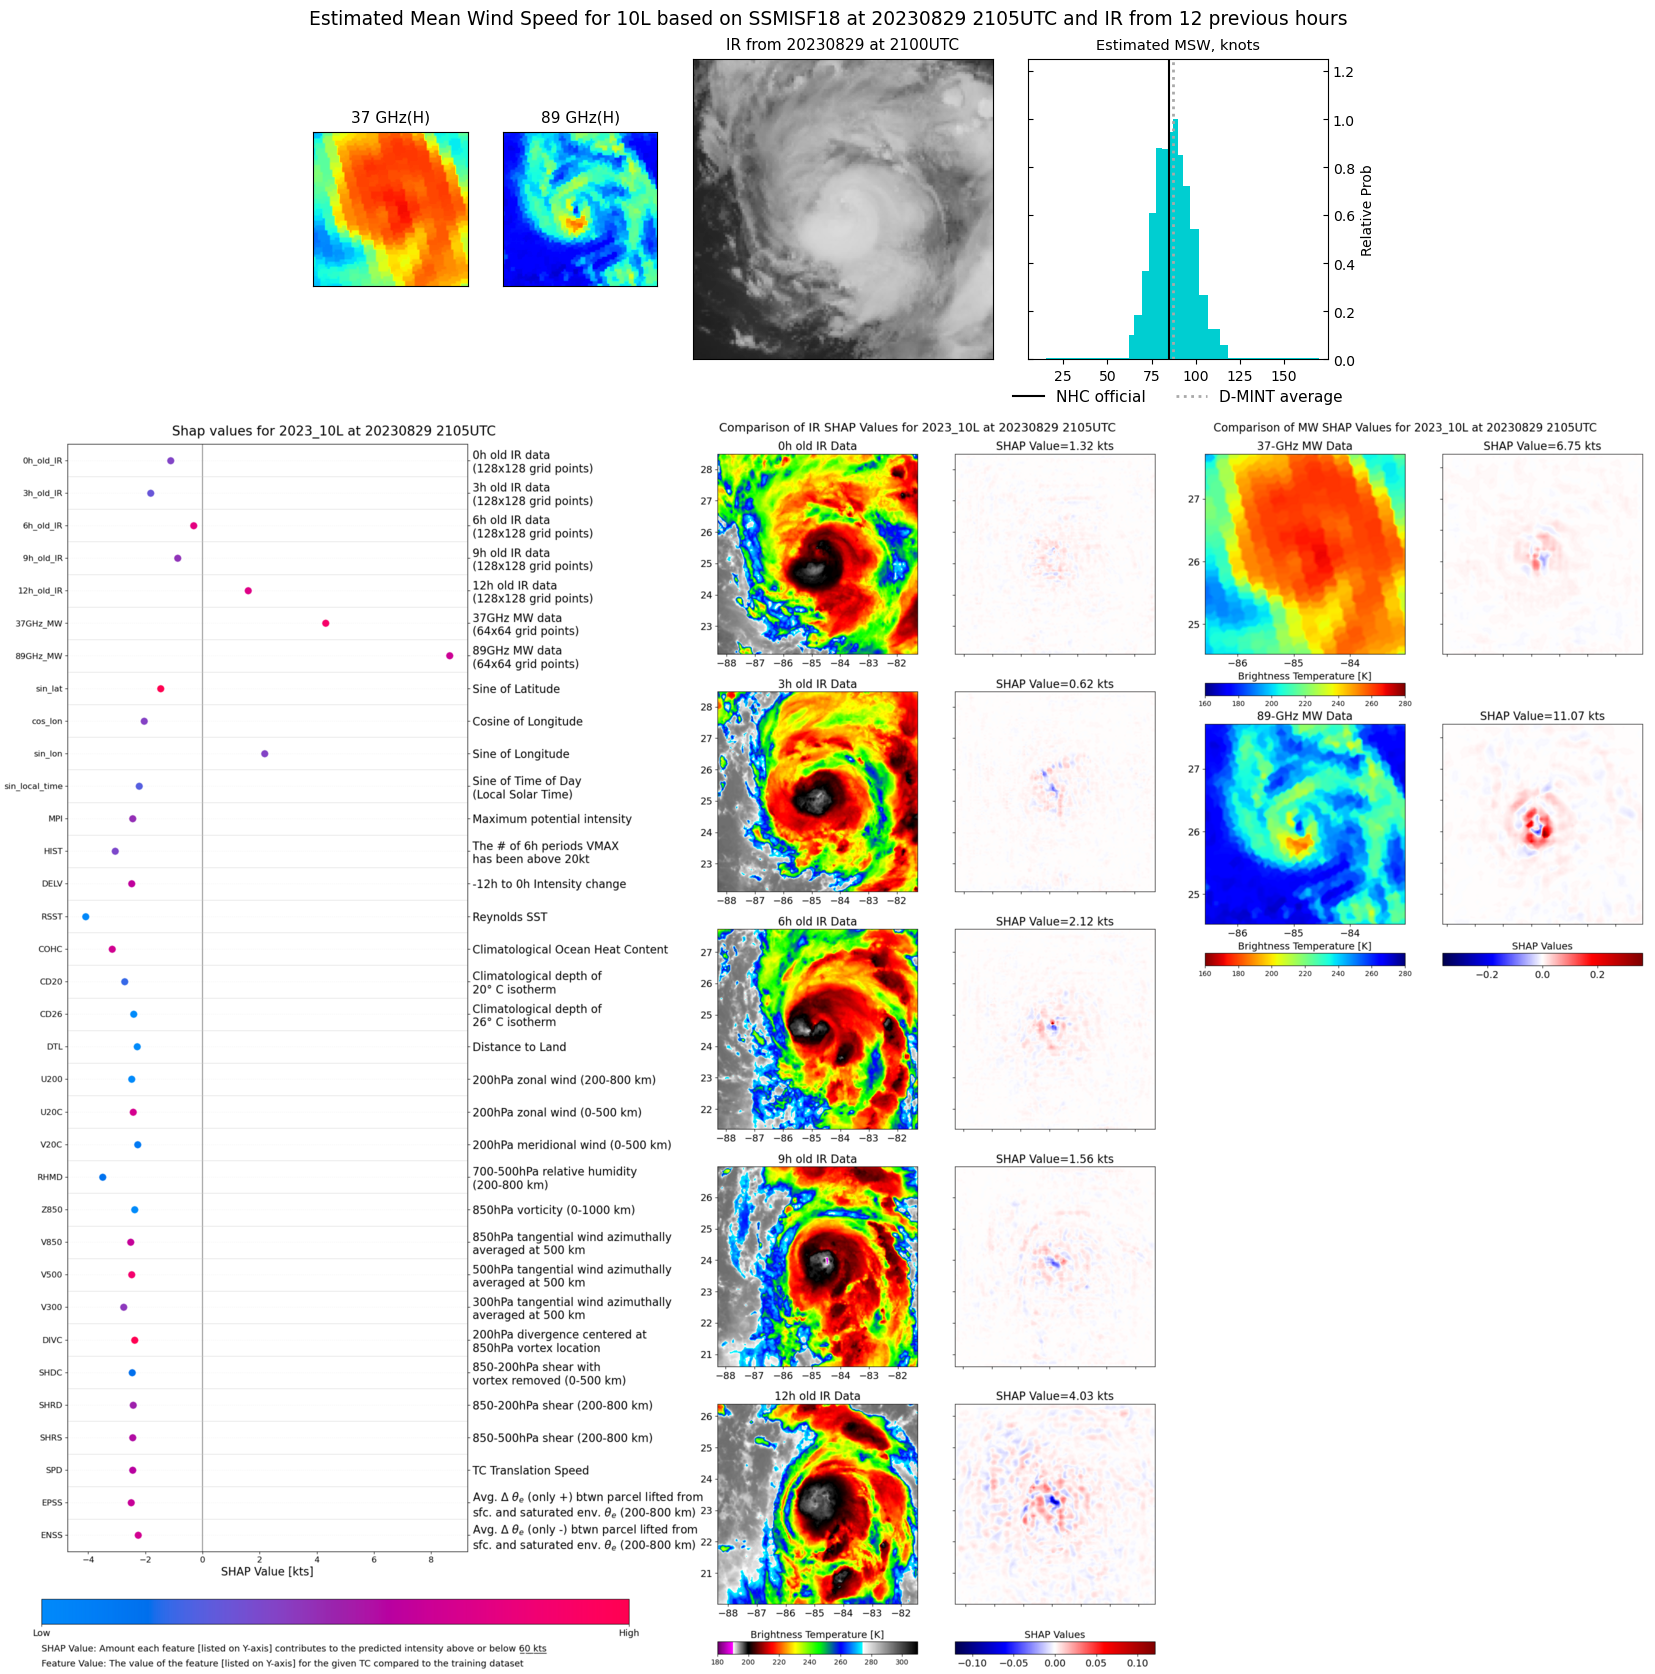 |
| 20230829 | 0948 UTC | SSMISF18 | 980 hPa | 72 kts | 65 kts | 81 kts |  |
| 20230828 | 2117 UTC | SSMISF18 | 998 hPa | 49 kts | 43 kts | 54 kts |  |
| 20230828 | 1842 UTC | AMSR2 | 1000 hPa | 40 kts | 35 kts | 46 kts |  |
| 20230828 | 1154 UTC | SSMISF17 | 1000 hPa | 47 kts | 42 kts | 53 kts |  |
| 20230828 | 1003 UTC | SSMISF18 | 998 hPa | 46 kts | 41 kts | 51 kts |  |
| 20230828 | 0747 UTC | AMSR2 | 1000 hPa | 42 kts | 37 kts | 46 kts |  |
| 20230827 | 2322 UTC | SSMISF17 | 1001 hPa | 37 kts | 33 kts | 41 kts |  |
| 20230827 | 2130 UTC | SSMISF18 | 1000 hPa | 40 kts | 36 kts | 44 kts | 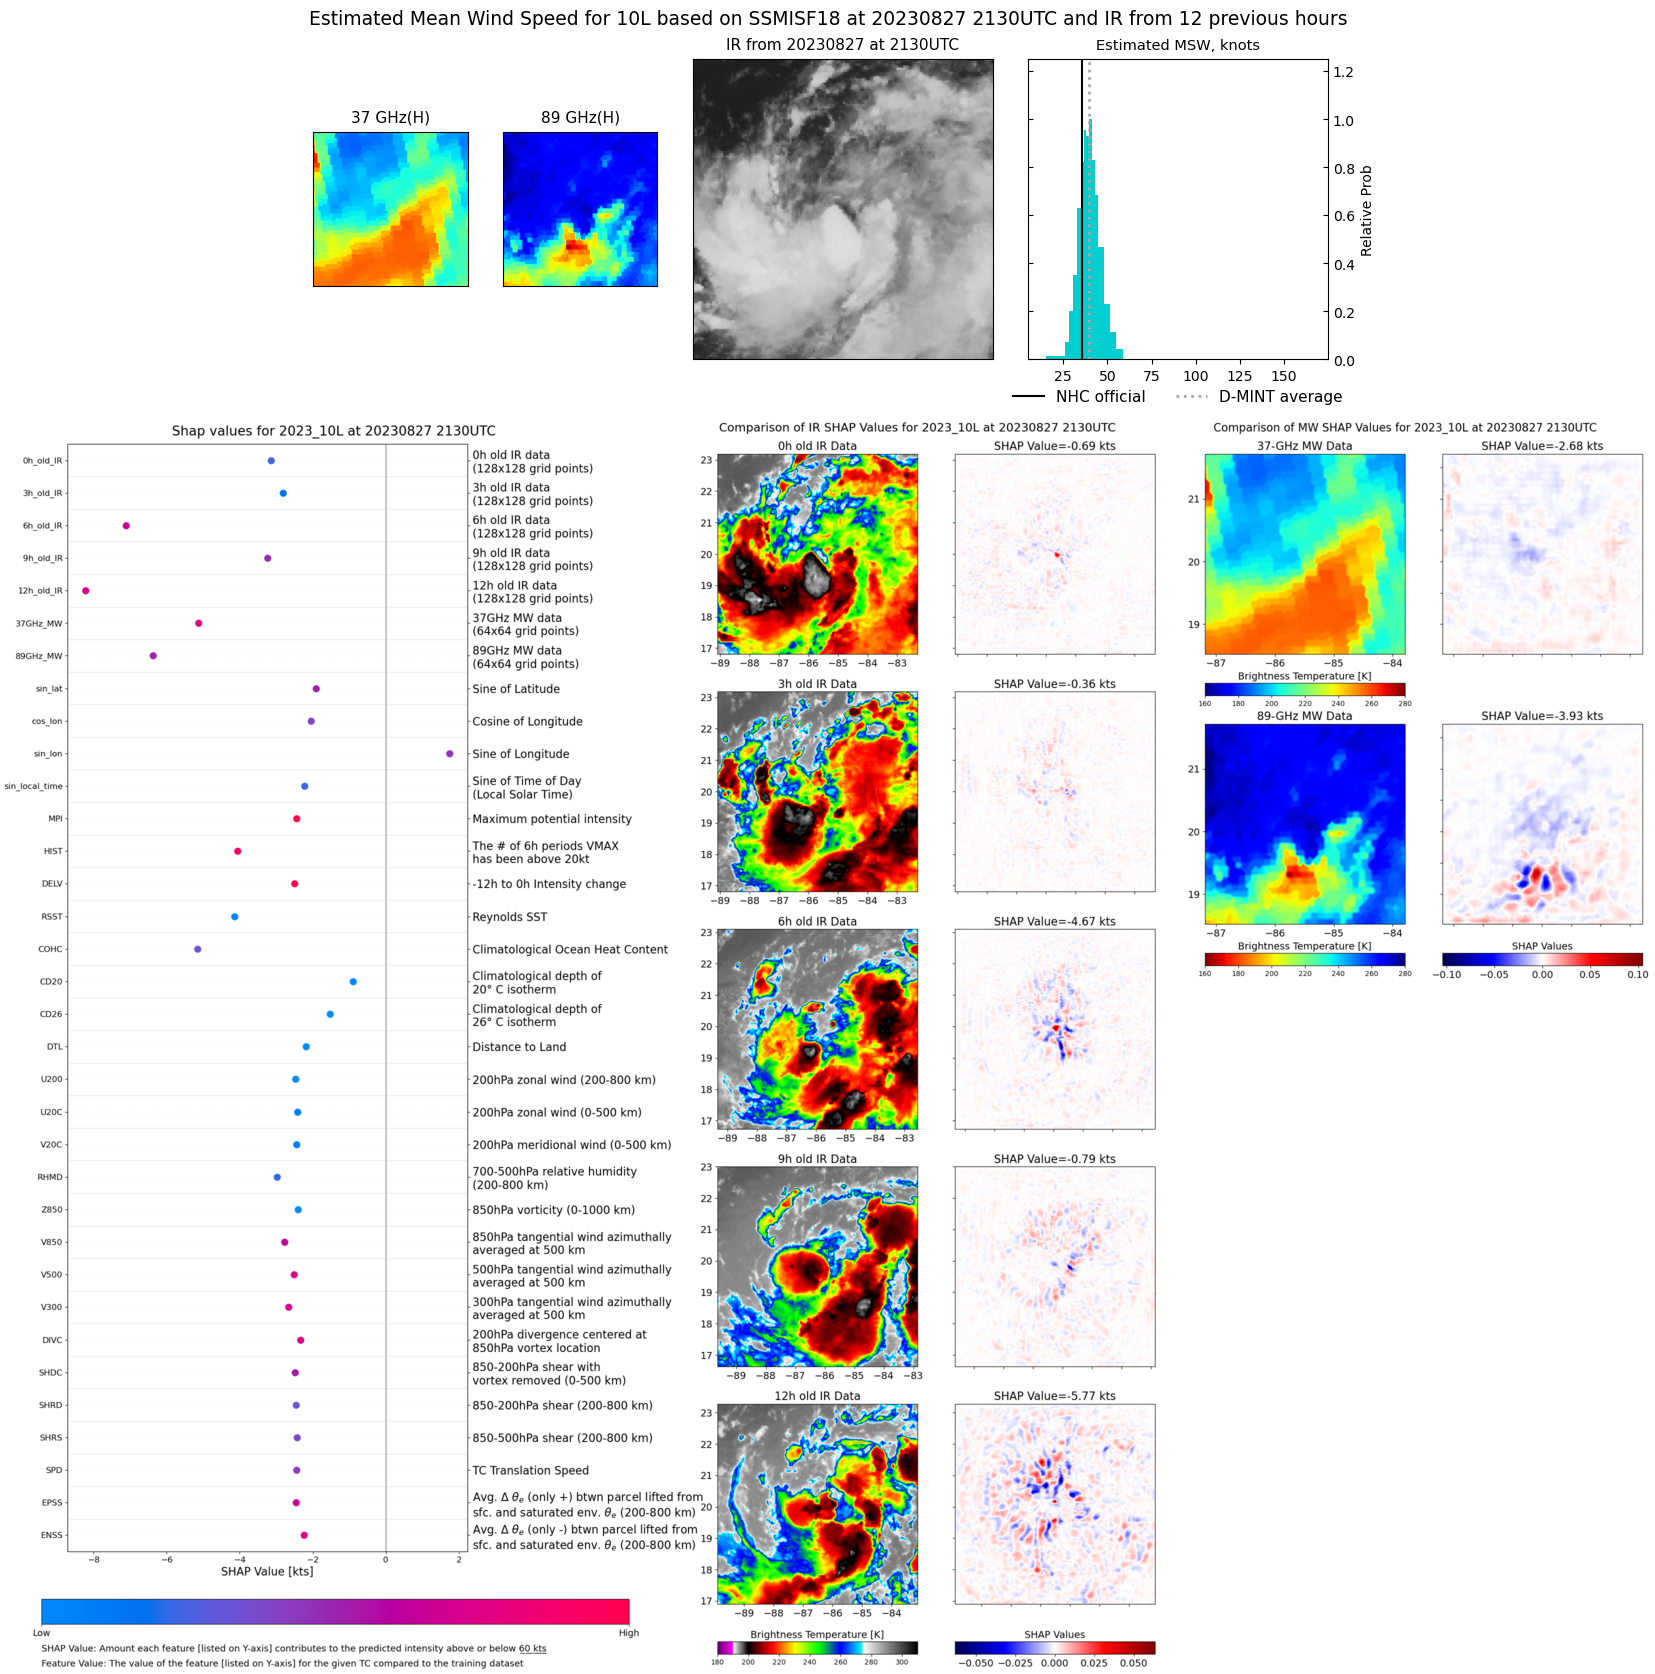 |
| 20230827 | 1736 UTC | GMI | 1001 hPa | 41 kts | 37 kts | 45 kts |  |
| 20230827 | 1207 UTC | SSMISF17 | 1004 hPa | 31 kts | 27 kts | 35 kts |  |
| 20230827 | 1016 UTC | SSMISF18 | 1000 hPa | 36 kts | 32 kts | 41 kts |  |
| 20230827 | 0705 UTC | AMSR2 | 998 hPa | 31 kts | 27 kts | 36 kts |  |
| 20230827 | 0416 UTC | GMI | 1004 hPa | 28 kts | 25 kts | 31 kts |  |
| 20230826 | 2335 UTC | SSMISF17 | 1006 hPa | 32 kts | 28 kts | 36 kts |  |
| 20230826 | 2143 UTC | SSMISF18 | 1005 hPa | 34 kts | 29 kts | 38 kts |  |