|
||
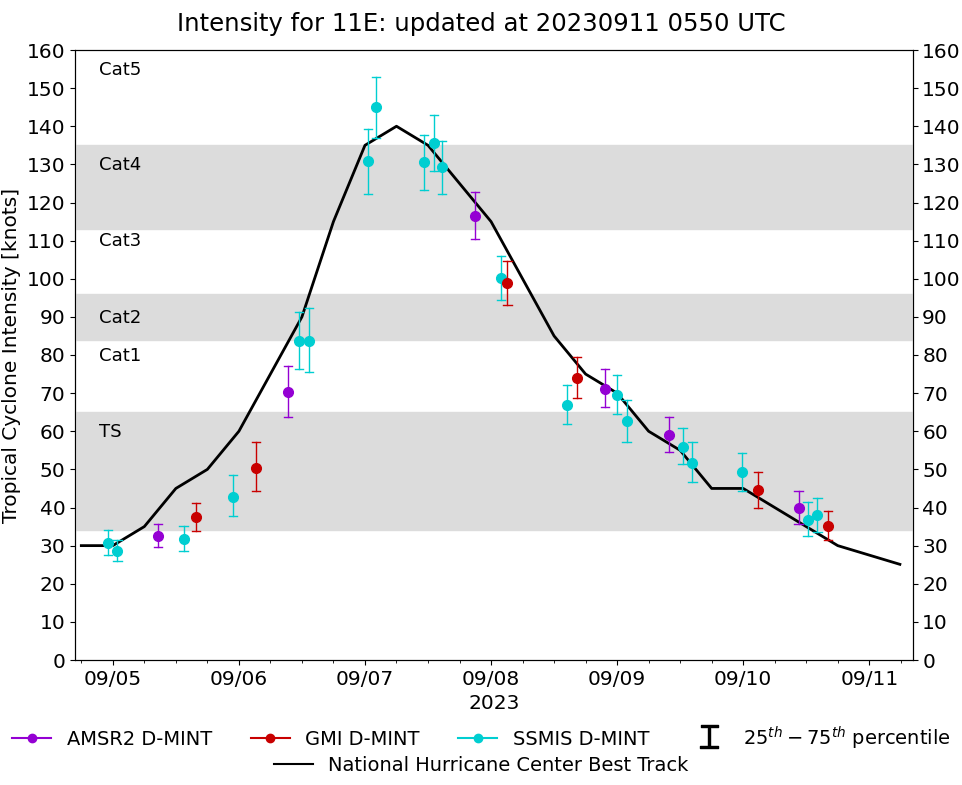 |
D-MINT HISTORY FILE for 2023_11E
| Date | Time | MW Sensor | MSLP | Vmax (30th-70th percentile average) | Vmax 25th percentile | Vmax 75th percentile | Image |
| 20230910 | 1611 UTC | GMI | 1007 hPa | 35 kts | 31 kts | 39 kts |  |
| 20230910 | 1407 UTC | SSMISF16 | 1004 hPa | 38 kts | 34 kts | 43 kts |  |
| 20230910 | 1215 UTC | SSMISF18 | 1005 hPa | 37 kts | 33 kts | 41 kts |  |
| 20230910 | 1033 UTC | AMSR2 | 1004 hPa | 40 kts | 36 kts | 44 kts |  |
| 20230910 | 0251 UTC | GMI | 1000 hPa | 44 kts | 40 kts | 49 kts |  |
| 20230909 | 2344 UTC | SSMISF18 | 996 hPa | 49 kts | 44 kts | 54 kts |  |
| 20230909 | 1421 UTC | SSMISF16 | 995 hPa | 52 kts | 47 kts | 57 kts |  |
| 20230909 | 1228 UTC | SSMISF18 | 993 hPa | 56 kts | 51 kts | 61 kts |  |
| 20230909 | 0951 UTC | AMSR2 | 991 hPa | 59 kts | 54 kts | 64 kts |  |
| 20230909 | 0149 UTC | SSMISF16 | 987 hPa | 63 kts | 57 kts | 68 kts |  |
| 20230908 | 2356 UTC | SSMISF18 | 982 hPa | 69 kts | 64 kts | 75 kts |  |
| 20230908 | 2140 UTC | AMSR2 | 983 hPa | 71 kts | 66 kts | 76 kts |  |
| 20230908 | 1621 UTC | GMI | 983 hPa | 74 kts | 69 kts | 79 kts |  |
| 20230908 | 1428 UTC | SSMISF17 | 983 hPa | 67 kts | 62 kts | 72 kts |  |
| 20230908 | 0306 UTC | GMI | 958 hPa | 99 kts | 93 kts | 105 kts |  |
| 20230908 | 0155 UTC | SSMISF17 | 960 hPa | 100 kts | 94 kts | 106 kts |  |
| 20230907 | 2057 UTC | AMSR2 | 949 hPa | 116 kts | 110 kts | 123 kts |  |
| 20230907 | 1443 UTC | SSMISF17 | 937 hPa | 129 kts | 122 kts | 136 kts |  |
| 20230907 | 1308 UTC | SSMISF16 | 935 hPa | 136 kts | 128 kts | 143 kts |  |
| 20230907 | 1115 UTC | SSMISF18 | 932 hPa | 131 kts | 123 kts | 138 kts |  |
| 20230907 | 0208 UTC | SSMISF17 | 932 hPa | 145 kts | 137 kts | 153 kts |  |
| 20230907 | 0032 UTC | SSMISF16 | 936 hPa | 131 kts | 122 kts | 139 kts |  |
| 20230906 | 1321 UTC | SSMISF16 | 973 hPa | 84 kts | 75 kts | 92 kts |  |
| 20230906 | 1128 UTC | SSMISF18 | 985 hPa | 84 kts | 76 kts | 91 kts |  |
| 20230906 | 0922 UTC | AMSR2 | 985 hPa | 70 kts | 64 kts | 77 kts |  |
| 20230906 | 0316 UTC | GMI | 997 hPa | 50 kts | 44 kts | 57 kts |  |
| 20230905 | 2252 UTC | SSMISF18 | 998 hPa | 43 kts | 38 kts | 48 kts |  |
| 20230905 | 1551 UTC | GMI | 1001 hPa | 37 kts | 34 kts | 41 kts |  |
| 20230905 | 1329 UTC | SSMISF17 | 1005 hPa | 32 kts | 29 kts | 35 kts |  |
| 20230905 | 0839 UTC | AMSR2 | 1004 hPa | 32 kts | 30 kts | 36 kts |  |
| 20230905 | 0053 UTC | SSMISF17 | 1004 hPa | 29 kts | 26 kts | 32 kts |  |
| 20230904 | 2305 UTC | SSMISF18 | 1004 hPa | 31 kts | 28 kts | 34 kts |  |