|
||
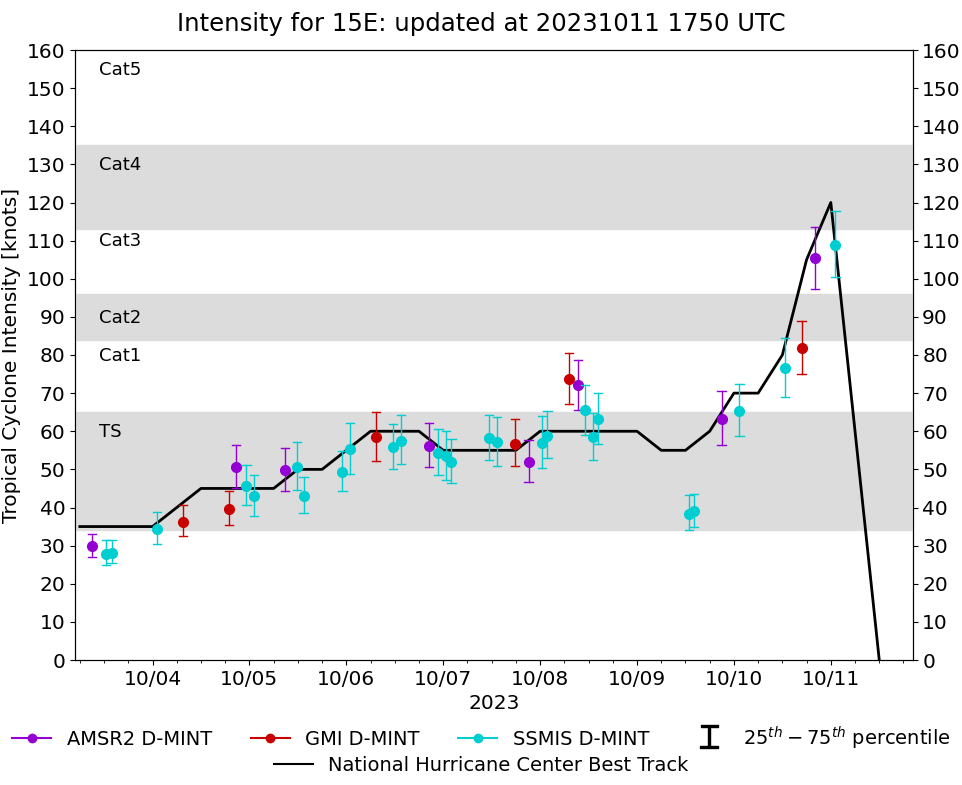 |
D-MINT HISTORY FILE for 2023_15E
| Date | Time | MW Sensor | MSLP | Vmax (30th-70th percentile average) | Vmax 25th percentile | Vmax 75th percentile | Image |
| 20231011 | 0108 UTC | SSMISF17 | 953 hPa | 109 kts | 100 kts | 118 kts | 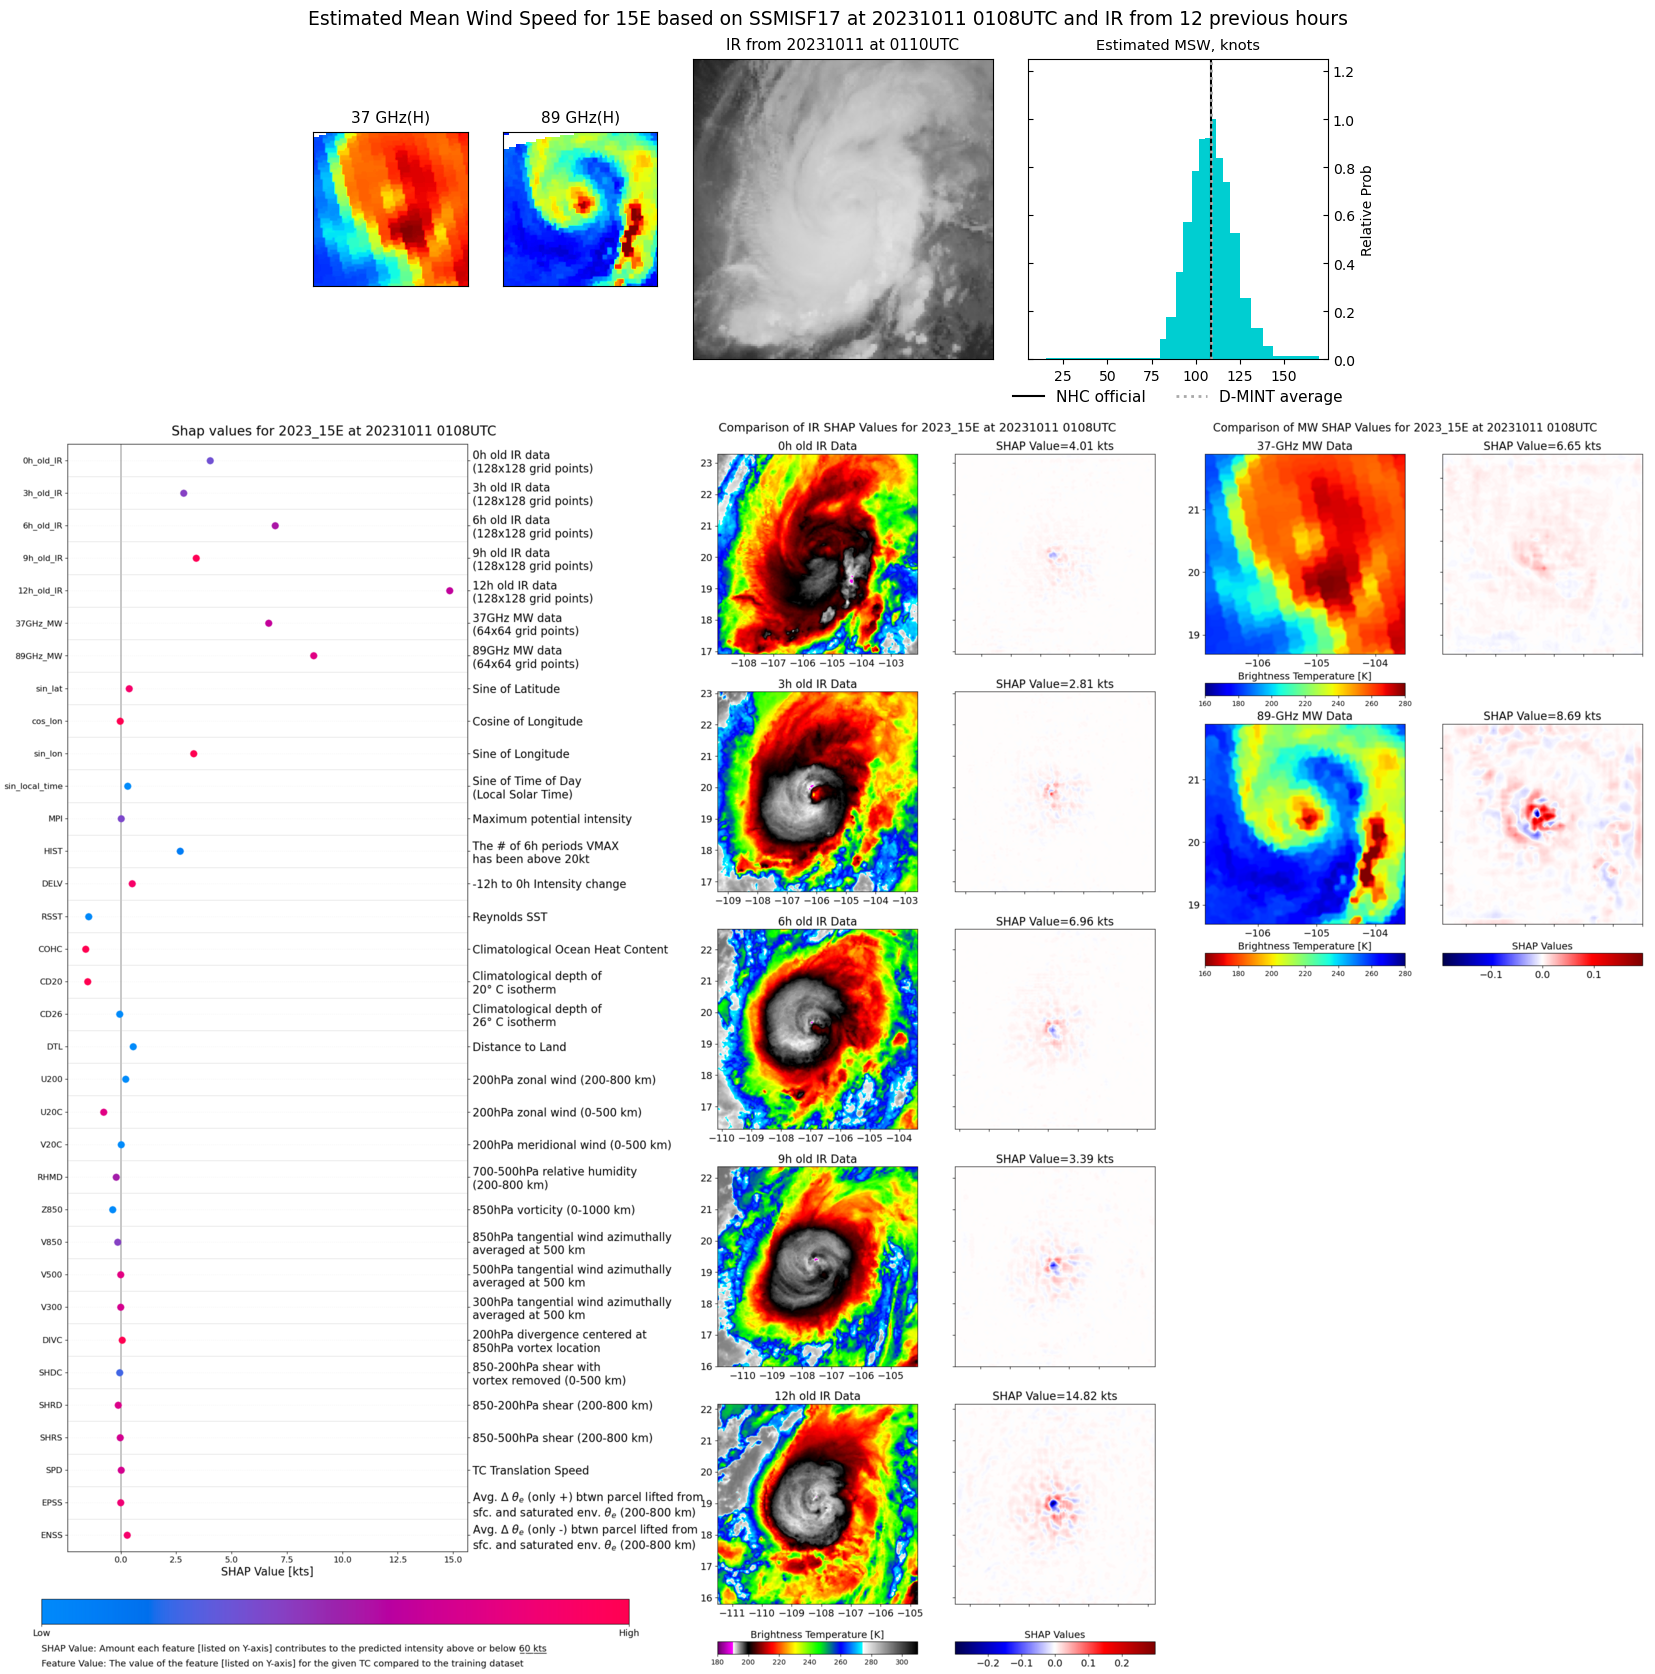 |
| 20231010 | 2002 UTC | AMSR2 | 949 hPa | 105 kts | 97 kts | 114 kts | 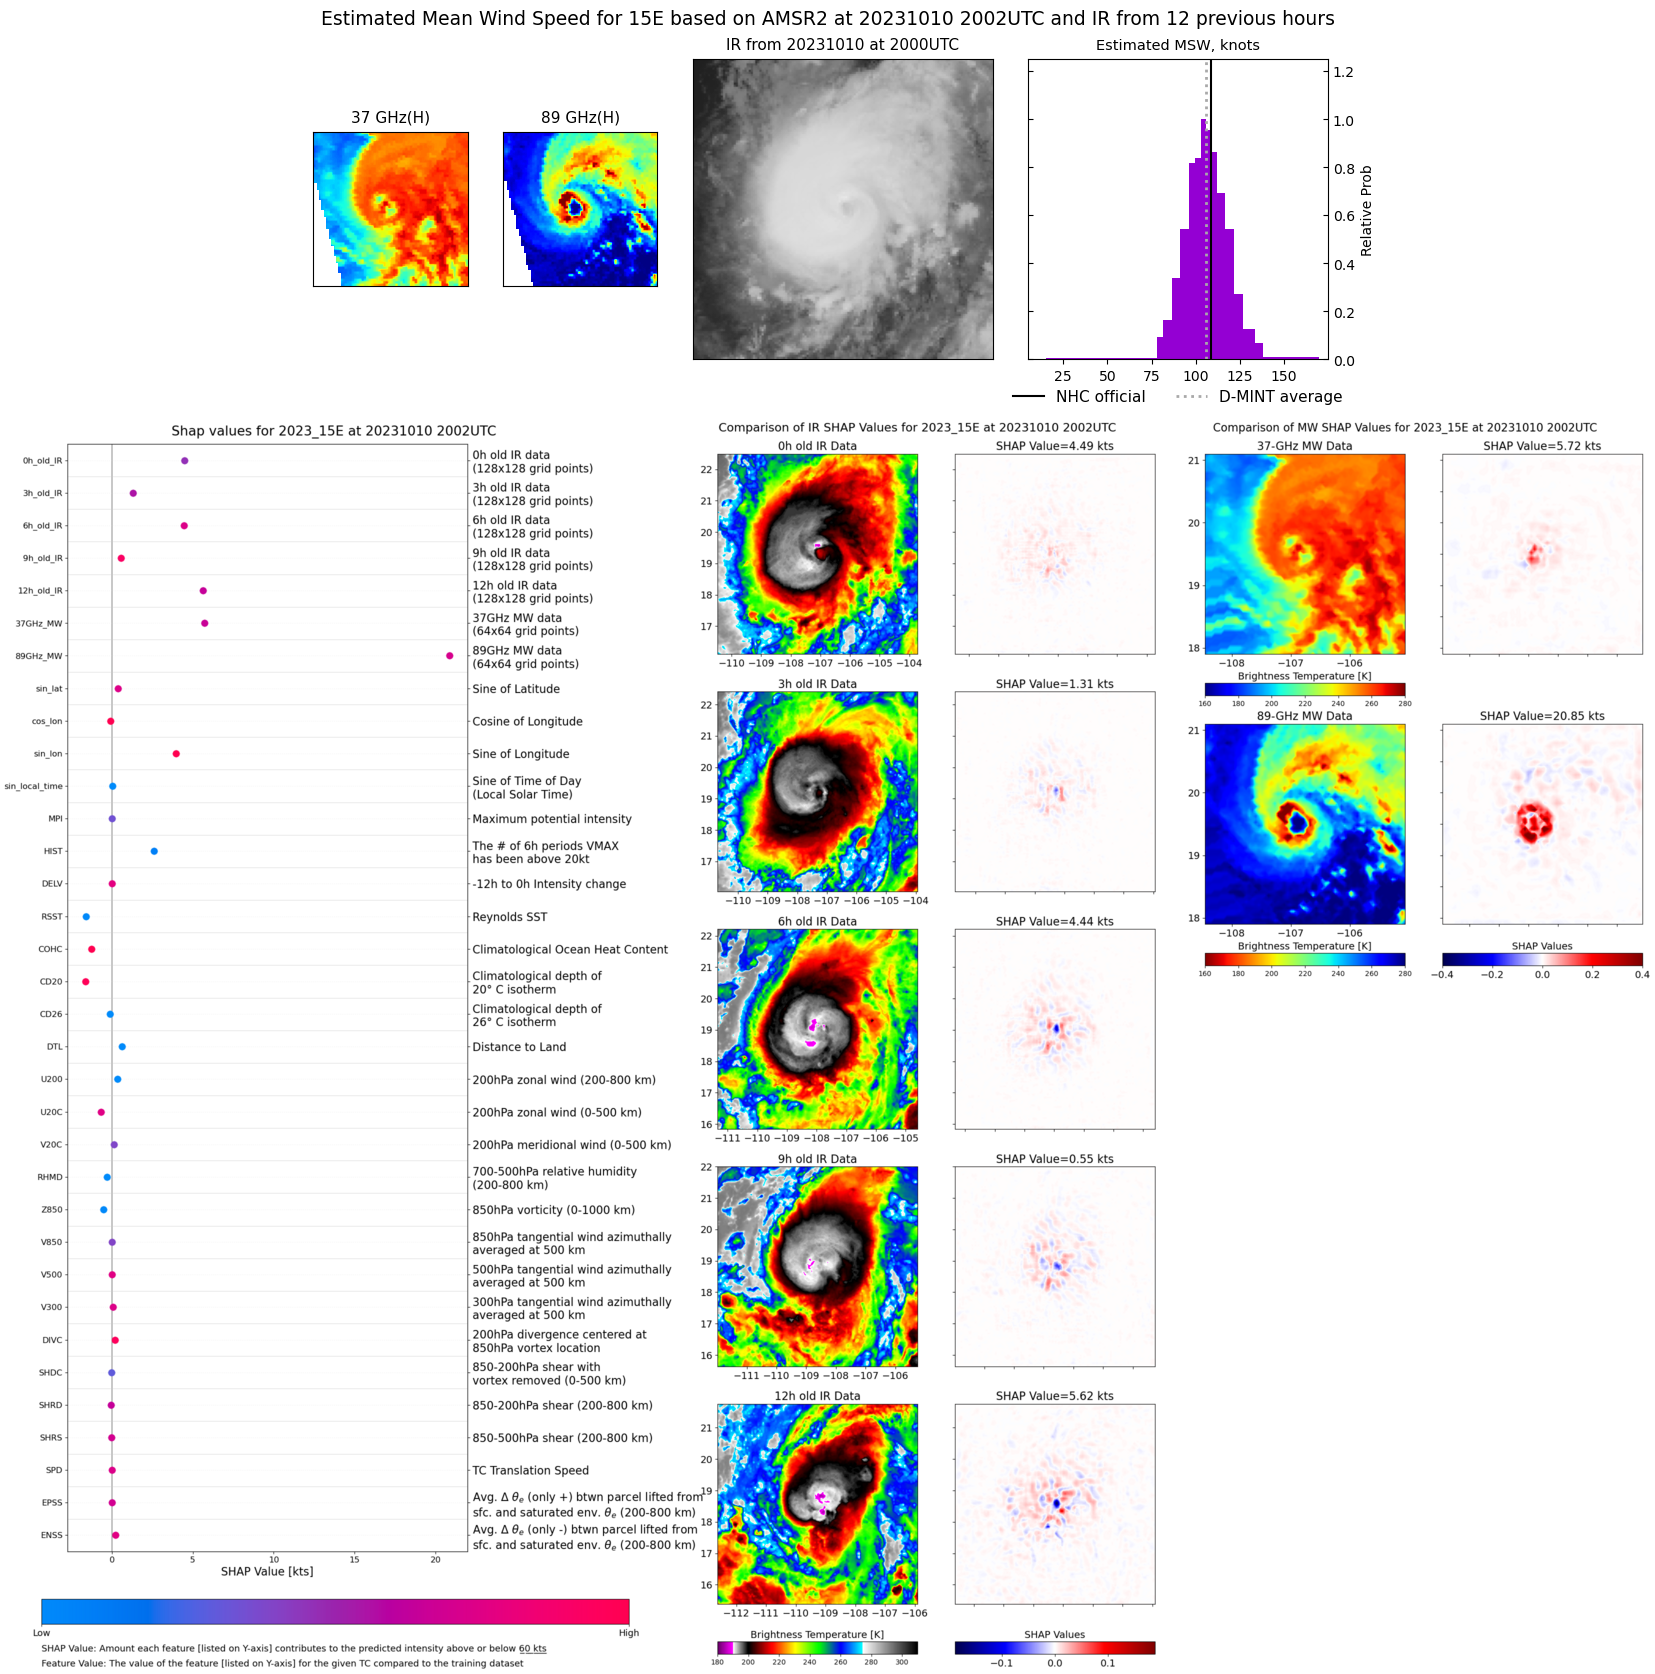 |
| 20231010 | 1646 UTC | GMI | 970 hPa | 82 kts | 75 kts | 89 kts | 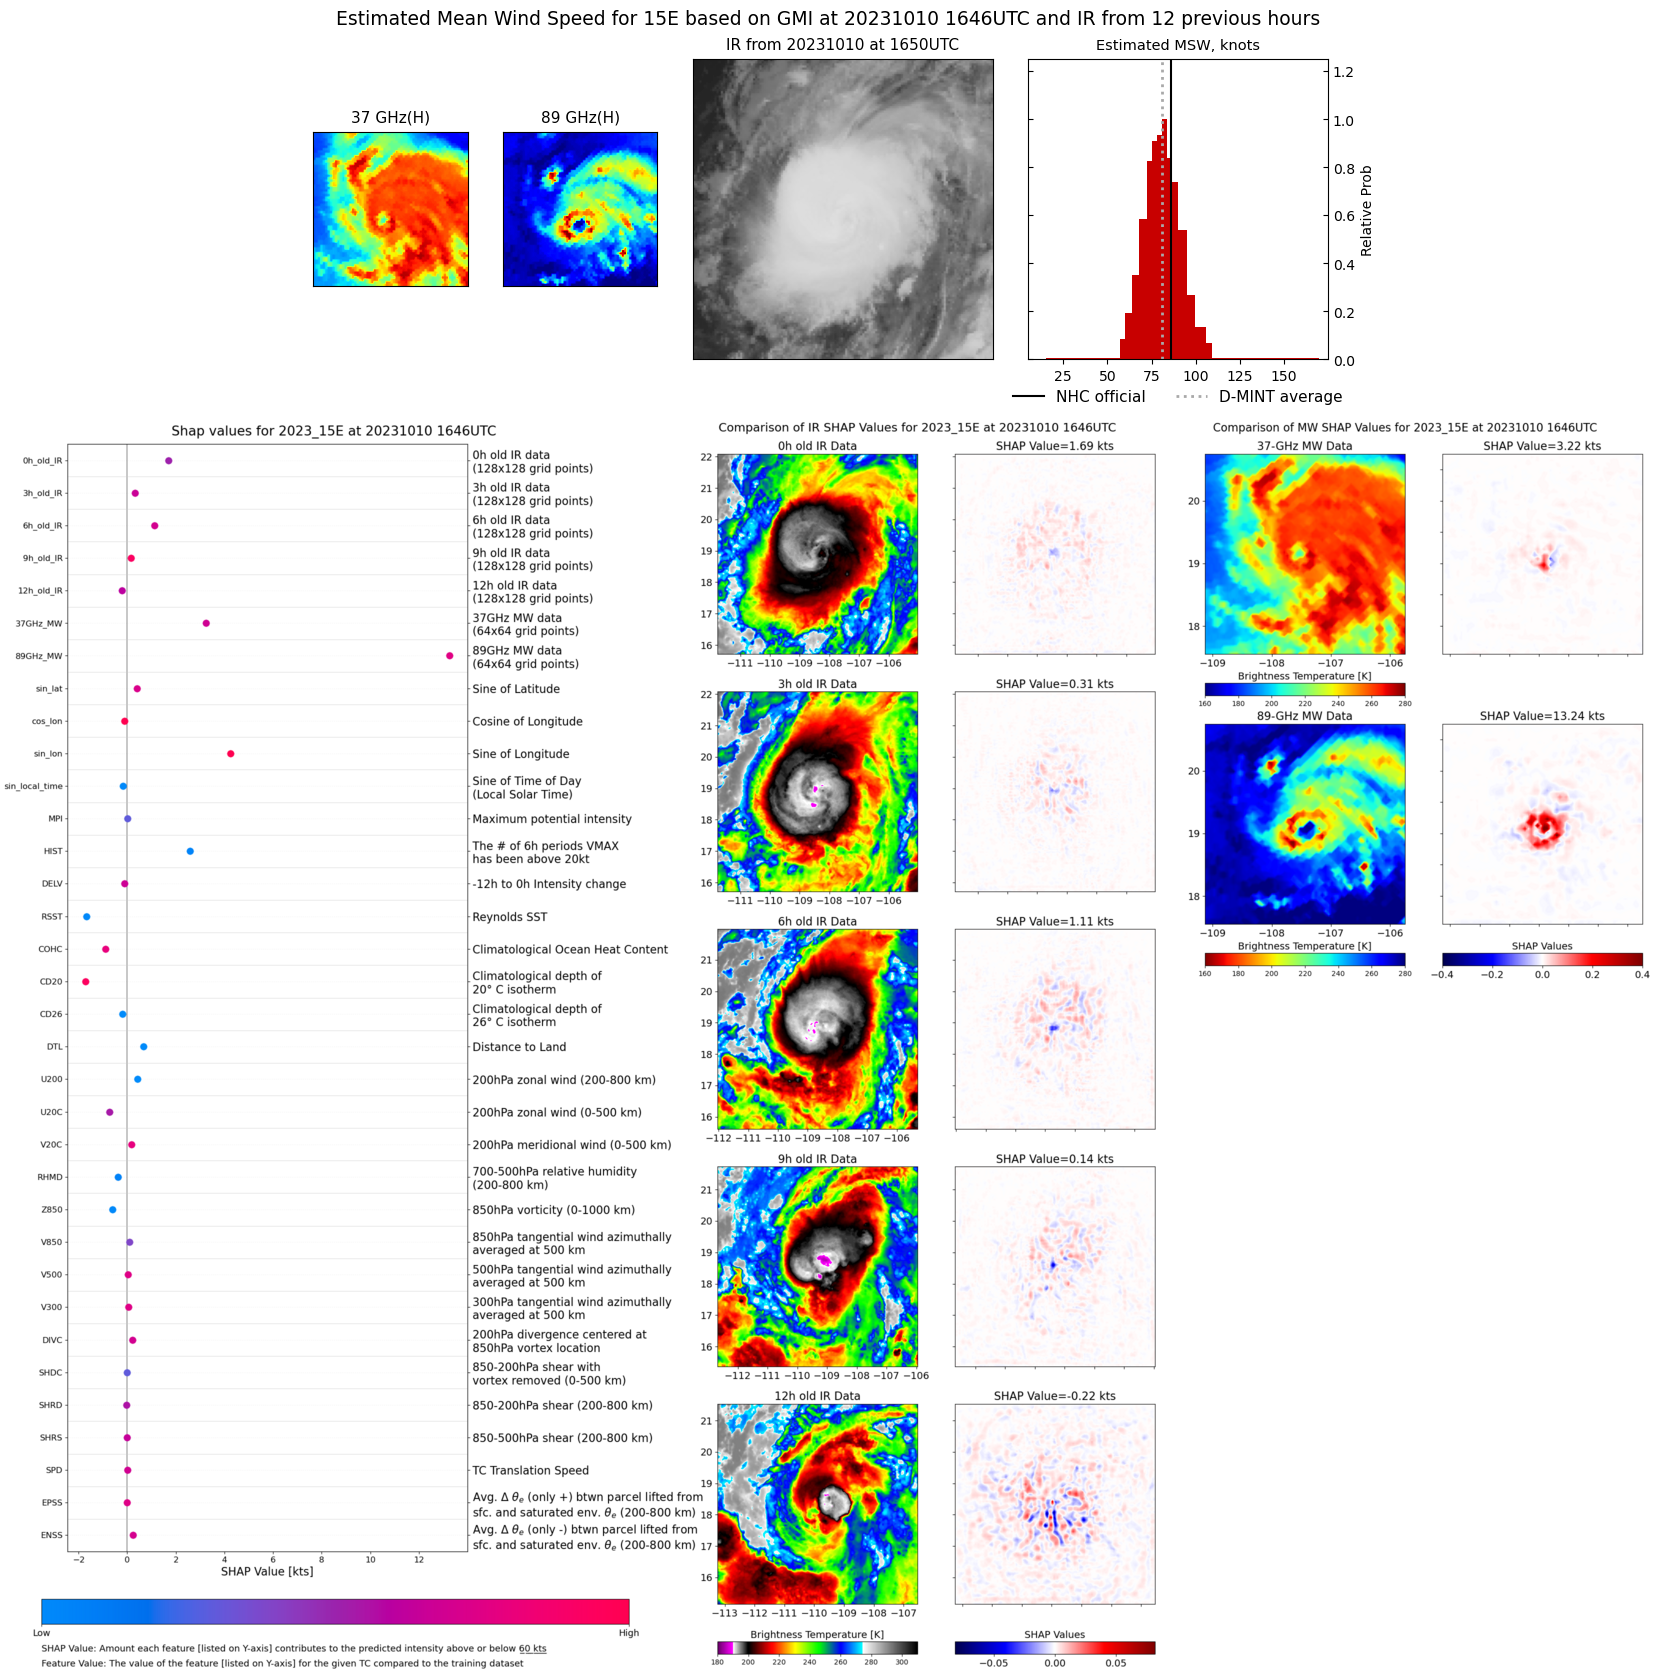 |
| 20231010 | 1236 UTC | SSMISF16 | 972 hPa | 77 kts | 69 kts | 84 kts | 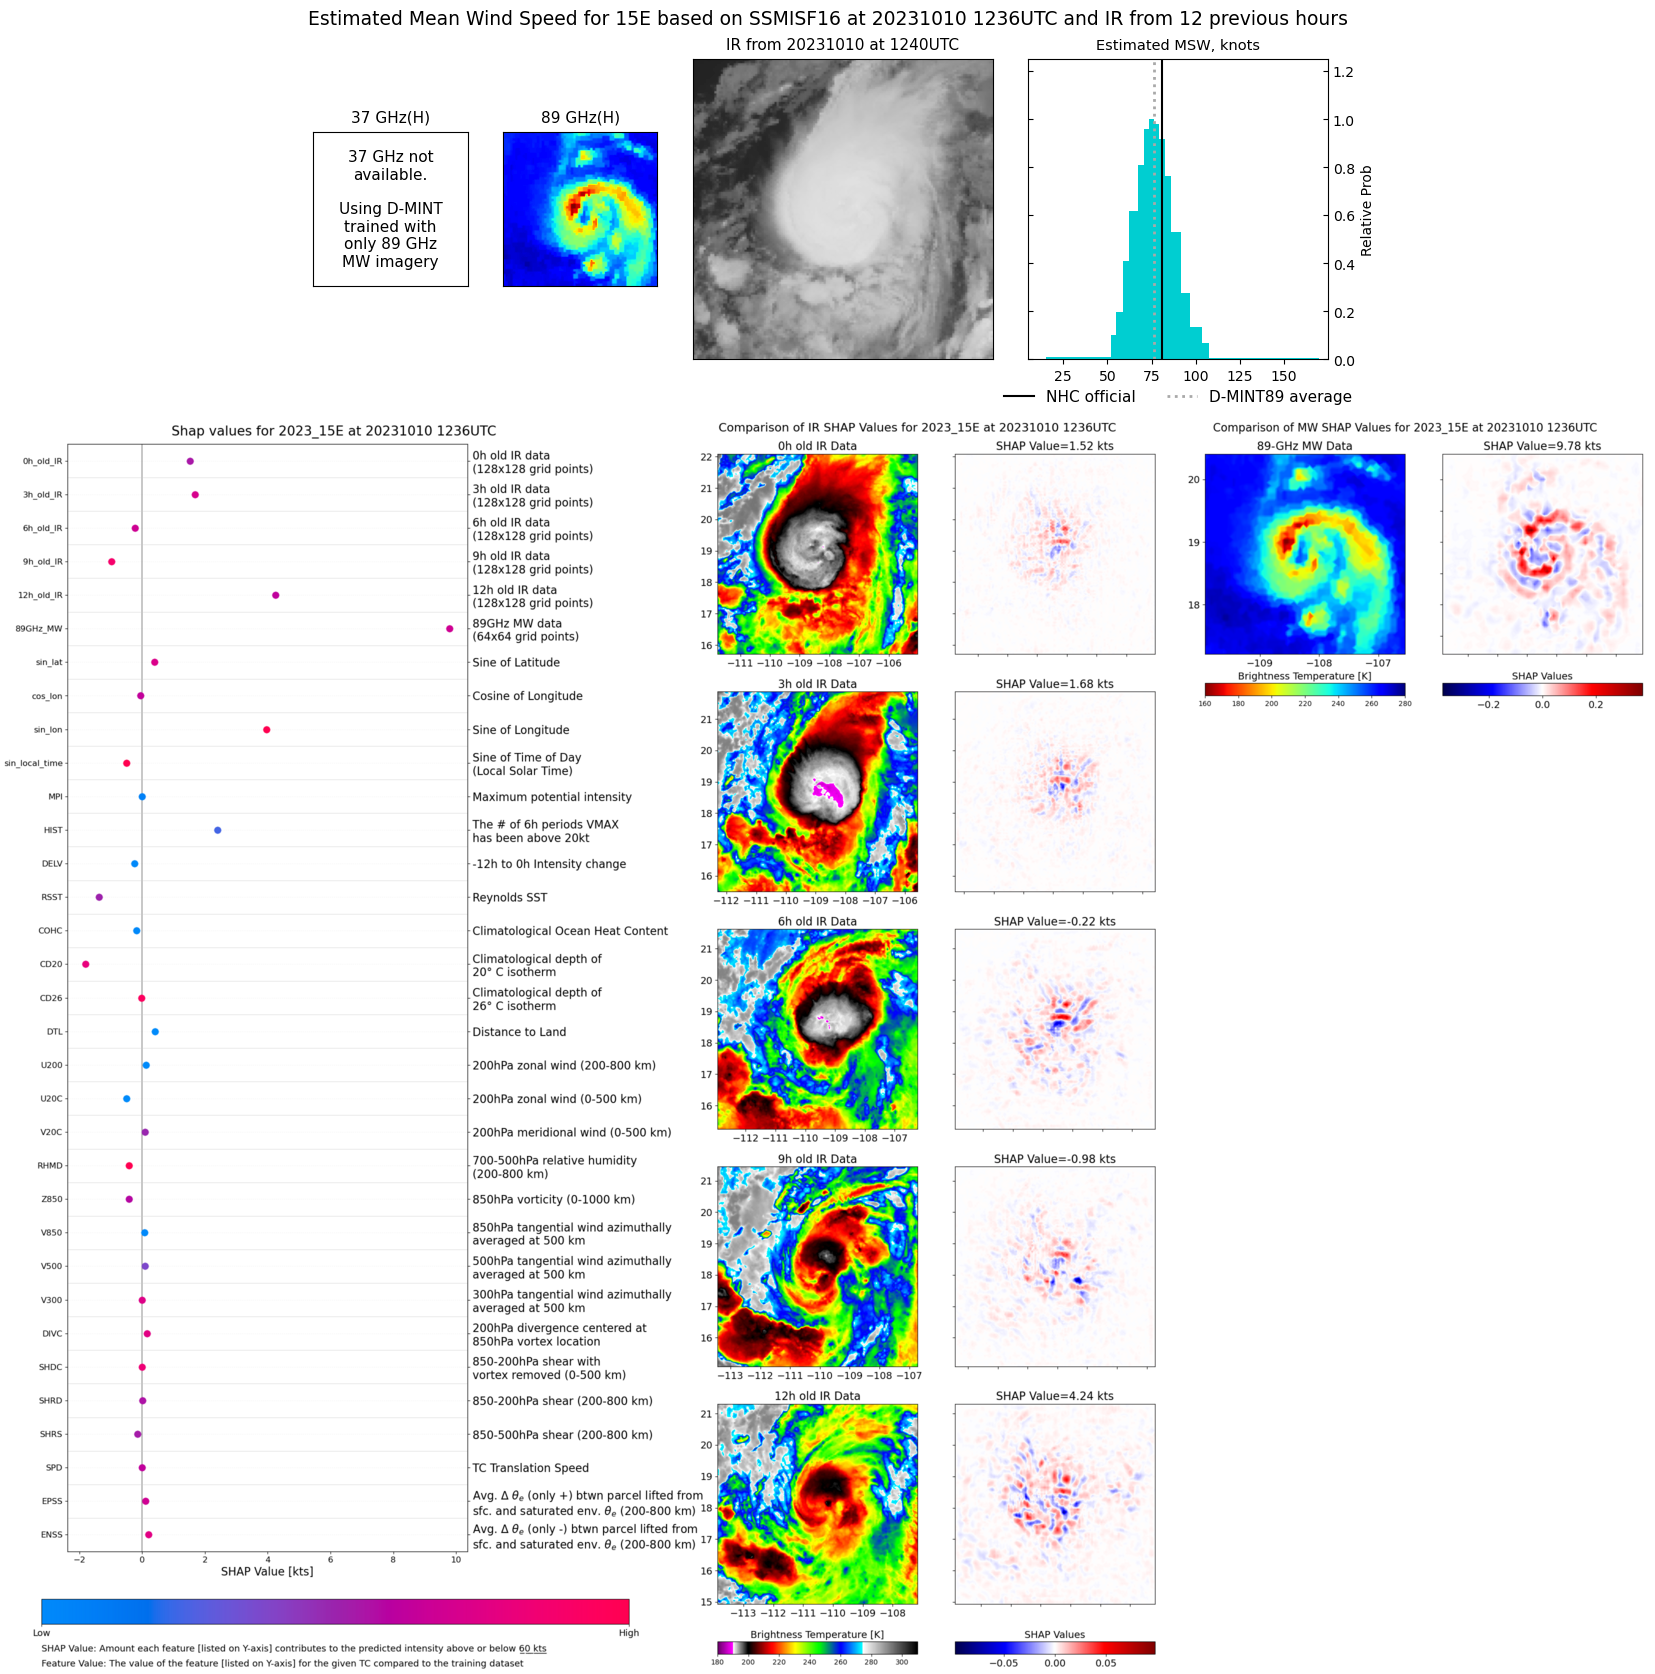 |
| 20231010 | 0122 UTC | SSMISF17 | 984 hPa | 65 kts | 59 kts | 72 kts | 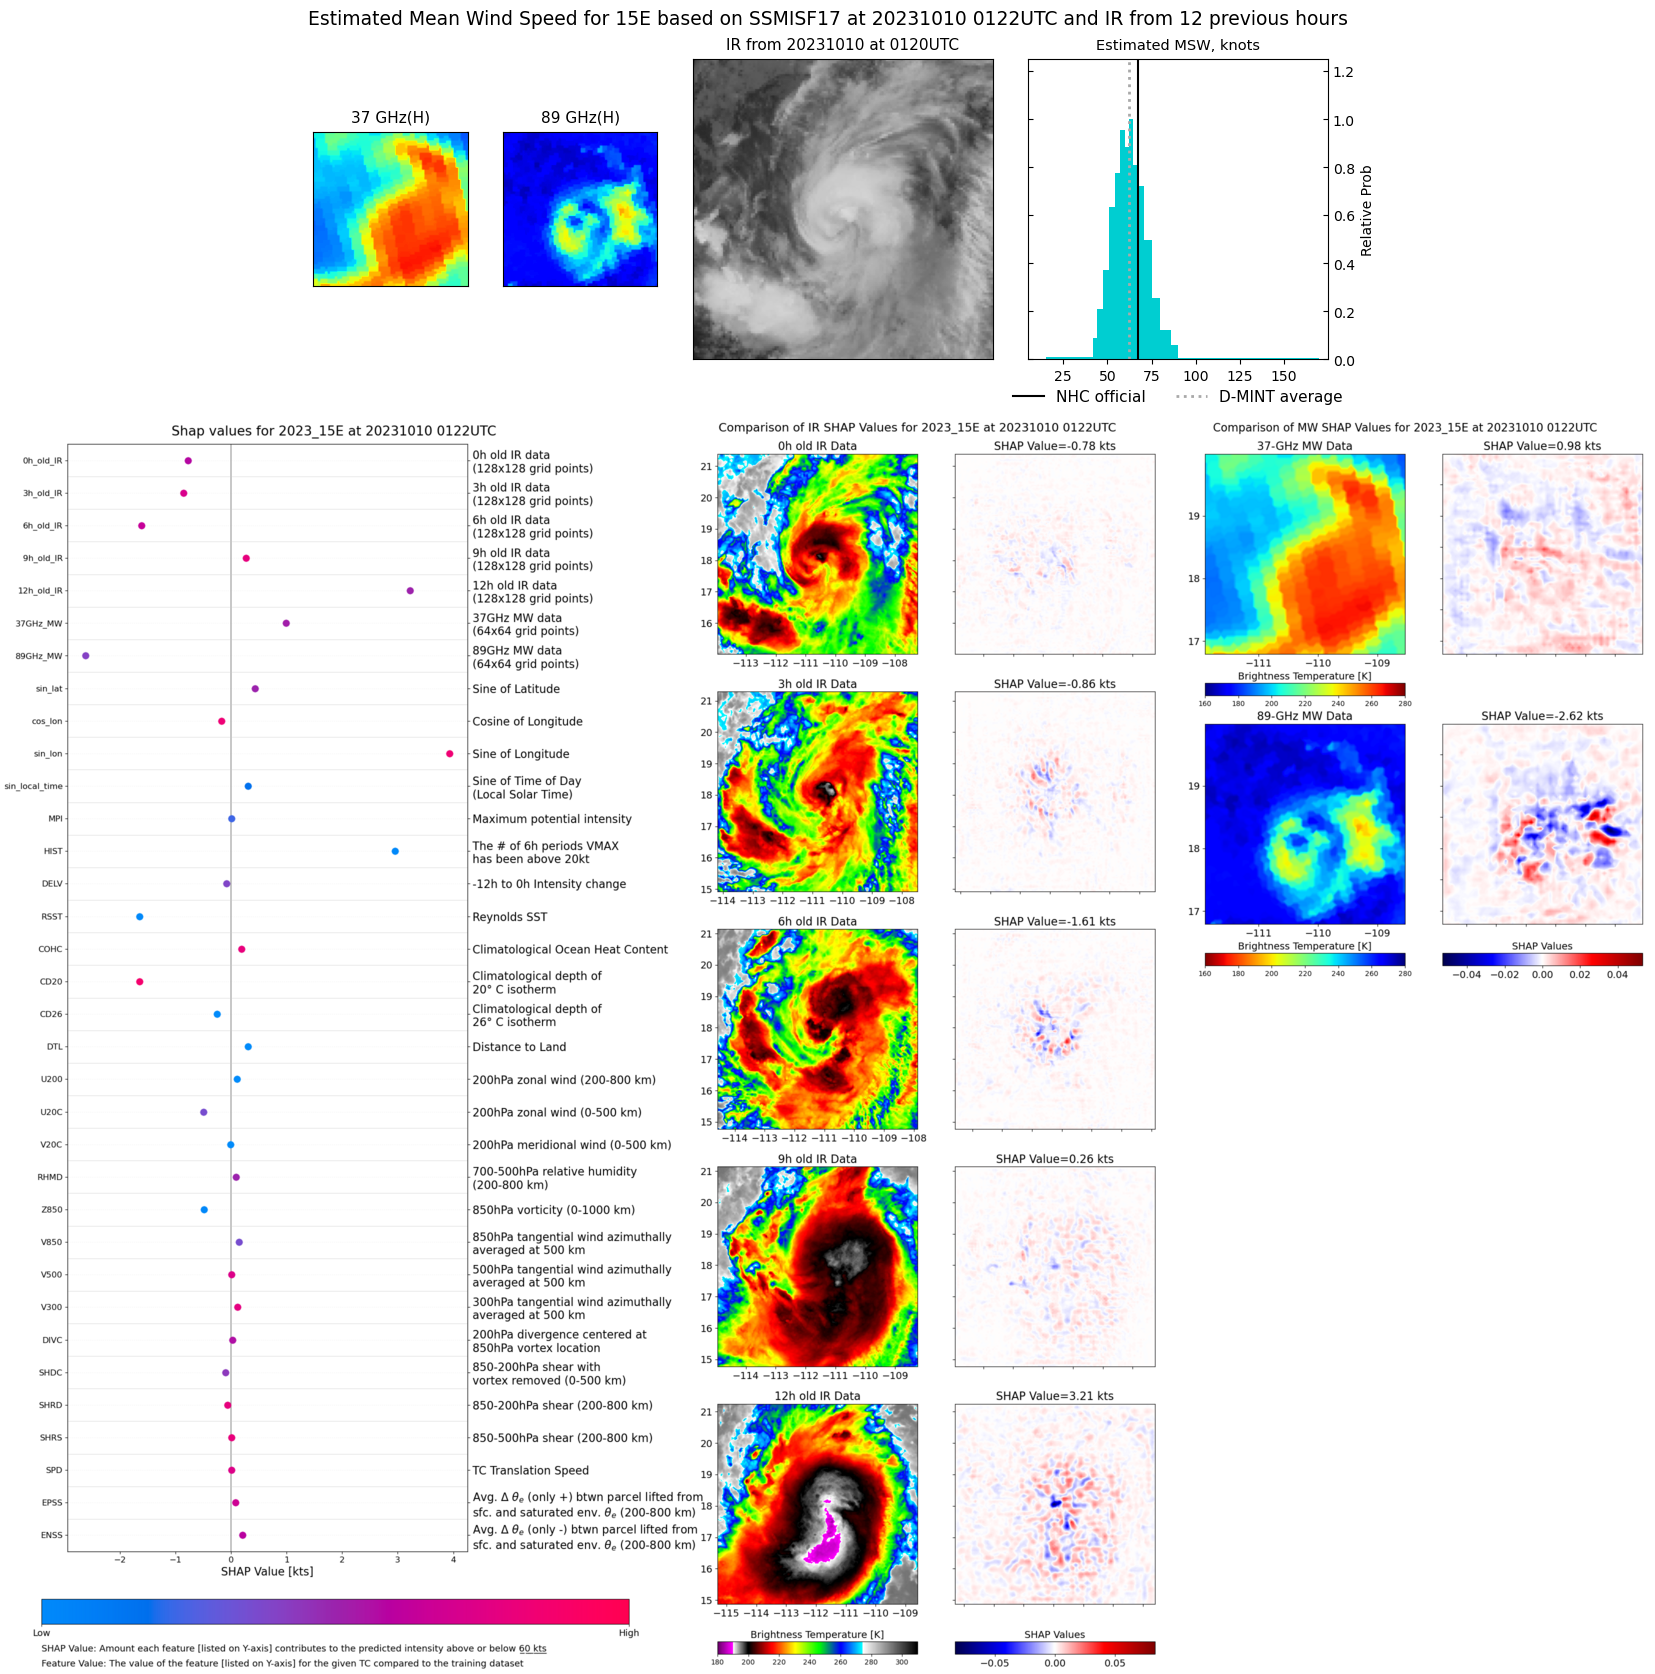 |
| 20231009 | 2056 UTC | AMSR2 | 991 hPa | 63 kts | 56 kts | 71 kts | 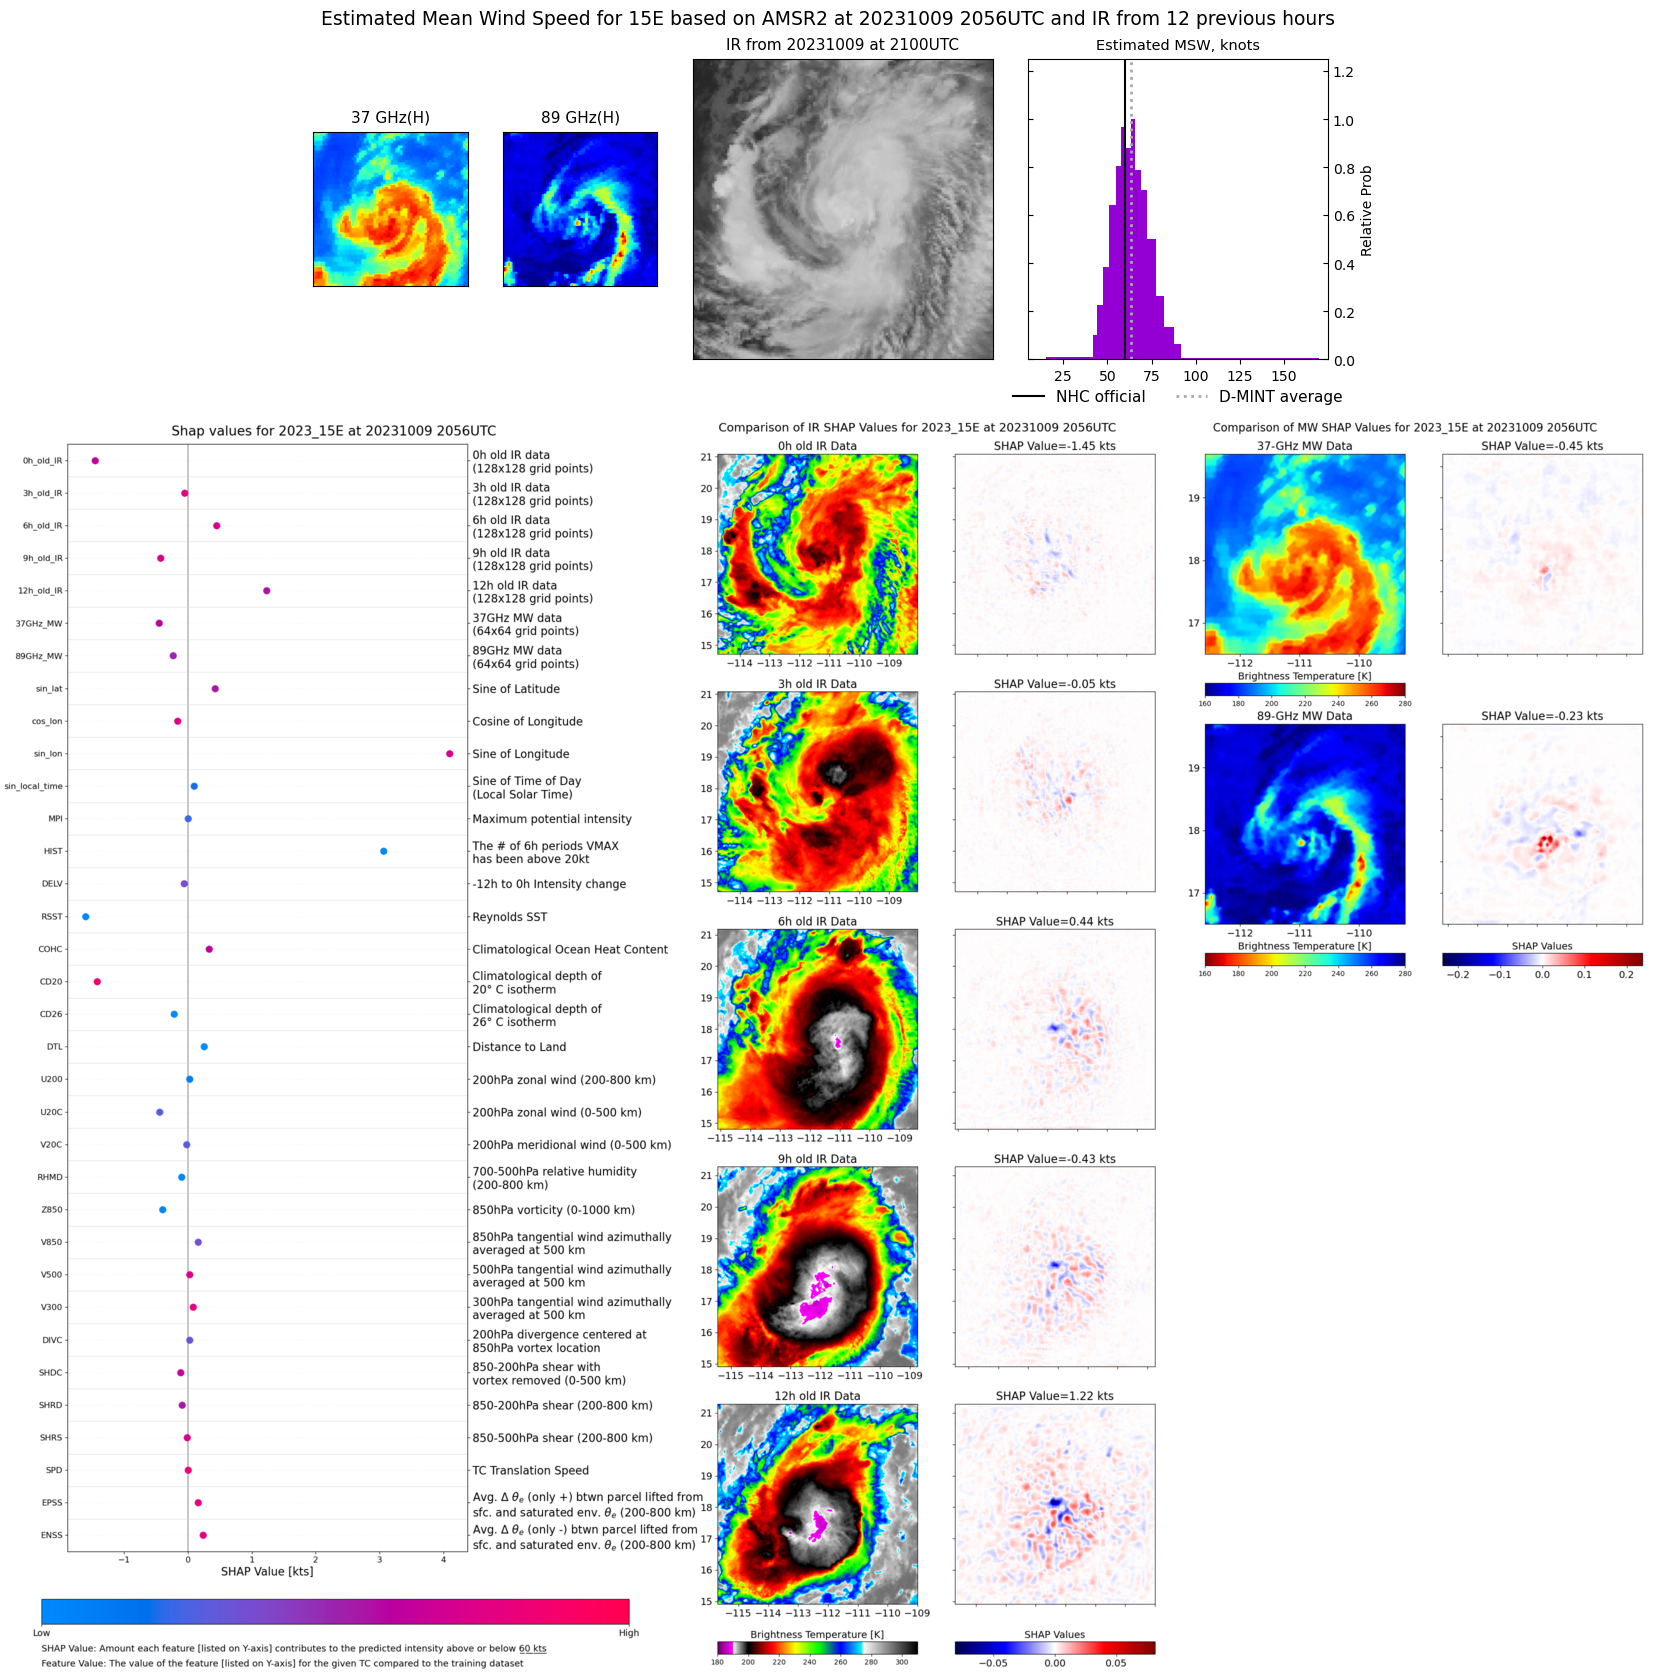 |
| 20231009 | 1409 UTC | SSMISF17 | 1001 hPa | 39 kts | 35 kts | 44 kts | 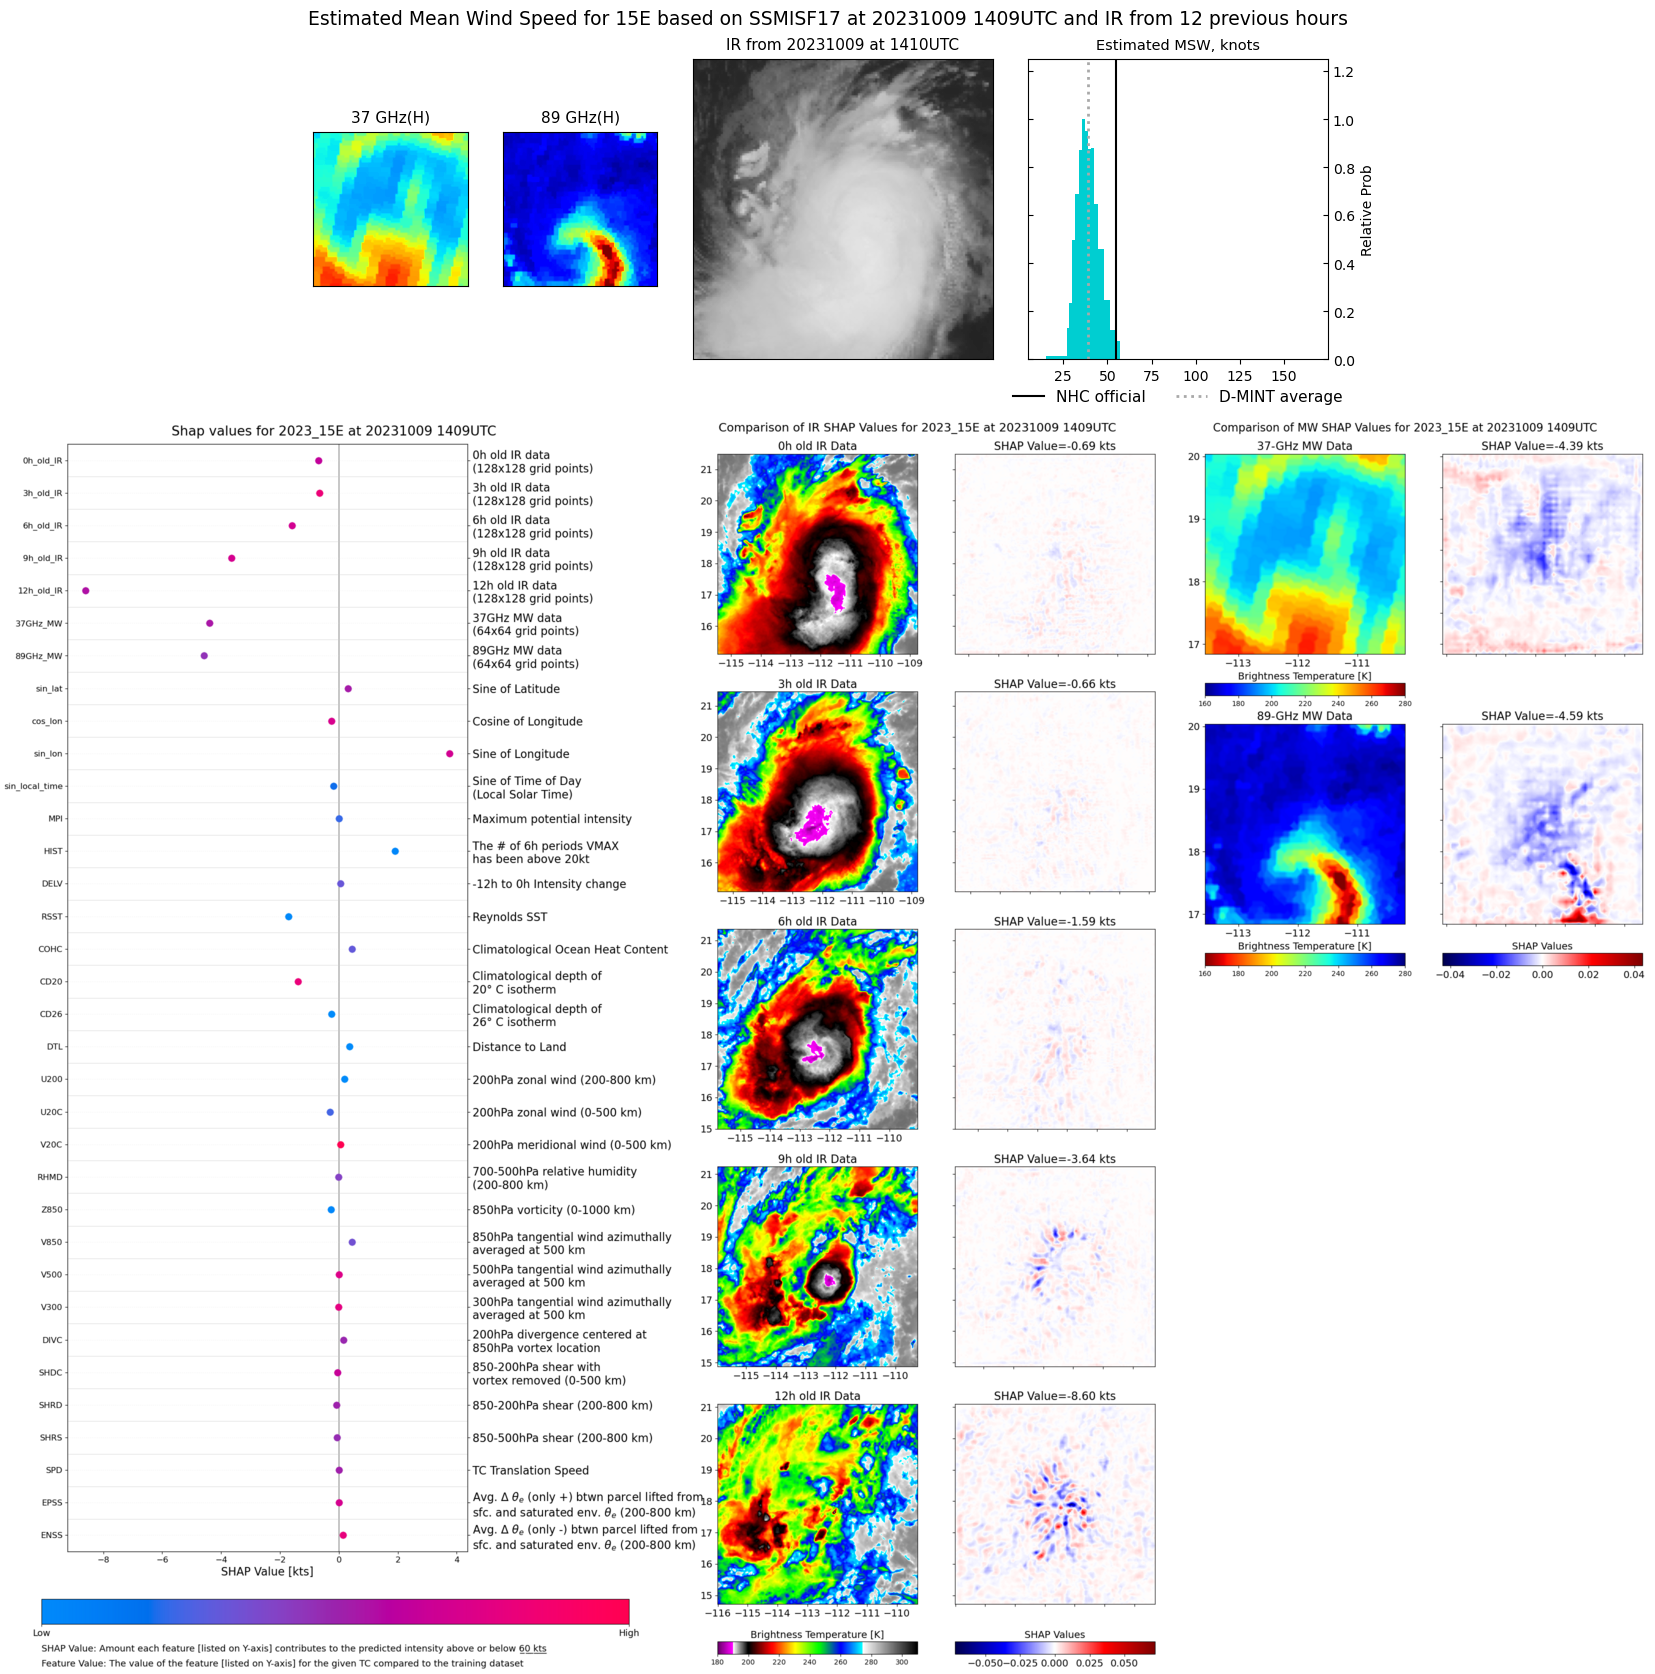 |
| 20231009 | 1249 UTC | SSMISF16 | 1001 hPa | 38 kts | 34 kts | 43 kts | 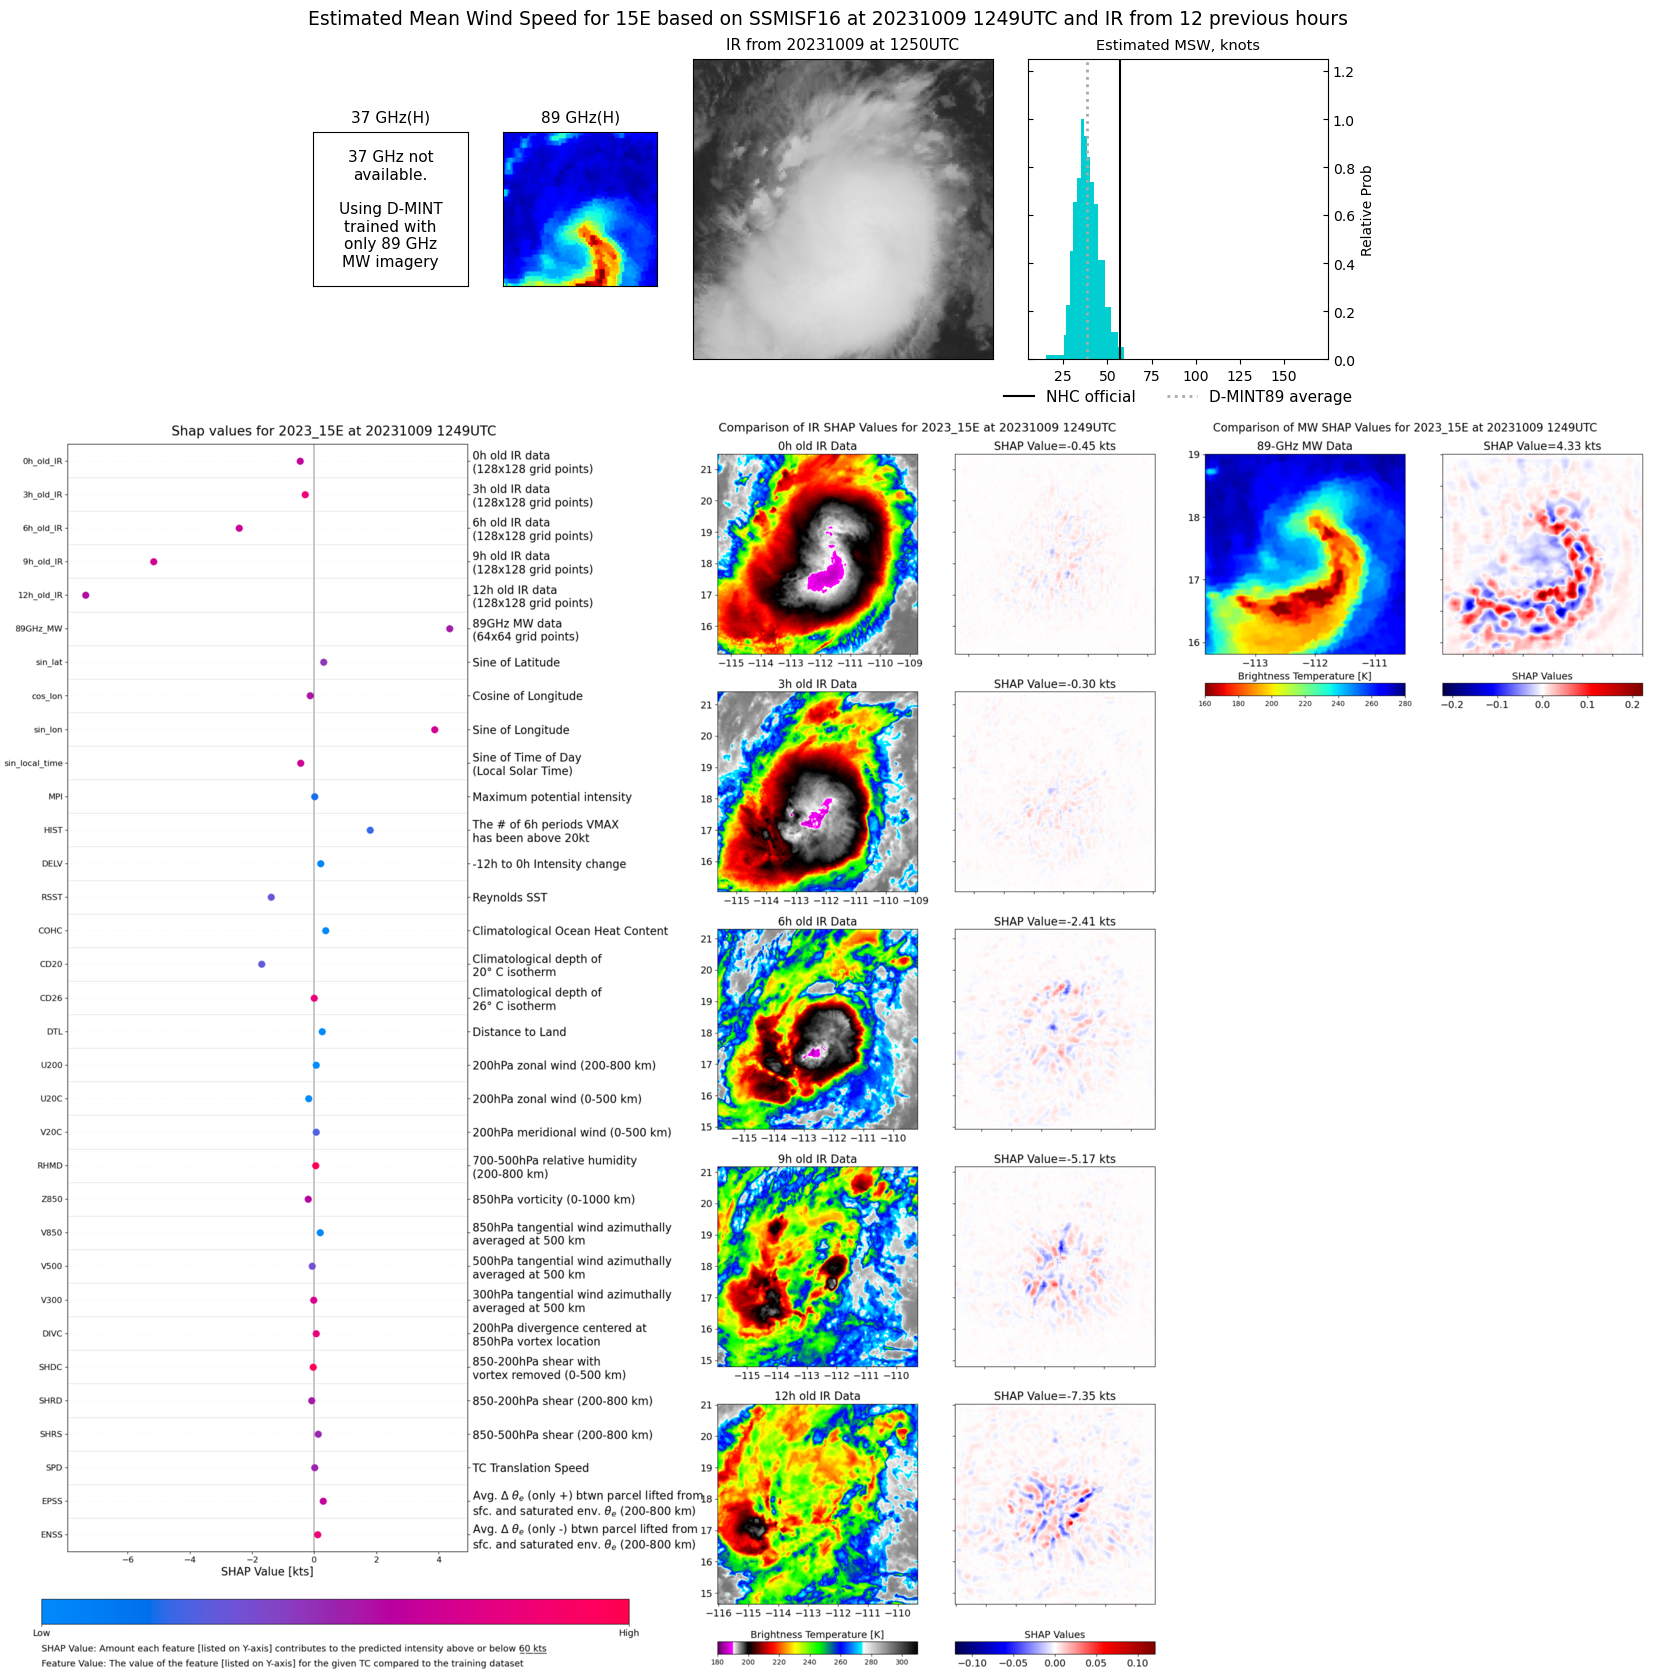 |
| 20231008 | 1423 UTC | SSMISF17 | 989 hPa | 63 kts | 57 kts | 70 kts | 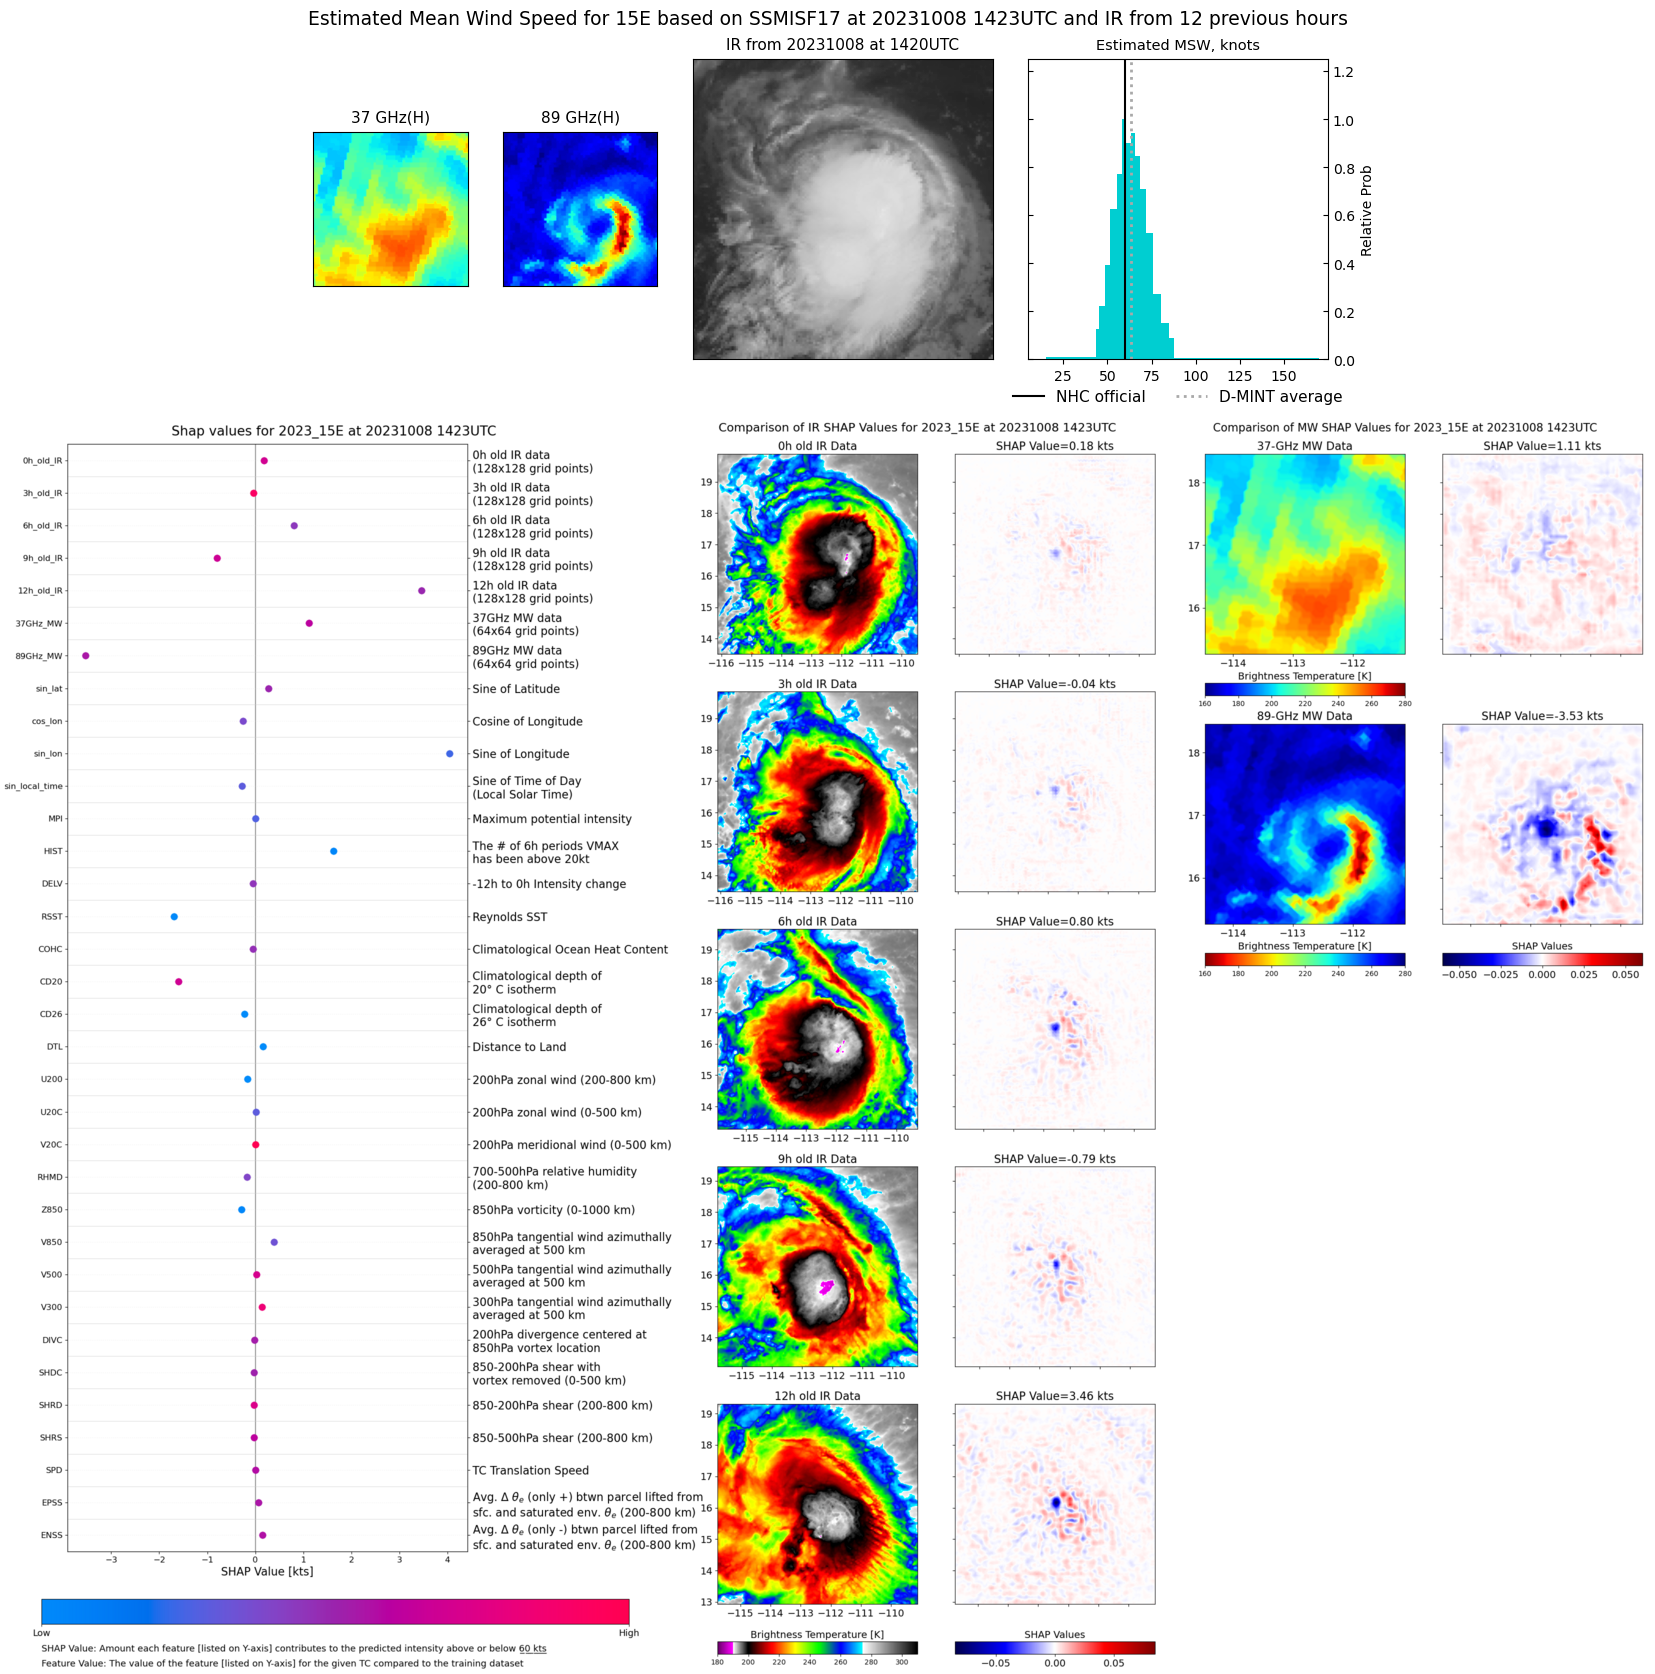 |
| 20231008 | 1302 UTC | SSMISF16 | 991 hPa | 59 kts | 52 kts | 65 kts | 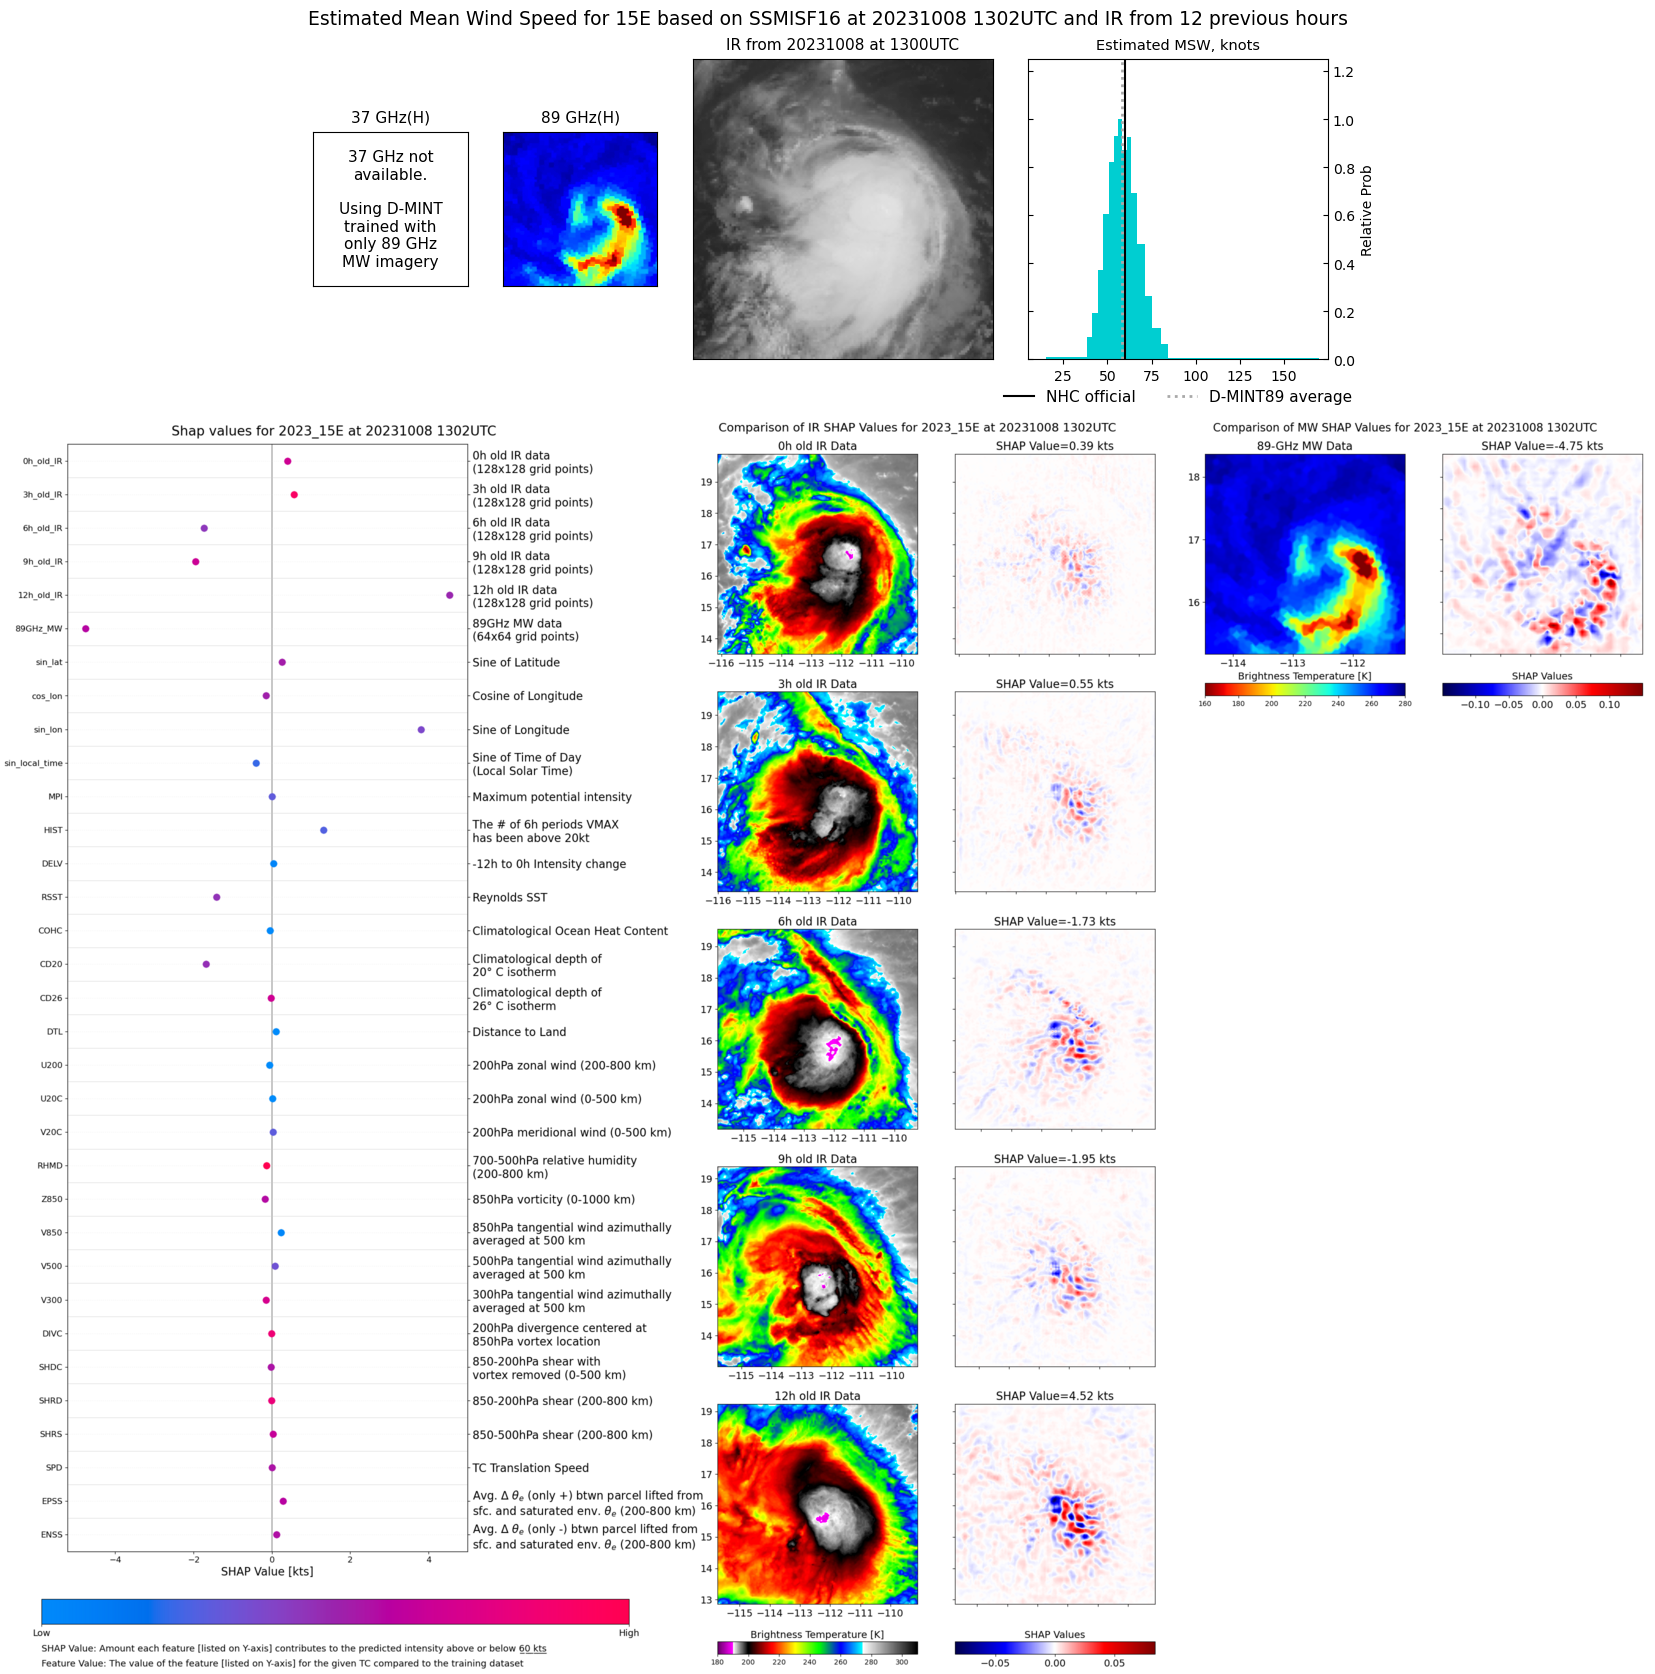 |
| 20231008 | 1111 UTC | SSMISF18 | 990 hPa | 65 kts | 59 kts | 72 kts | 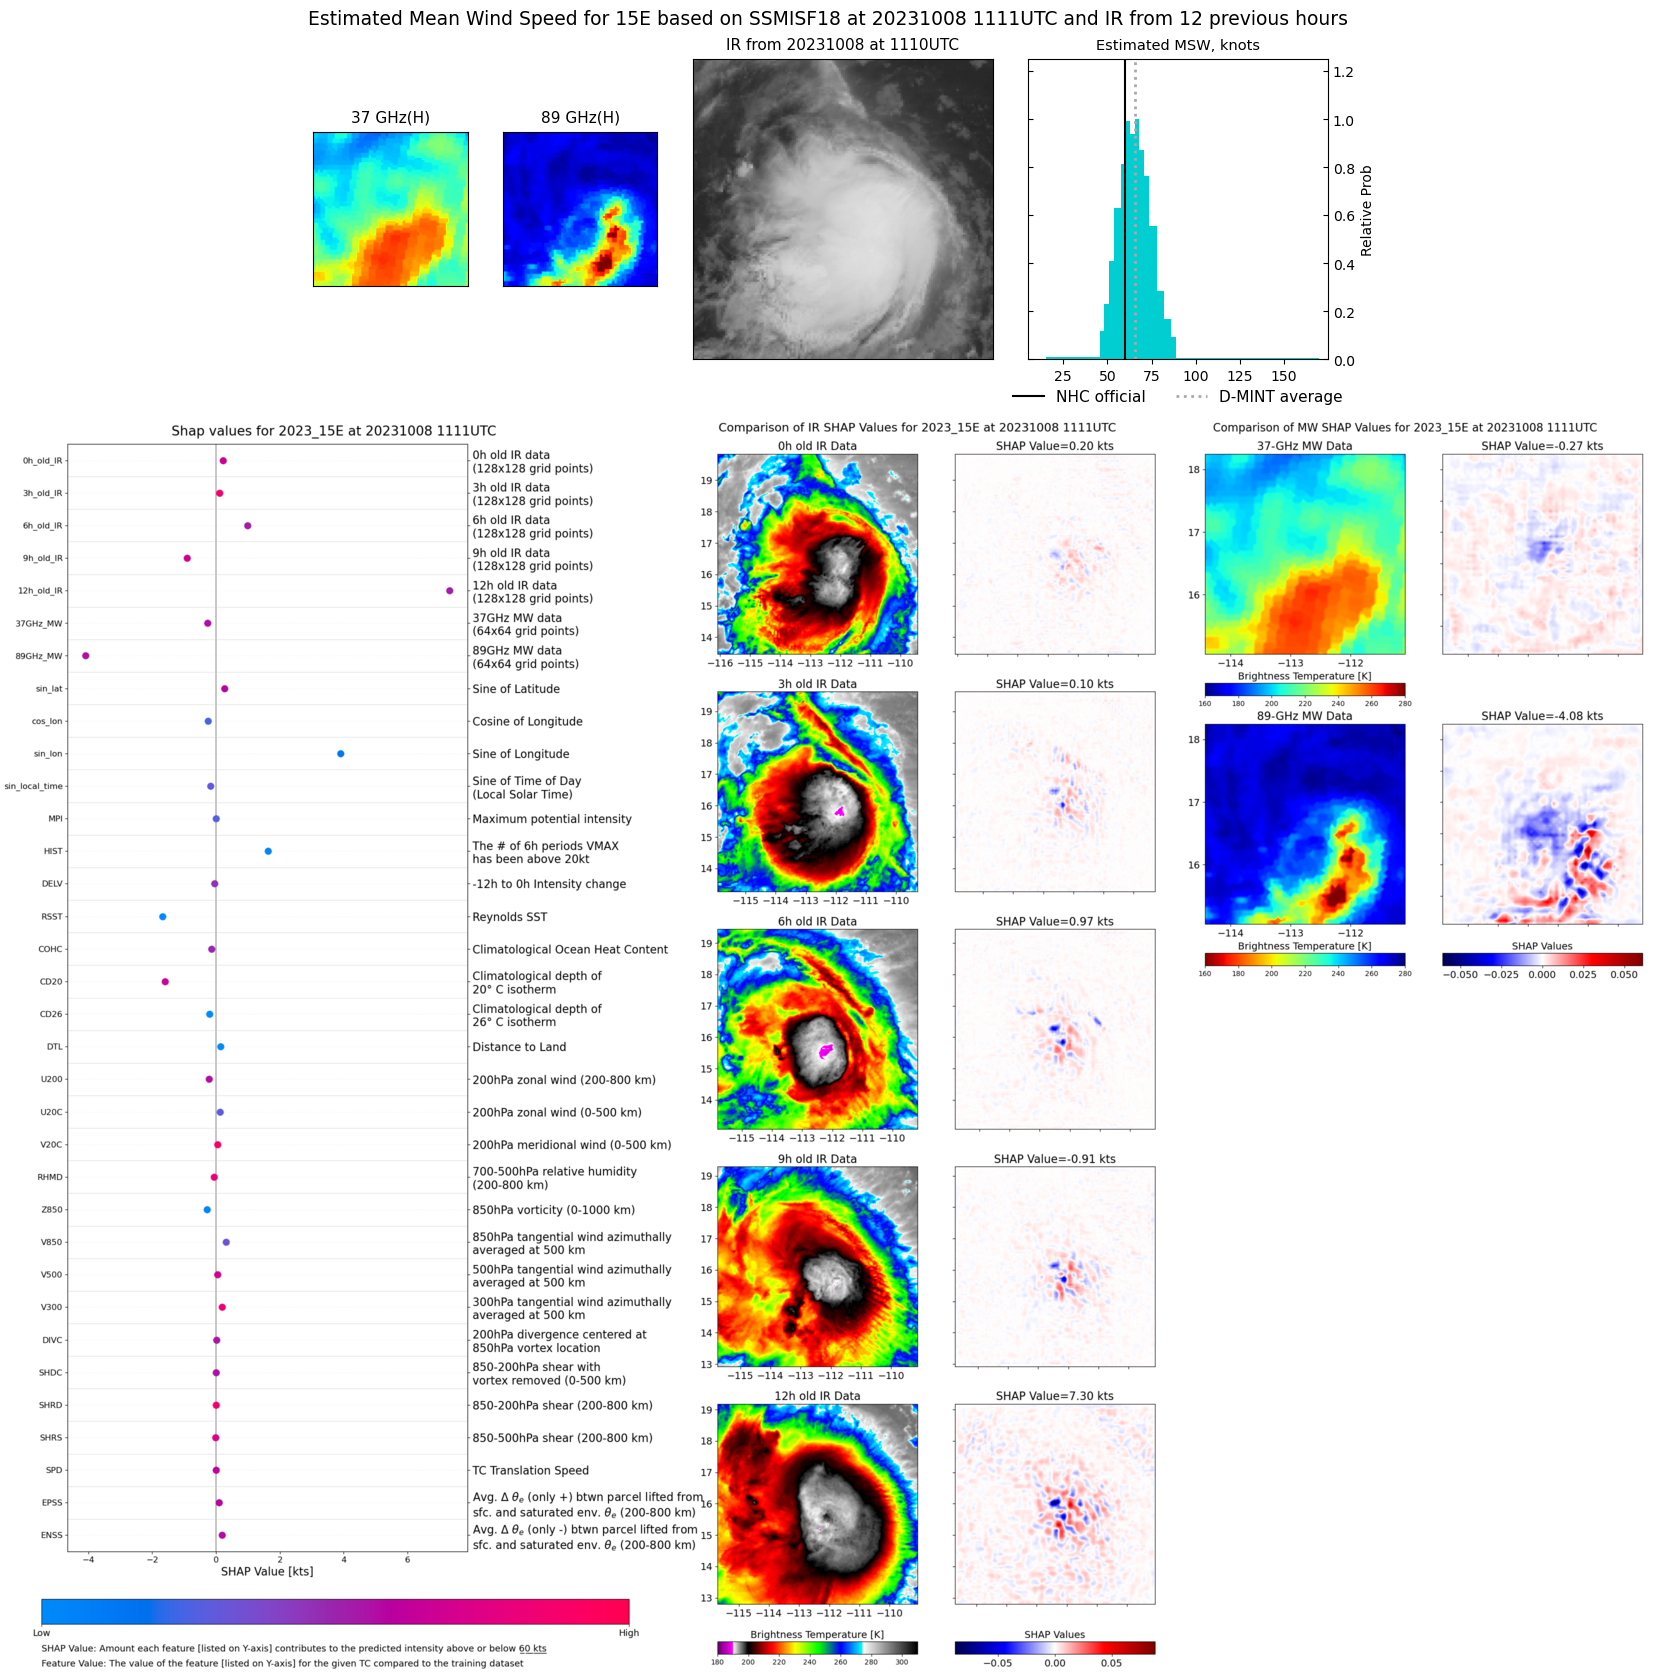 |
| 20231008 | 0921 UTC | AMSR2 | 985 hPa | 72 kts | 66 kts | 79 kts | 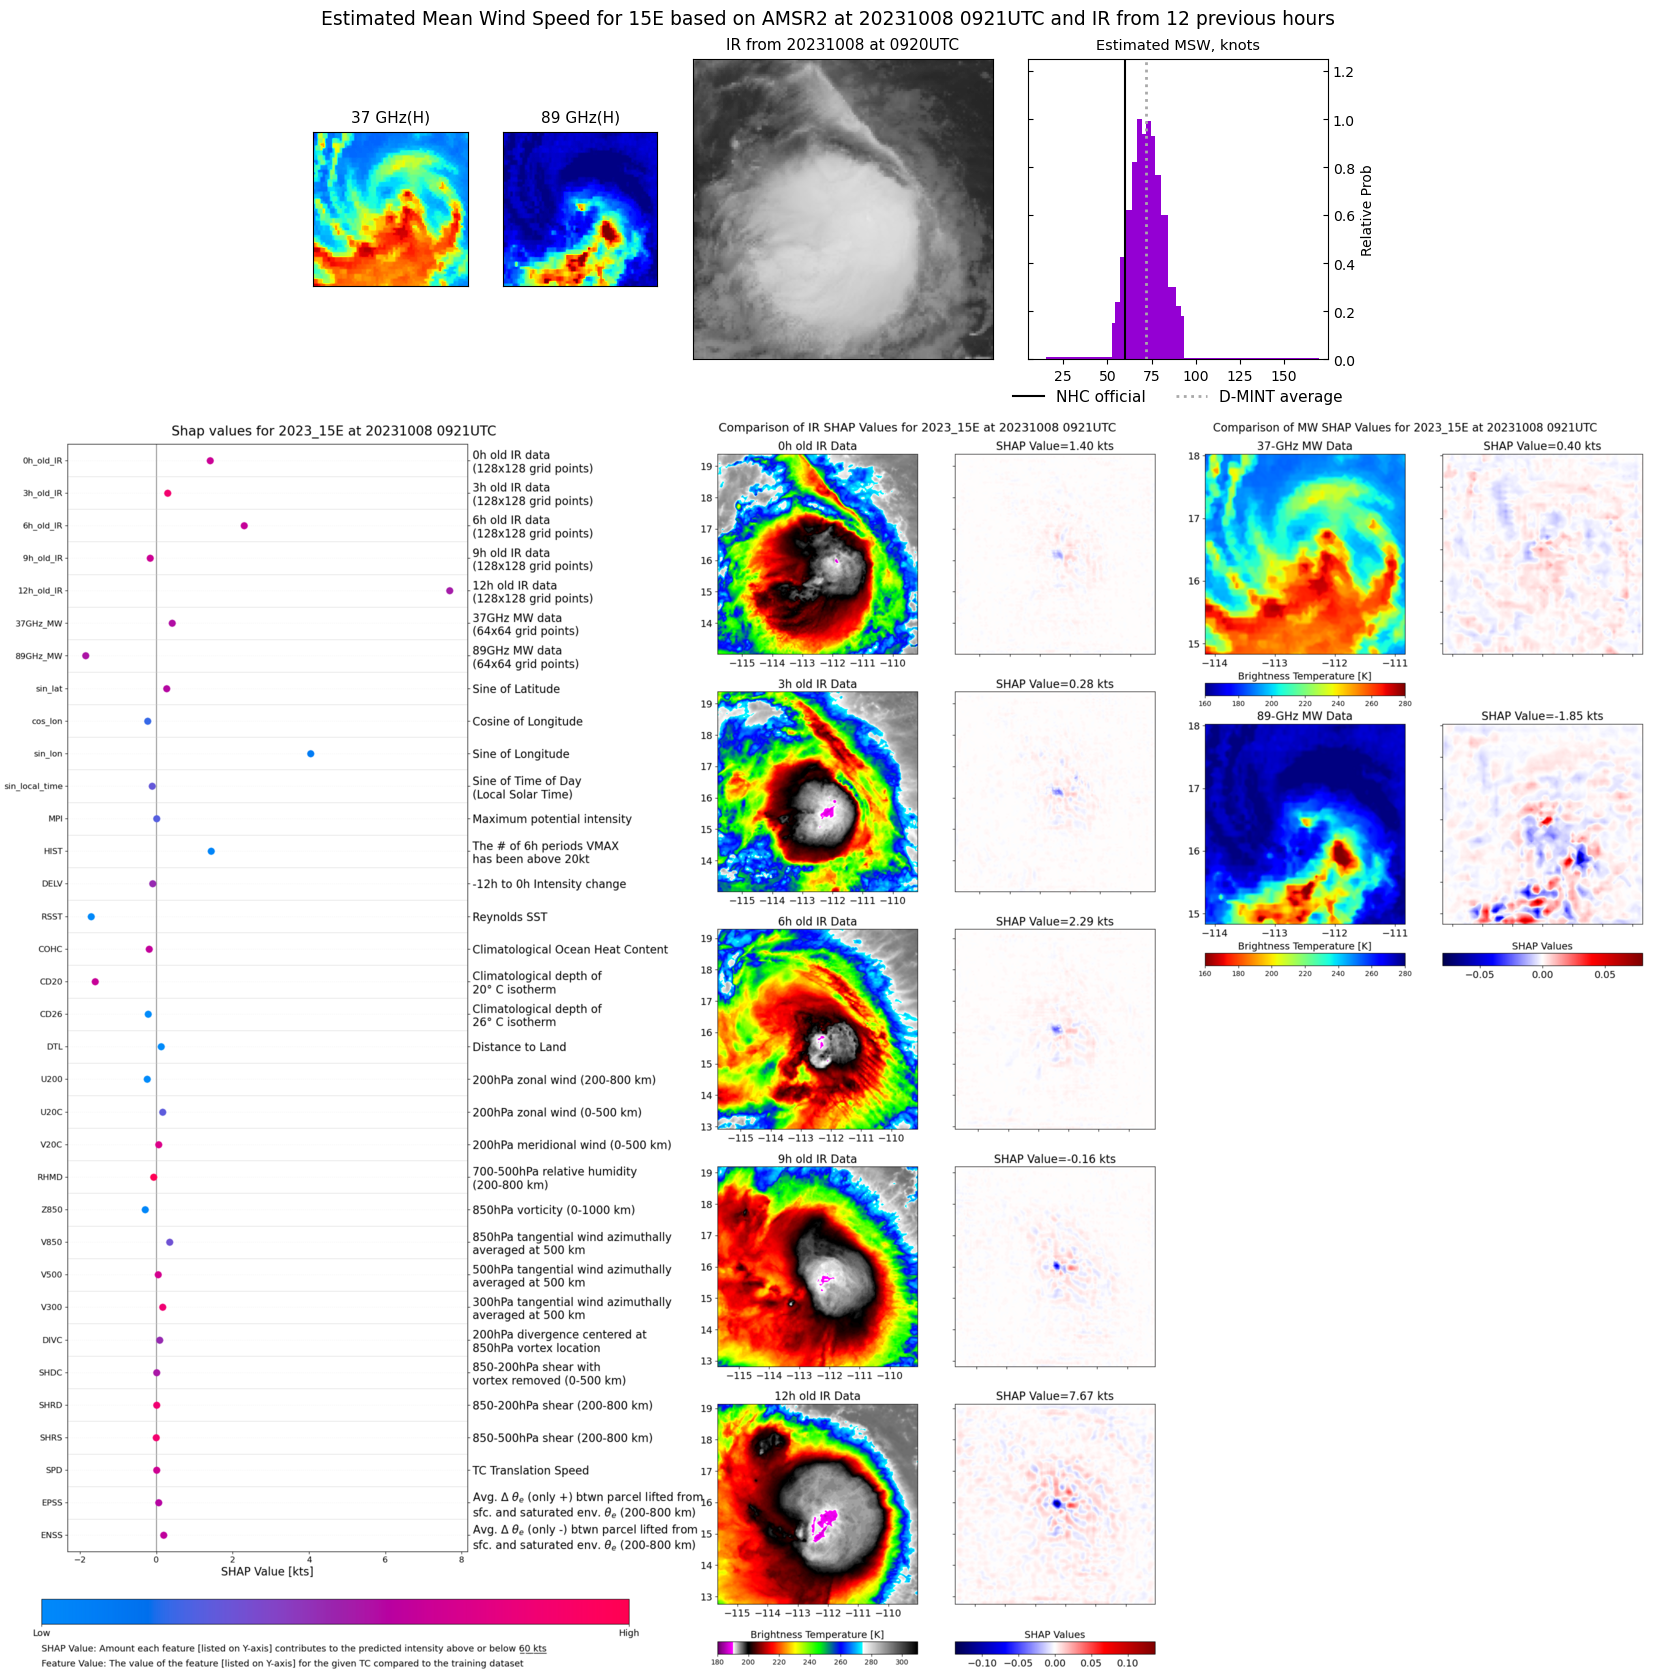 |
| 20231008 | 0711 UTC | GMI | 991 hPa | 74 kts | 67 kts | 80 kts | 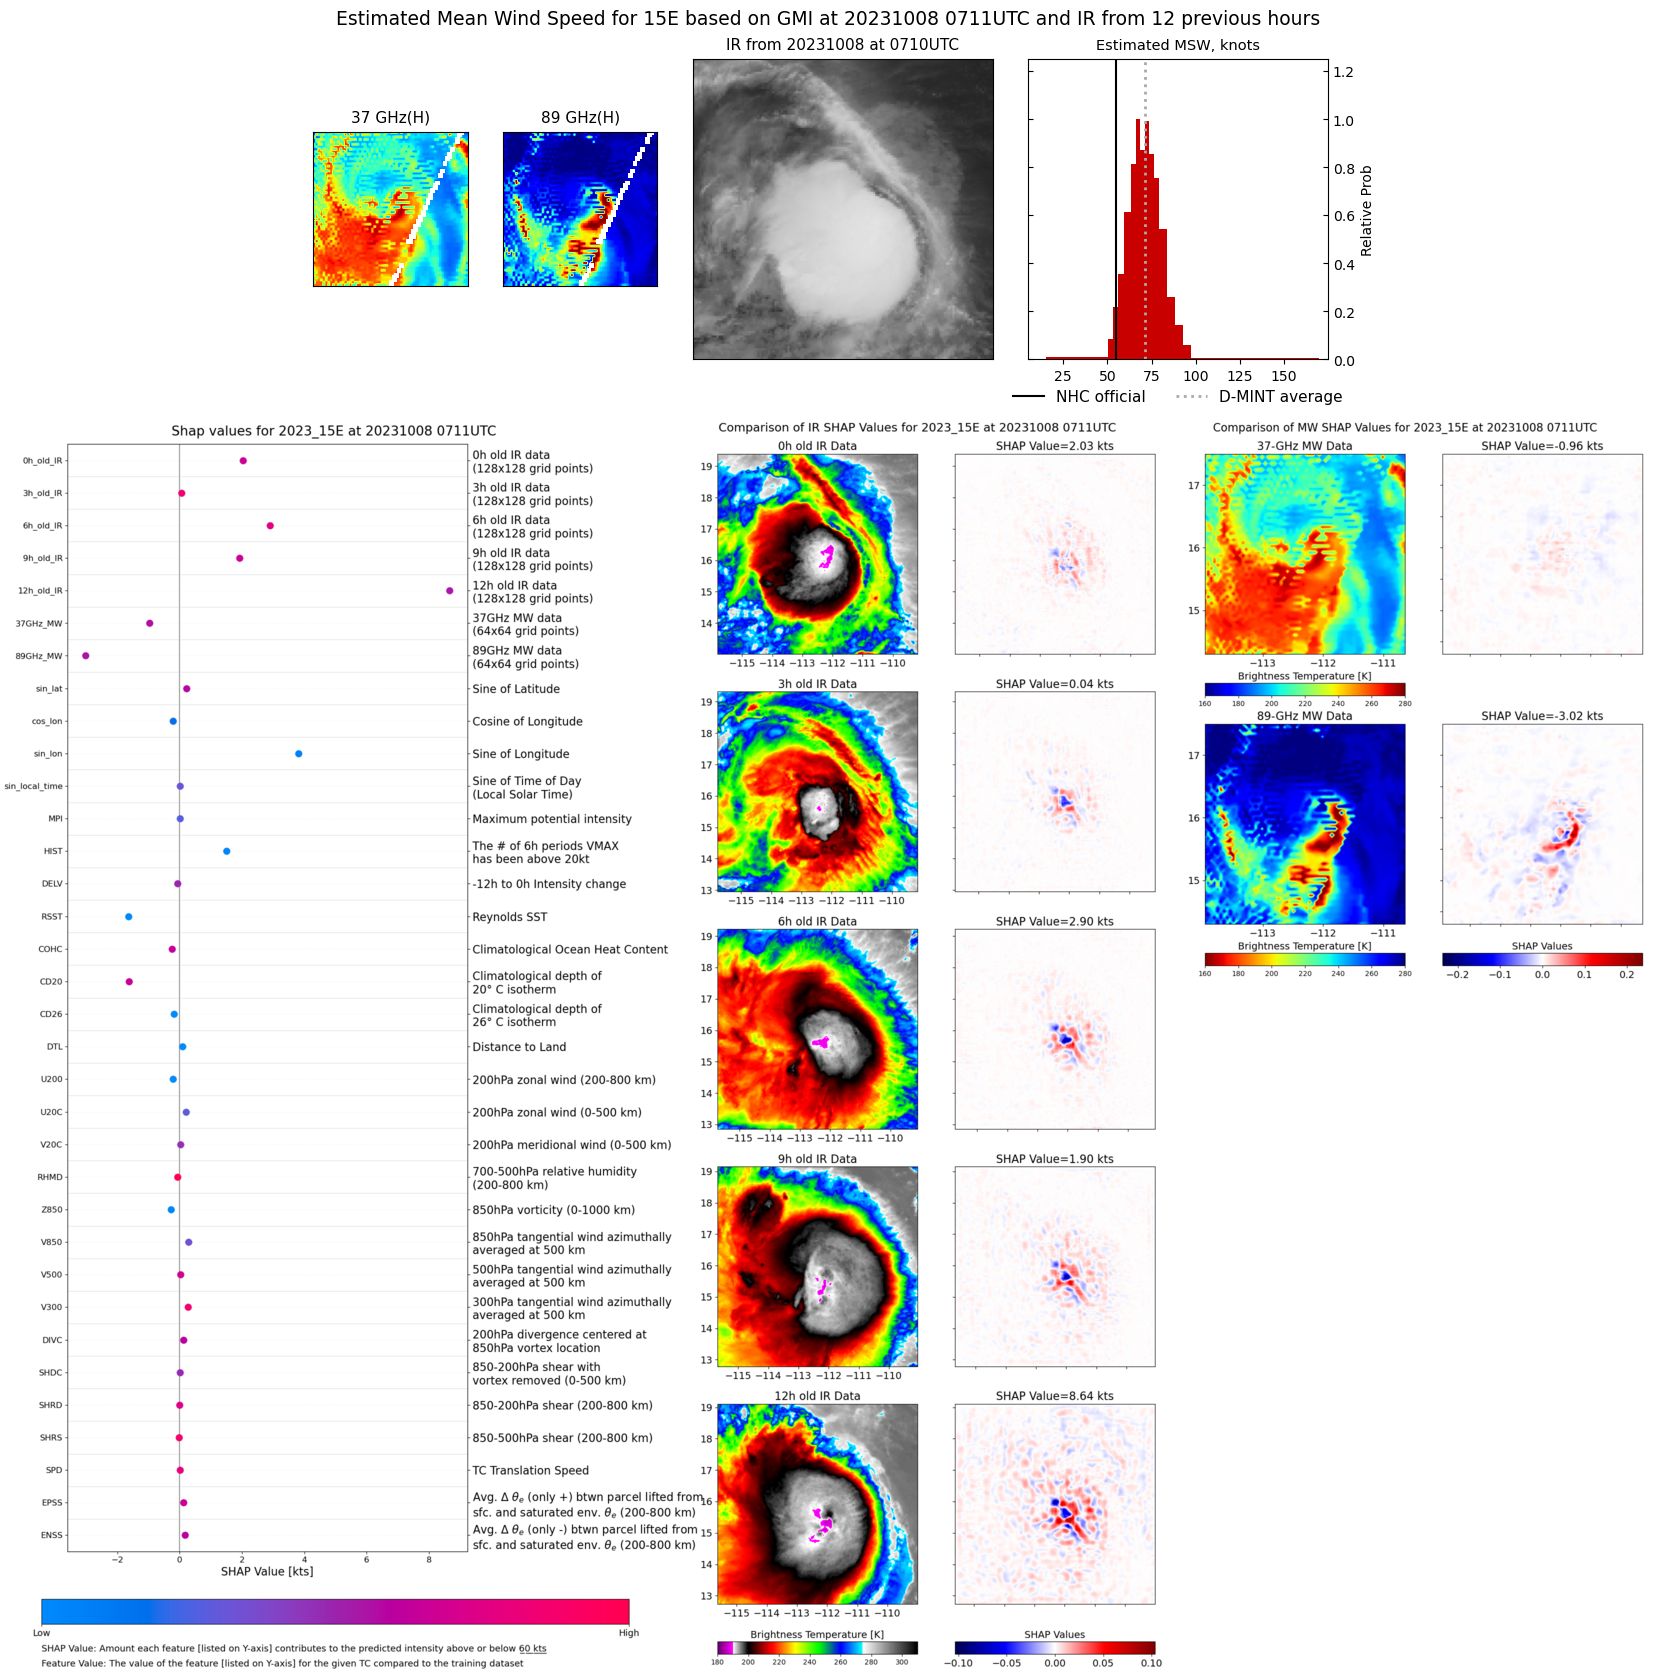 |
| 20231008 | 0148 UTC | SSMISF17 | 993 hPa | 59 kts | 53 kts | 65 kts | 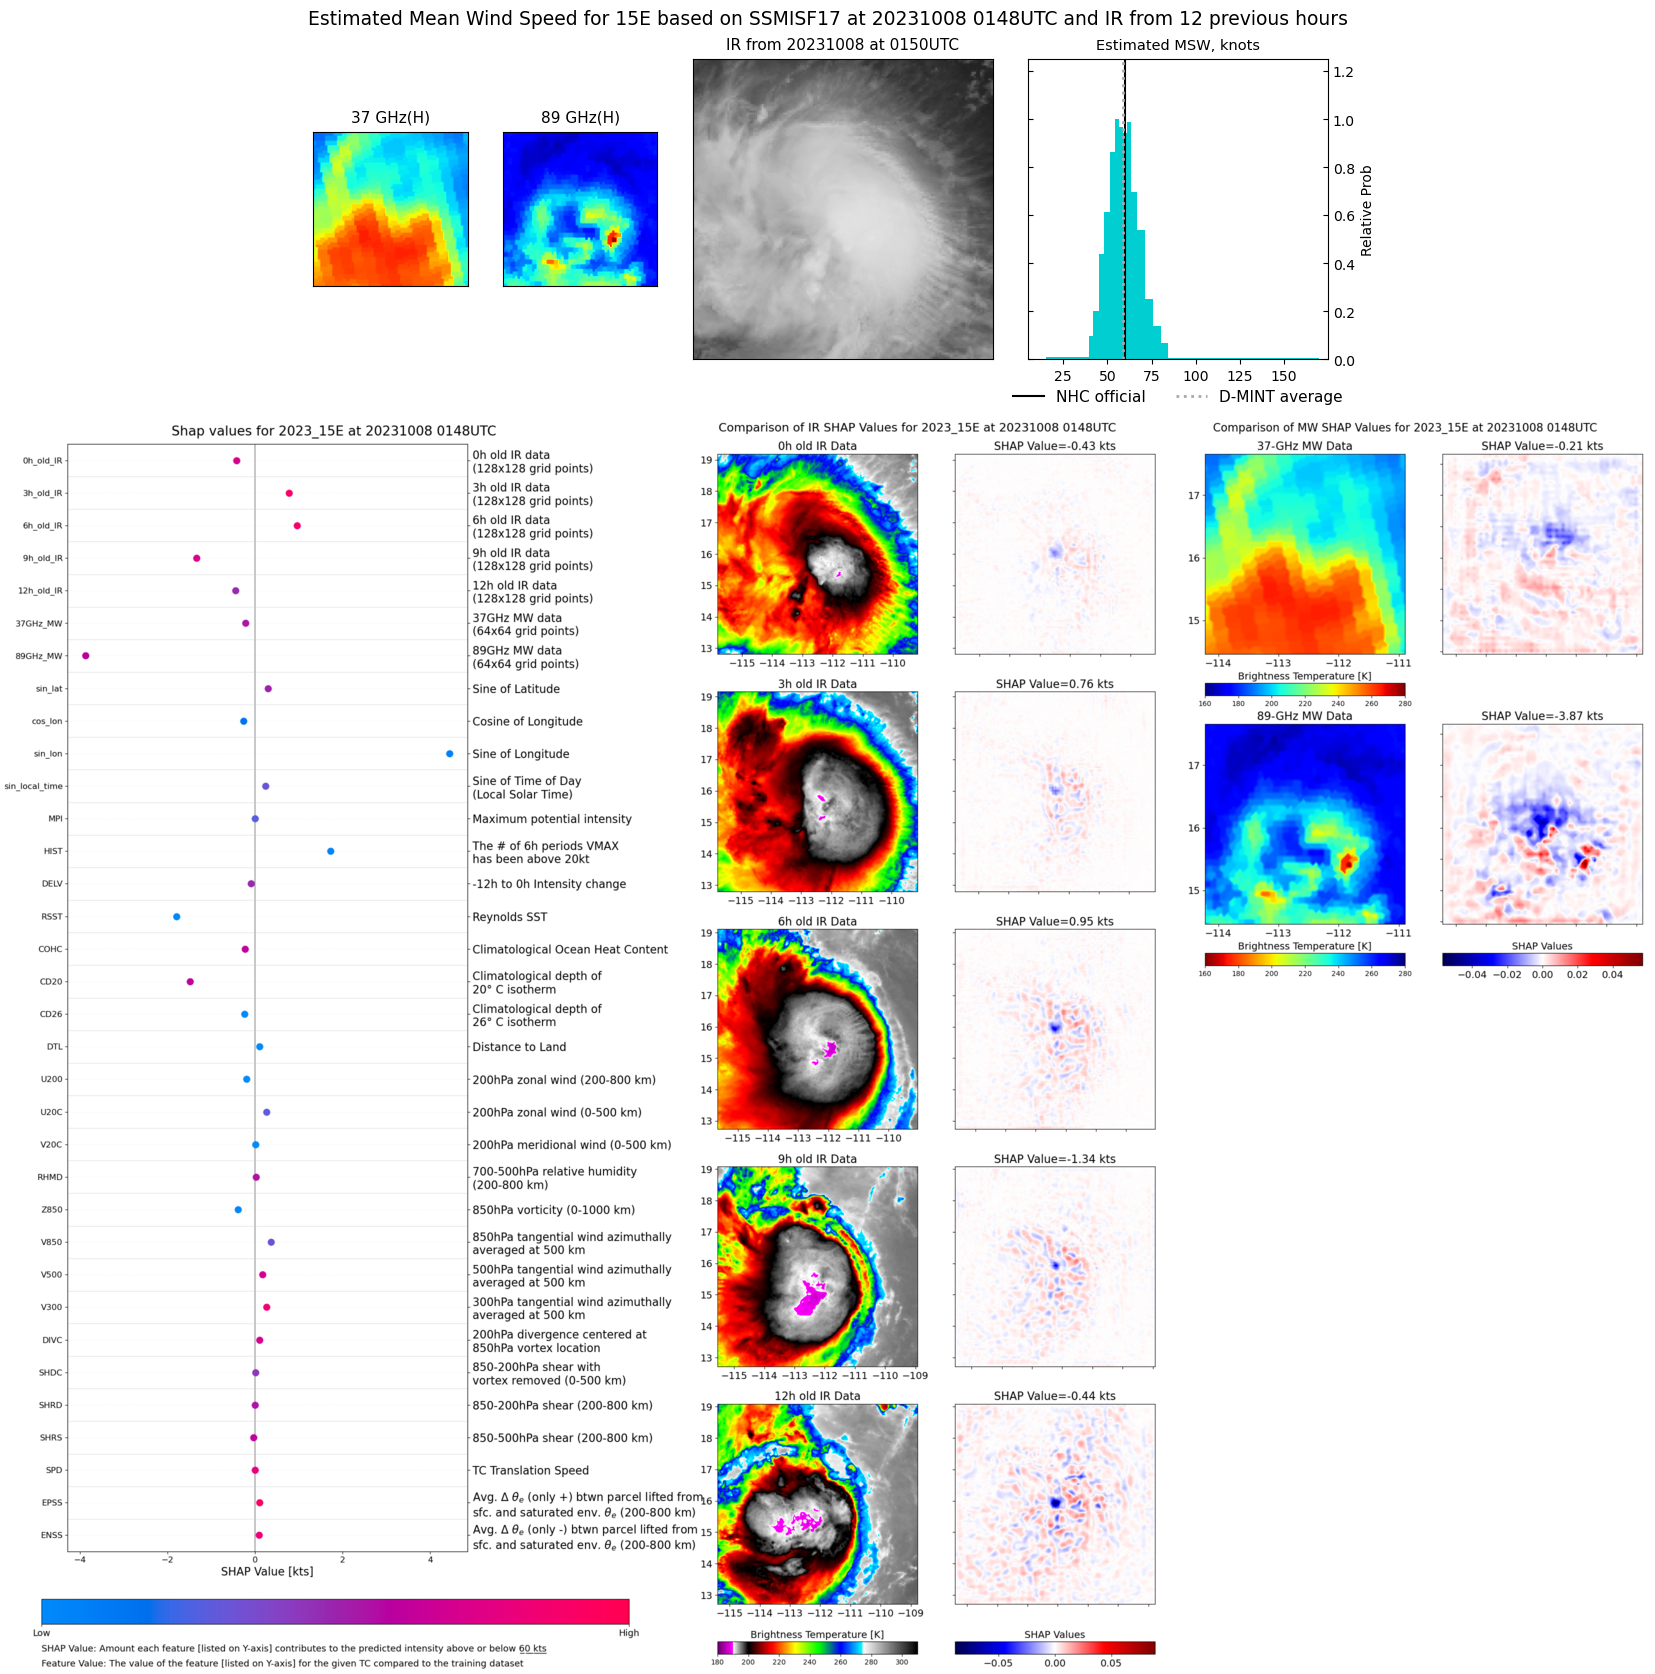 |
| 20231008 | 0028 UTC | SSMISF16 | 995 hPa | 57 kts | 50 kts | 64 kts | 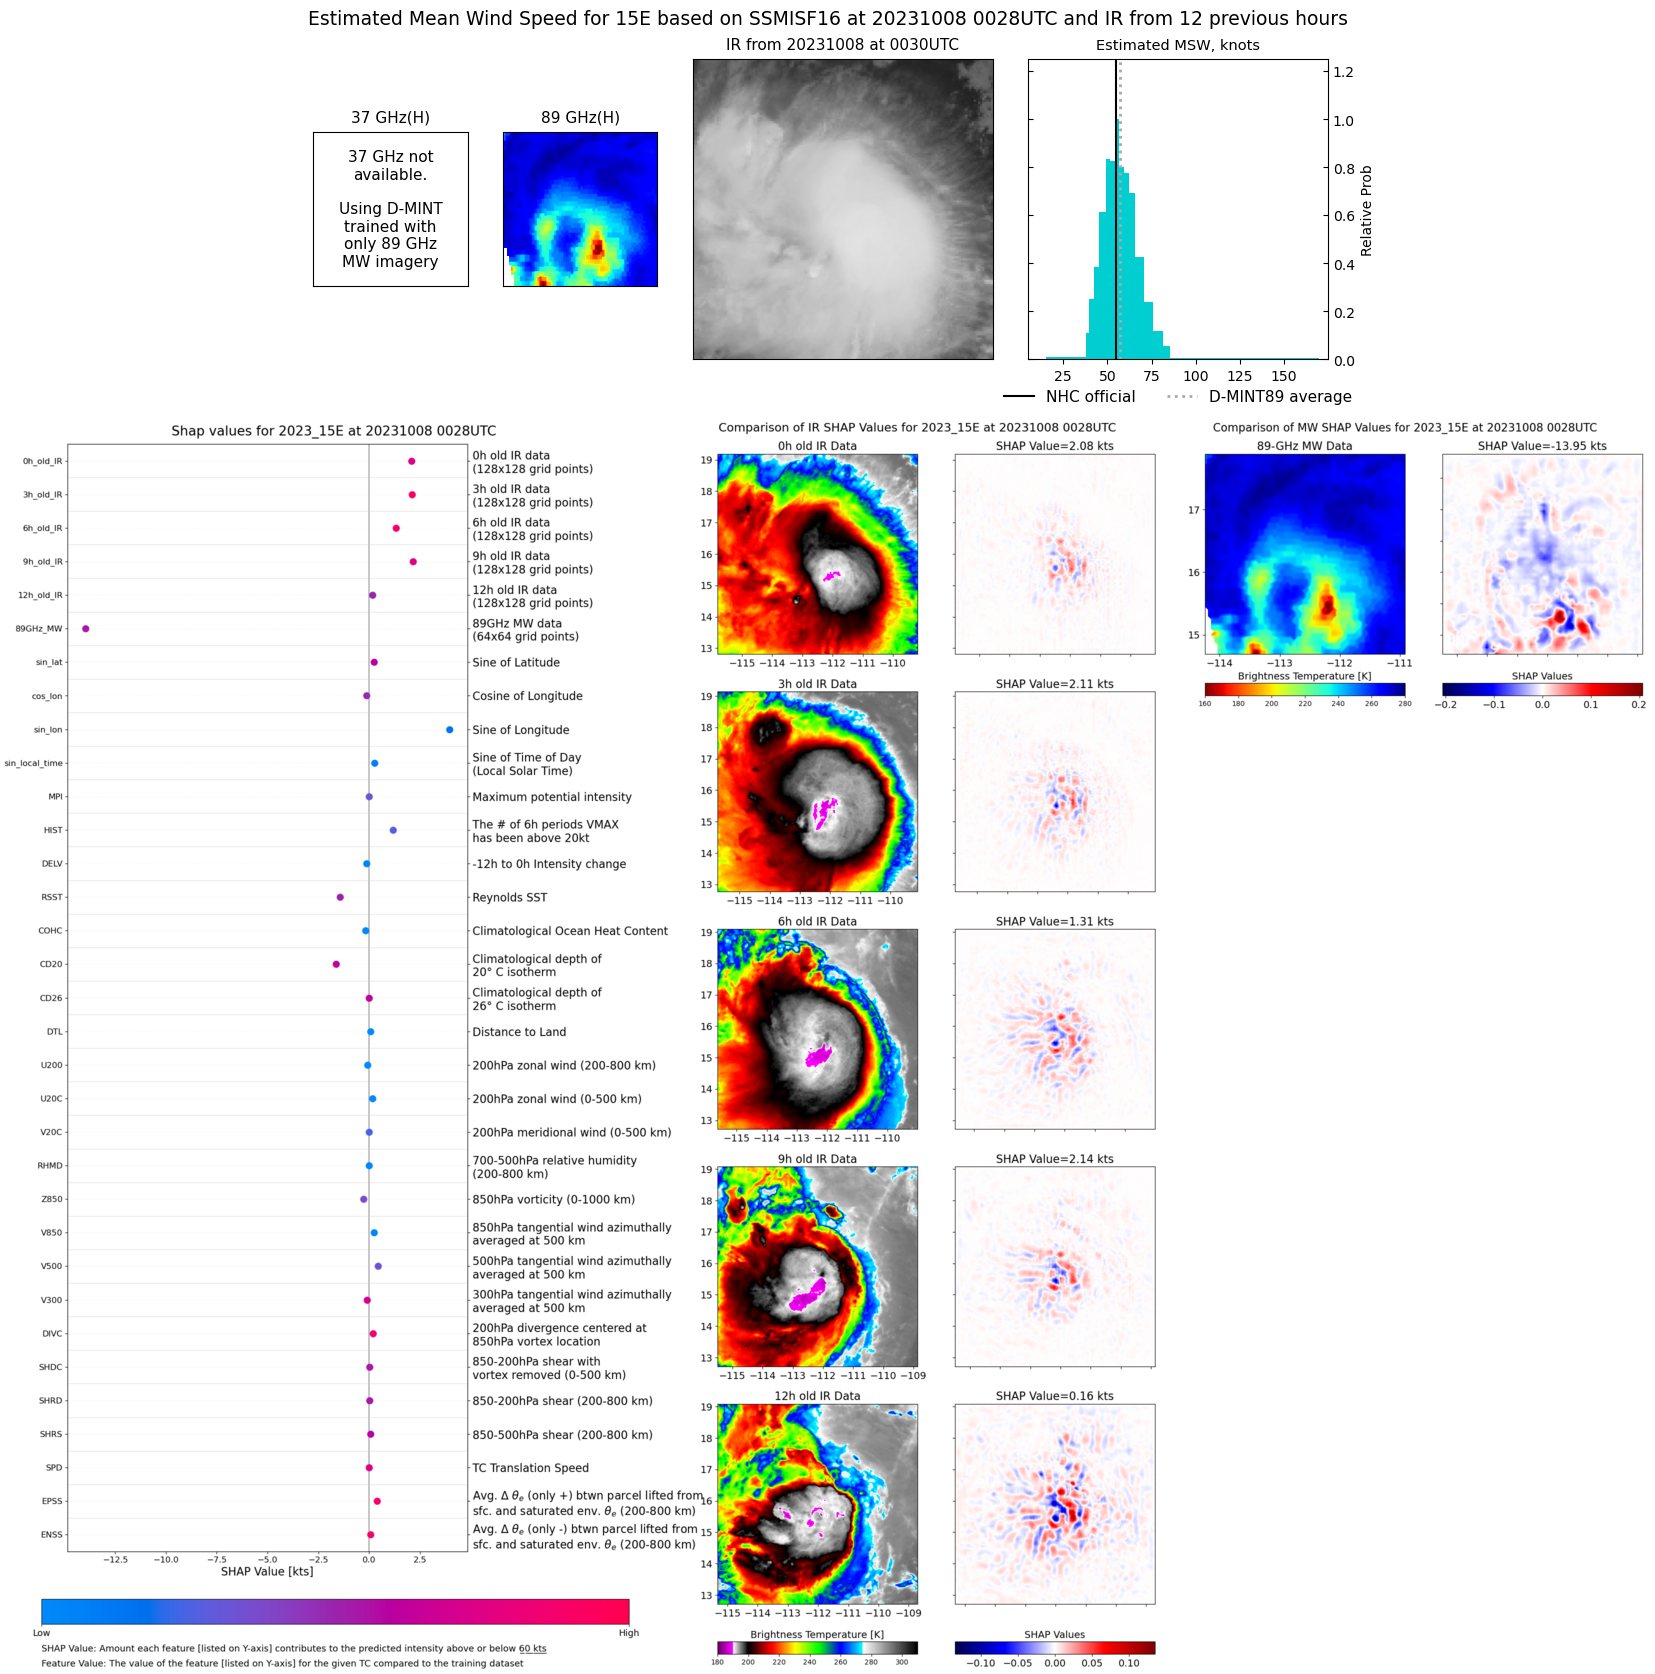 |
| 20231007 | 2108 UTC | AMSR2 | 994 hPa | 52 kts | 47 kts | 58 kts | 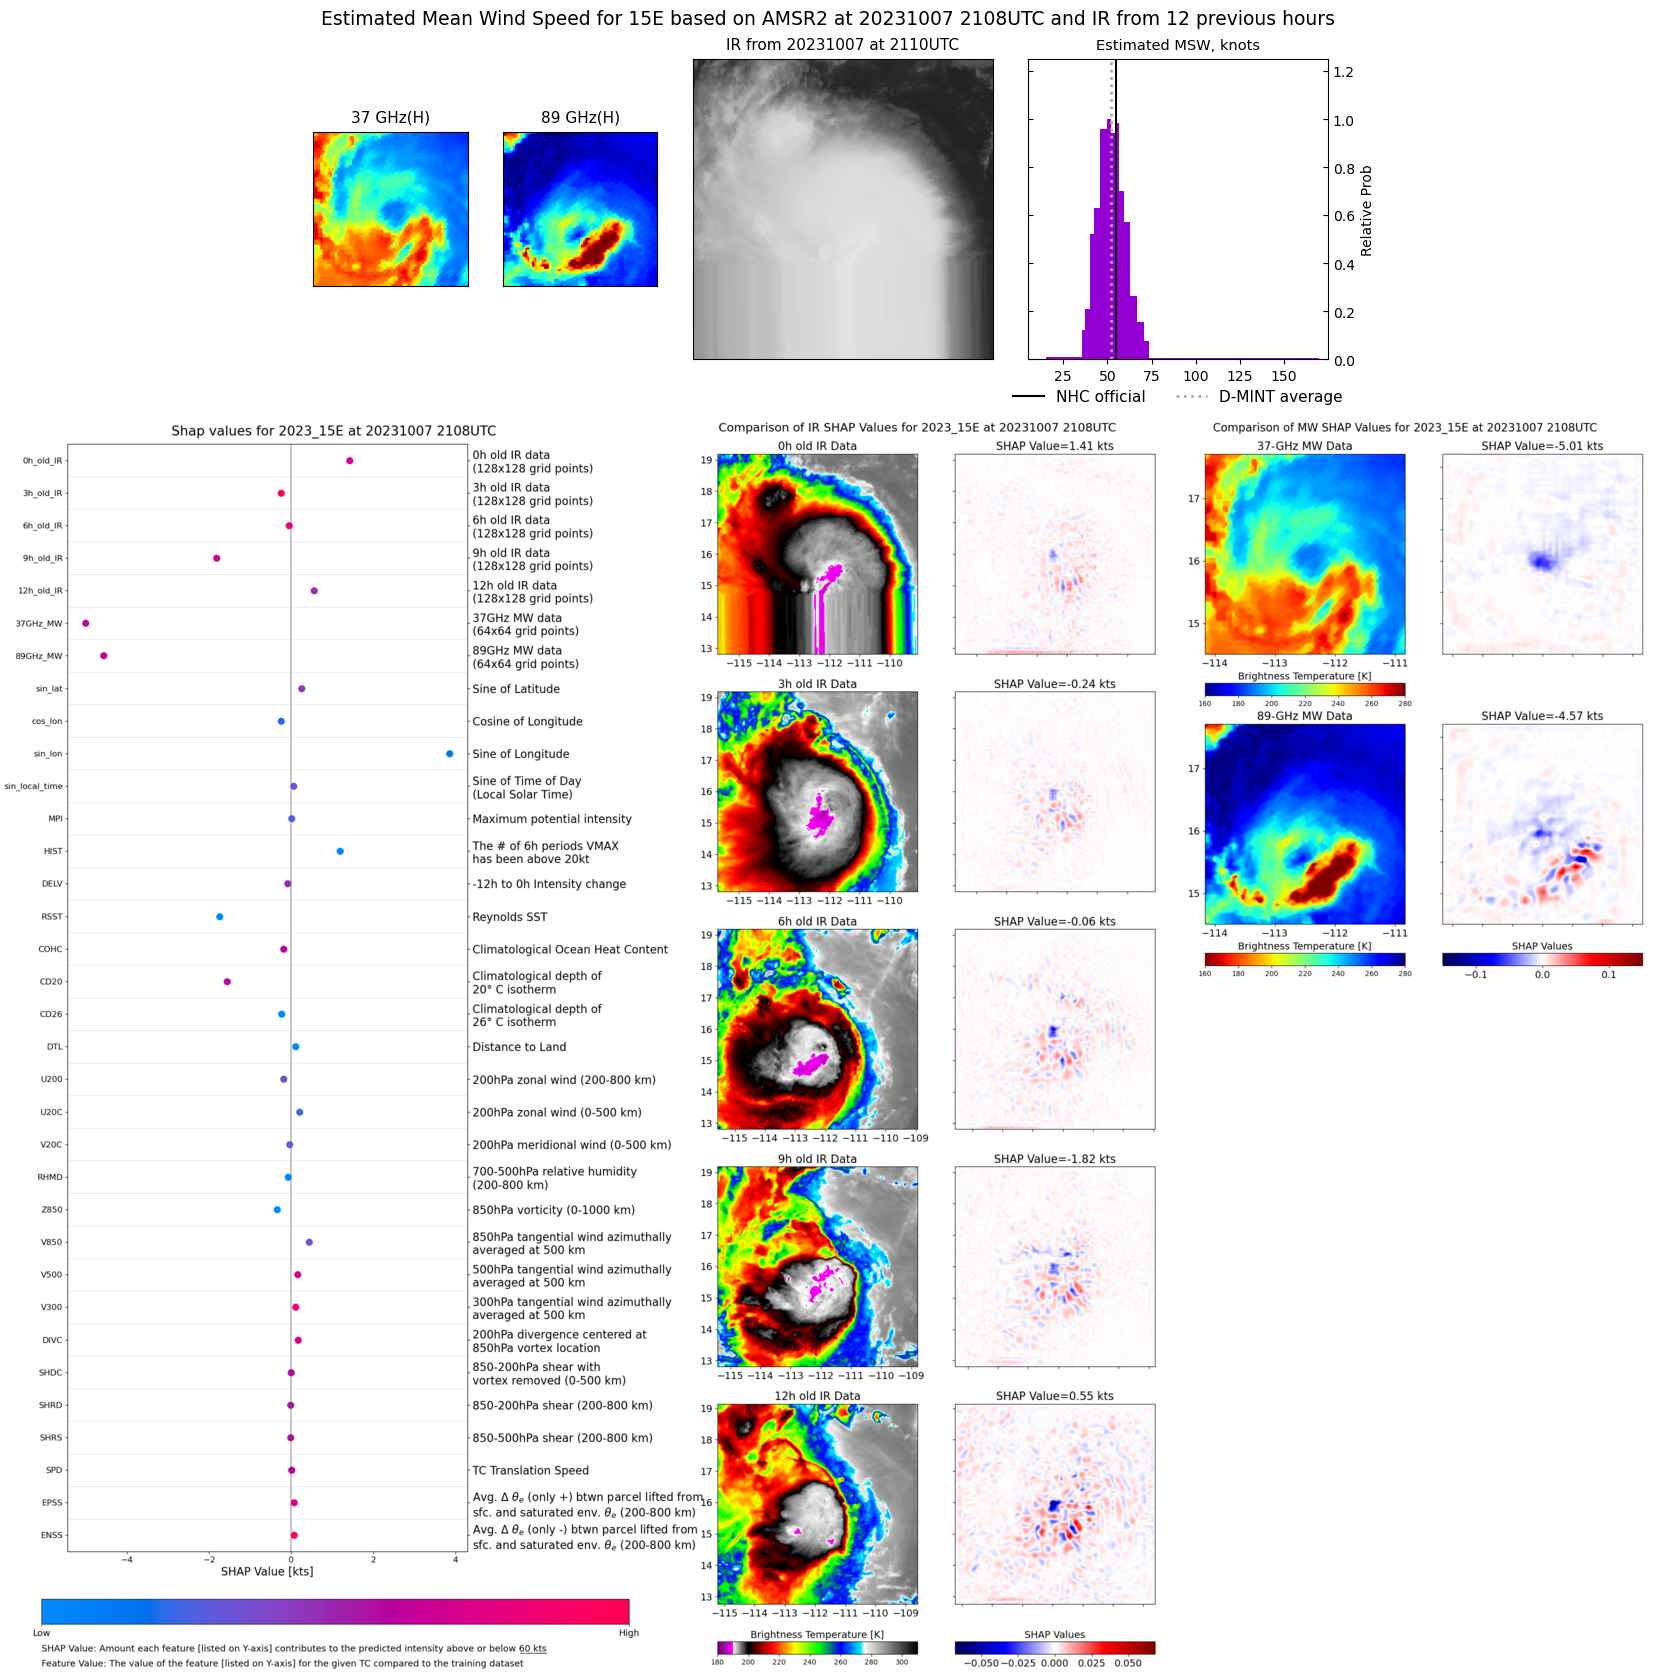 |
| 20231007 | 1751 UTC | GMI | 993 hPa | 57 kts | 51 kts | 63 kts | 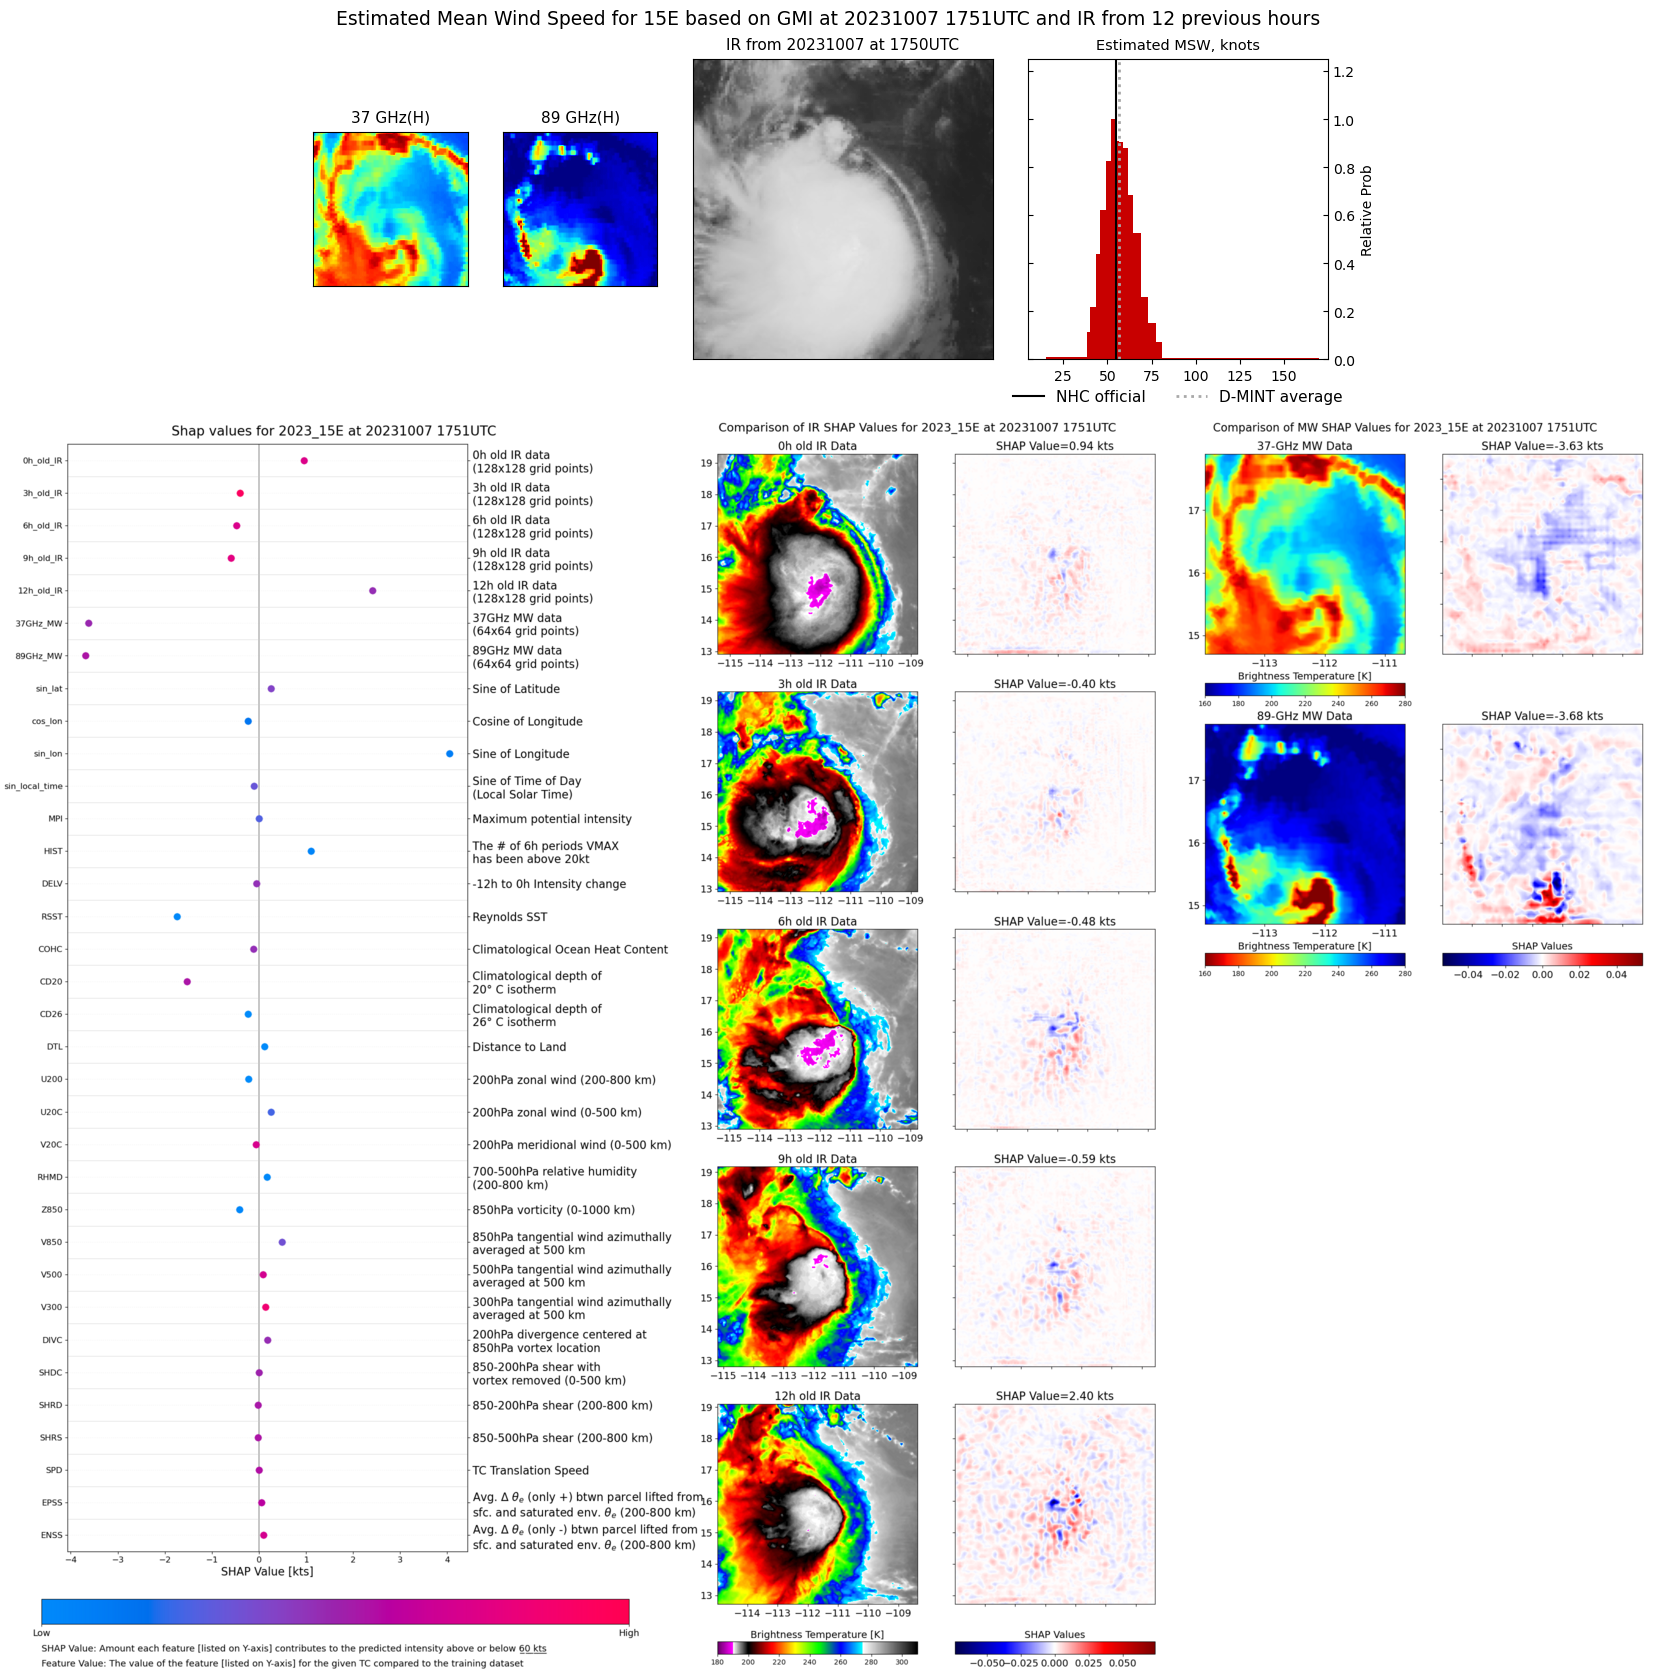 |
| 20231007 | 1315 UTC | SSMISF16 | 987 hPa | 57 kts | 51 kts | 64 kts | 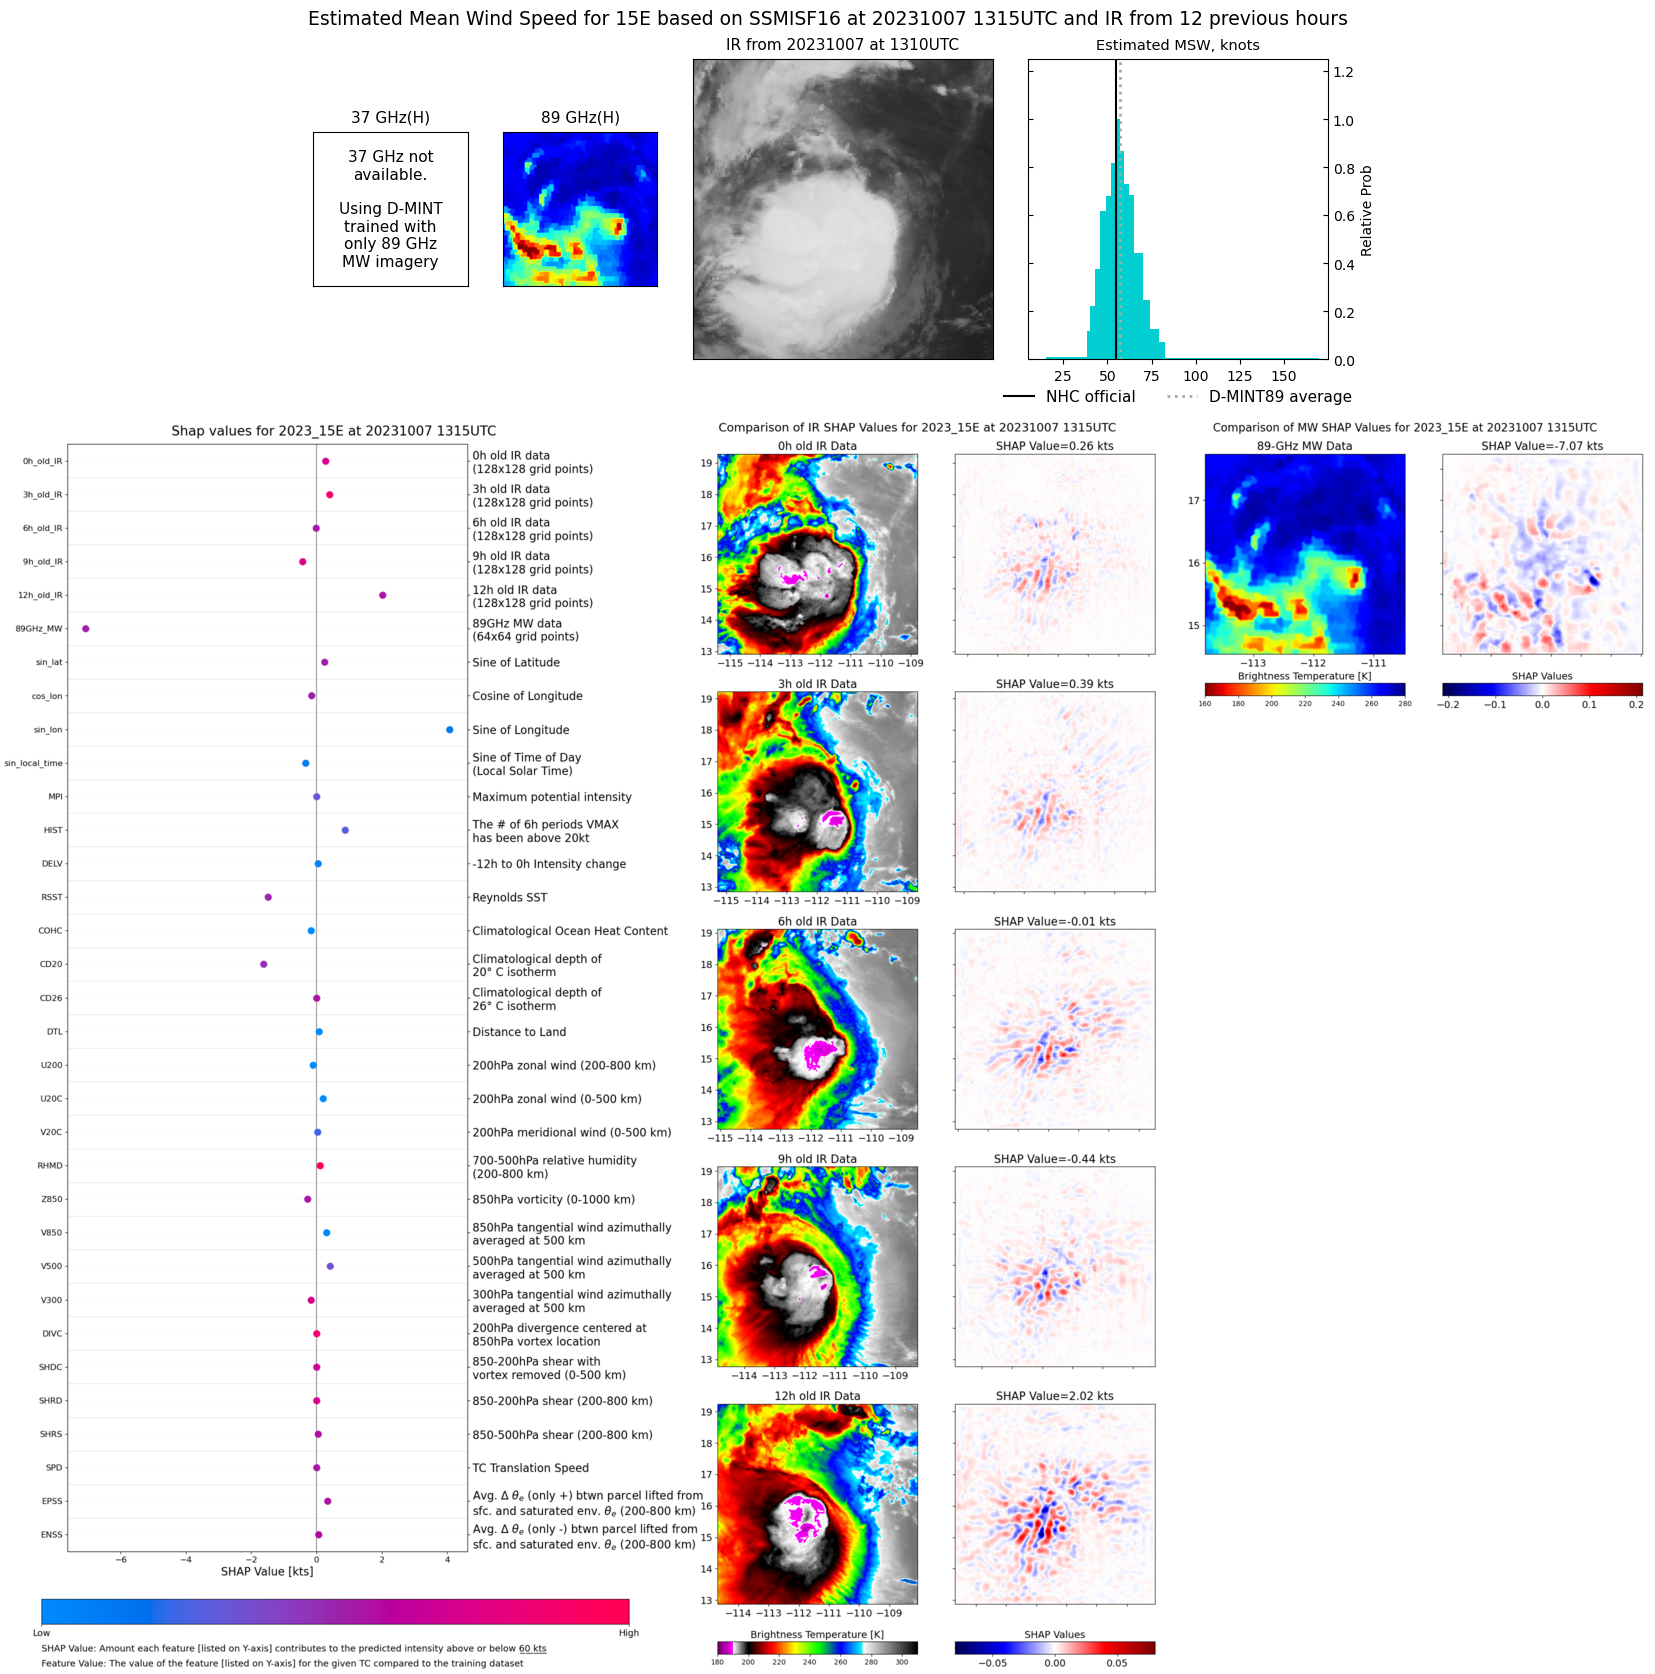 |
| 20231007 | 1123 UTC | SSMISF18 | 990 hPa | 58 kts | 52 kts | 64 kts | 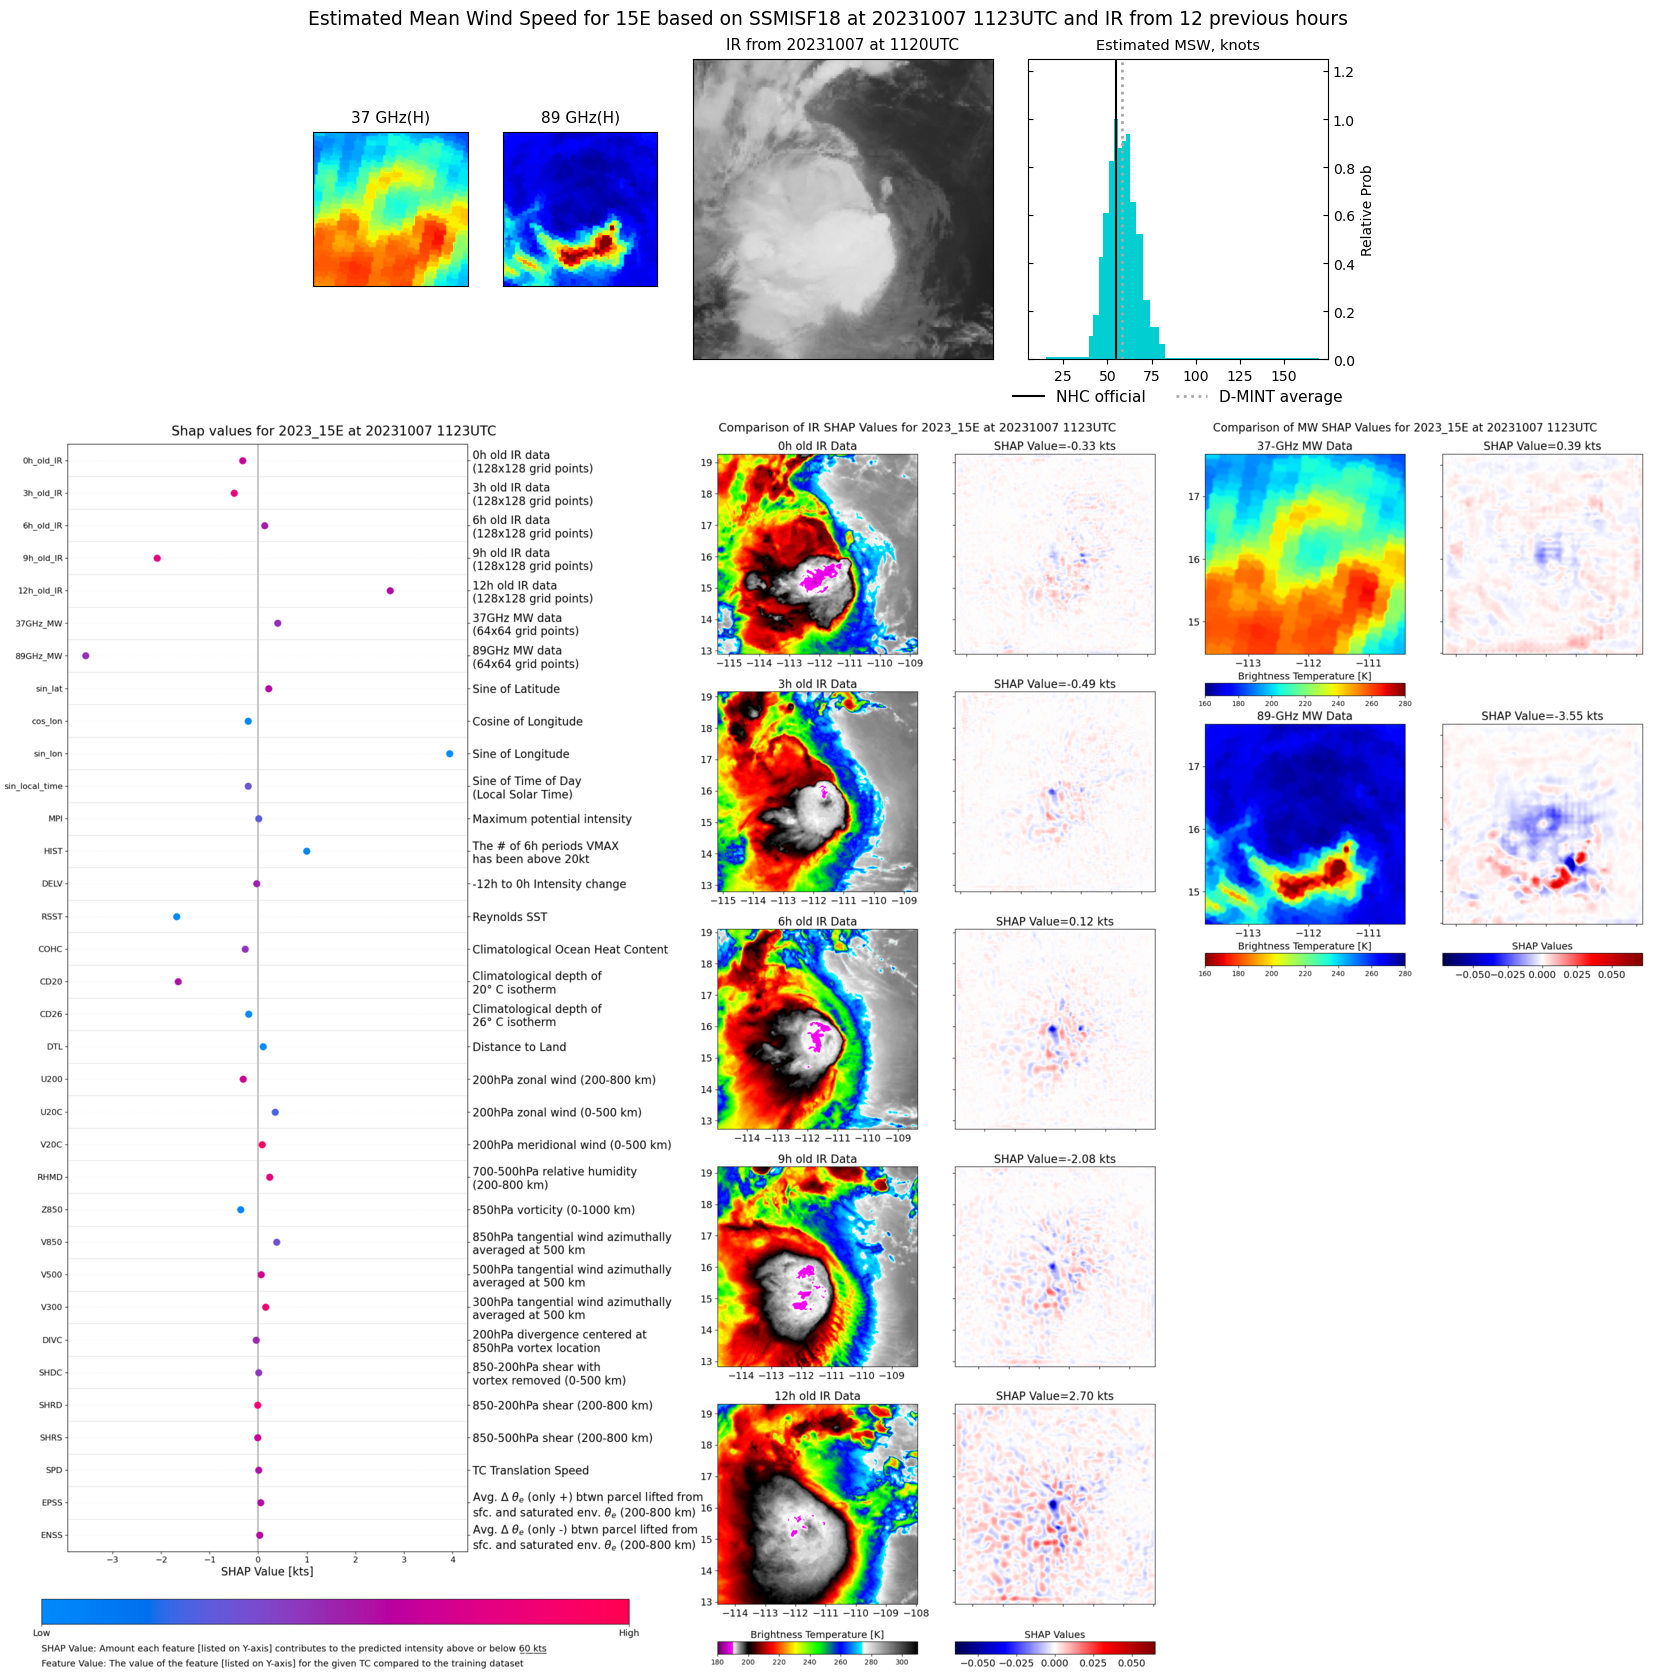 |
| 20231007 | 0203 UTC | SSMISF17 | 994 hPa | 52 kts | 46 kts | 58 kts | 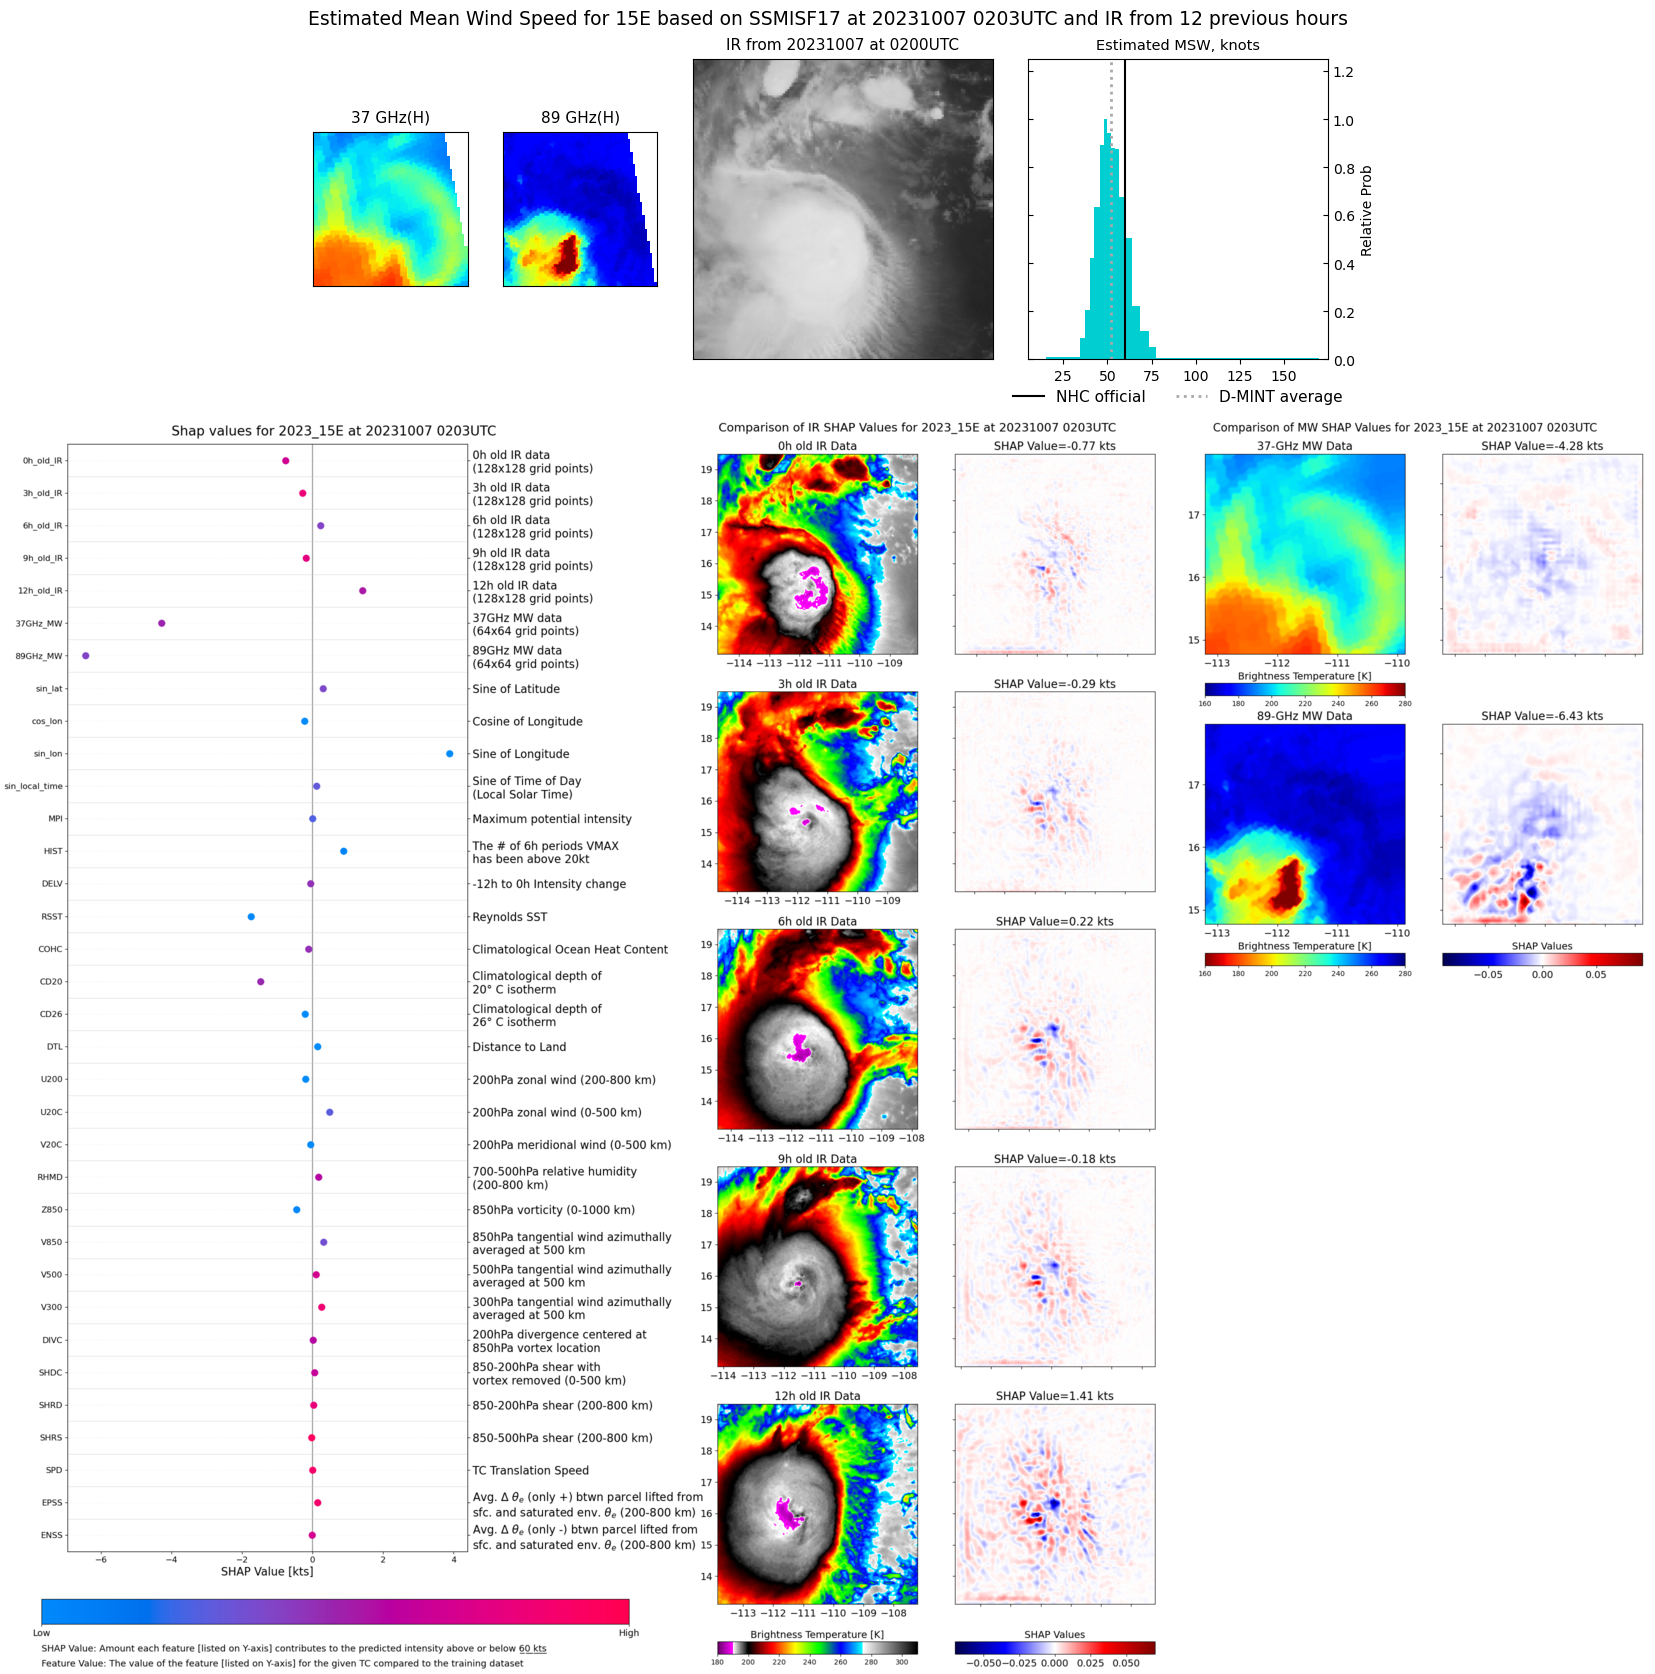 |
| 20231007 | 0040 UTC | SSMISF16 | 994 hPa | 53 kts | 47 kts | 60 kts | 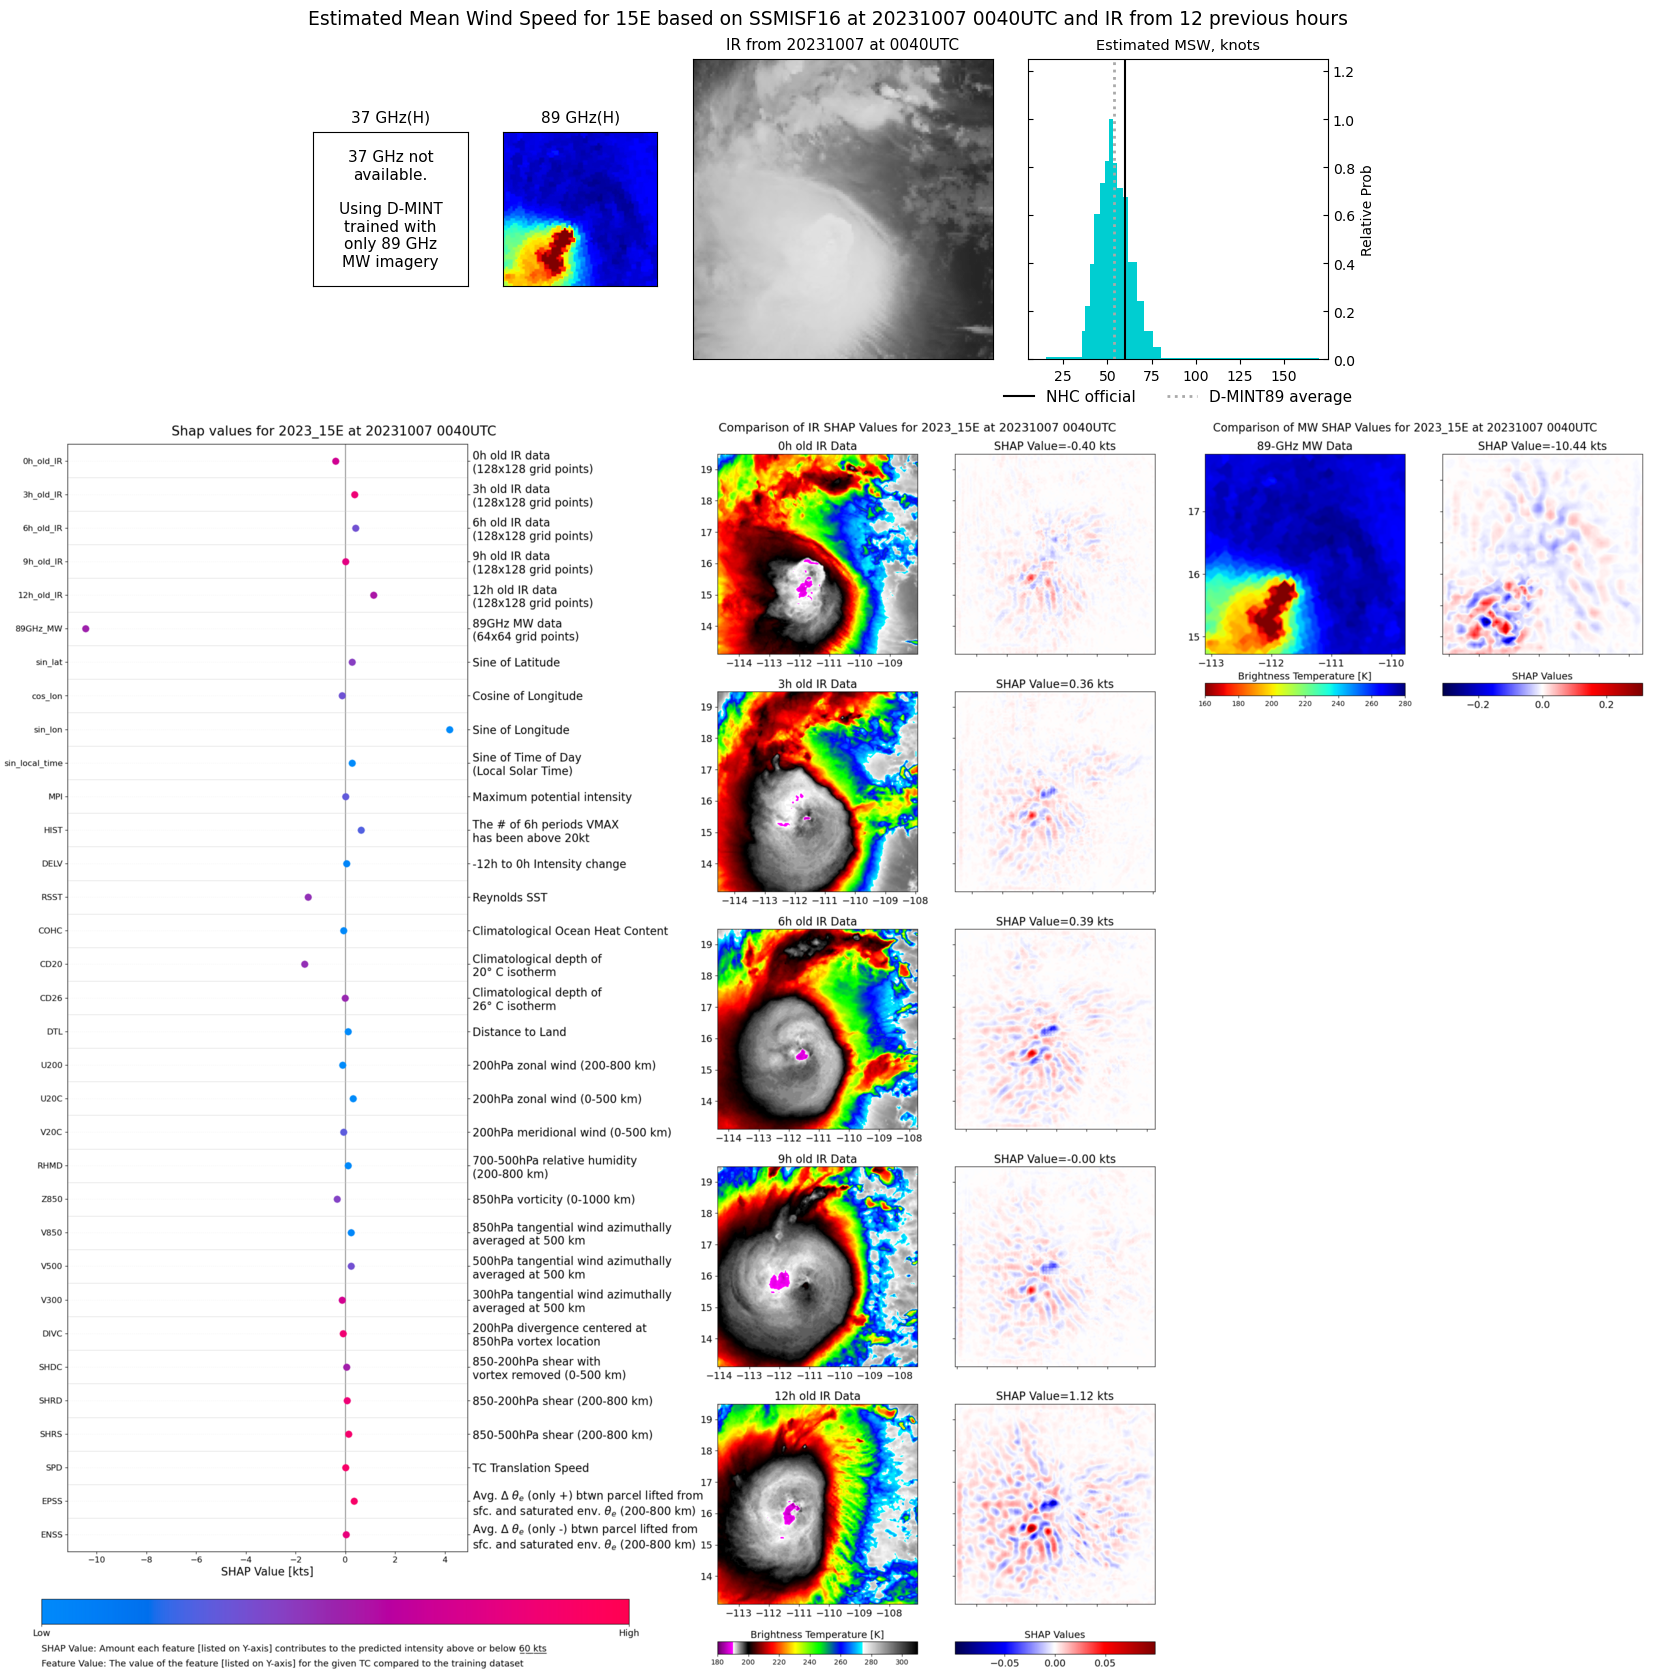 |
| 20231006 | 2249 UTC | SSMISF18 | 995 hPa | 54 kts | 48 kts | 60 kts | 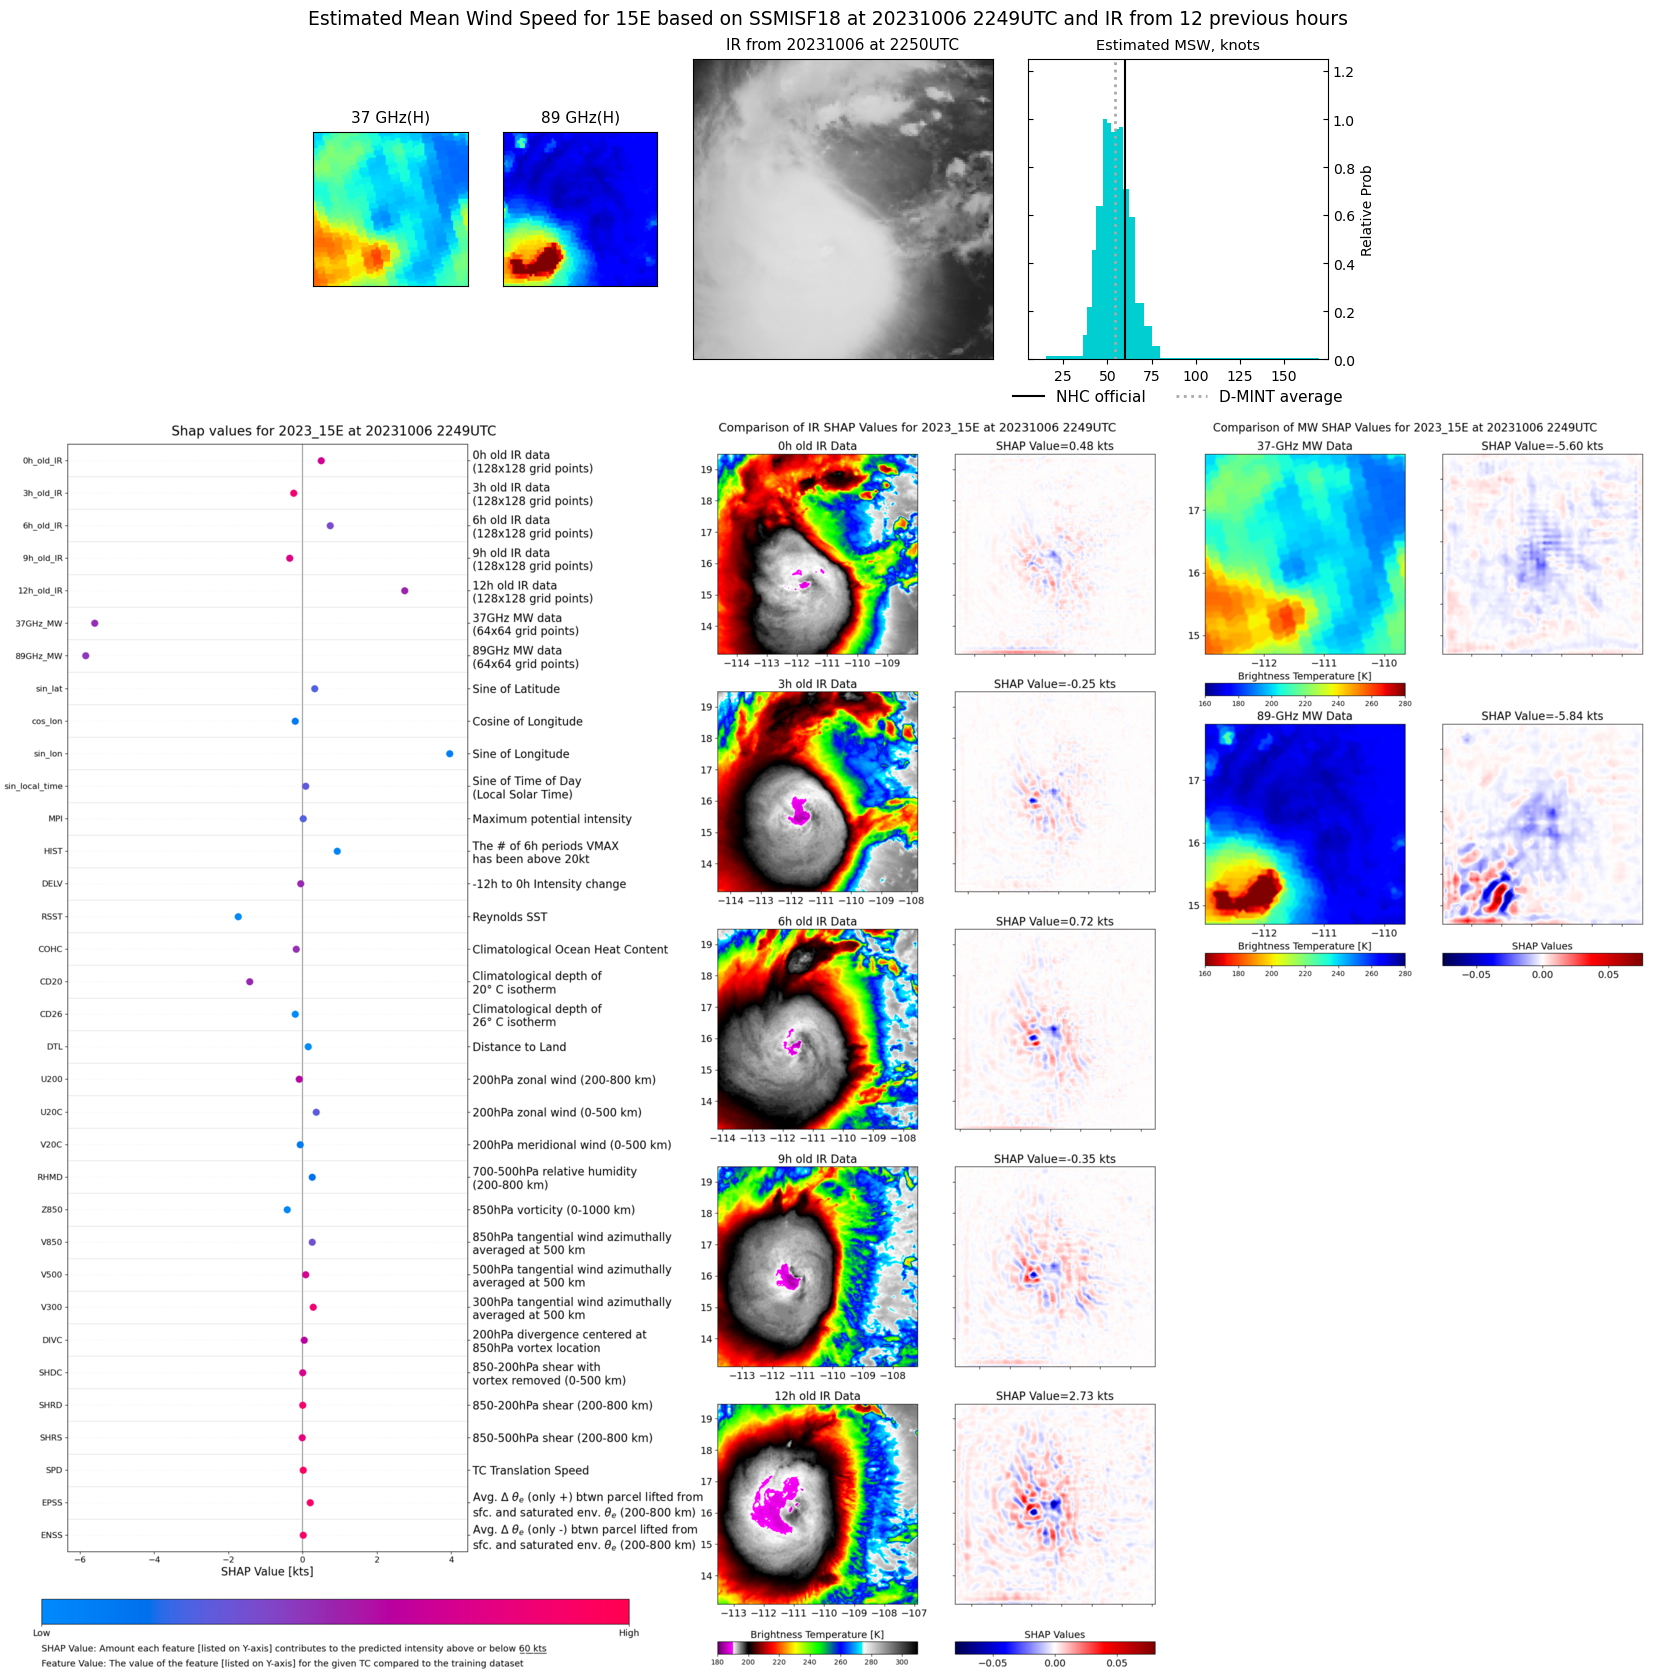 |
| 20231006 | 2026 UTC | AMSR2 | 994 hPa | 56 kts | 51 kts | 62 kts | 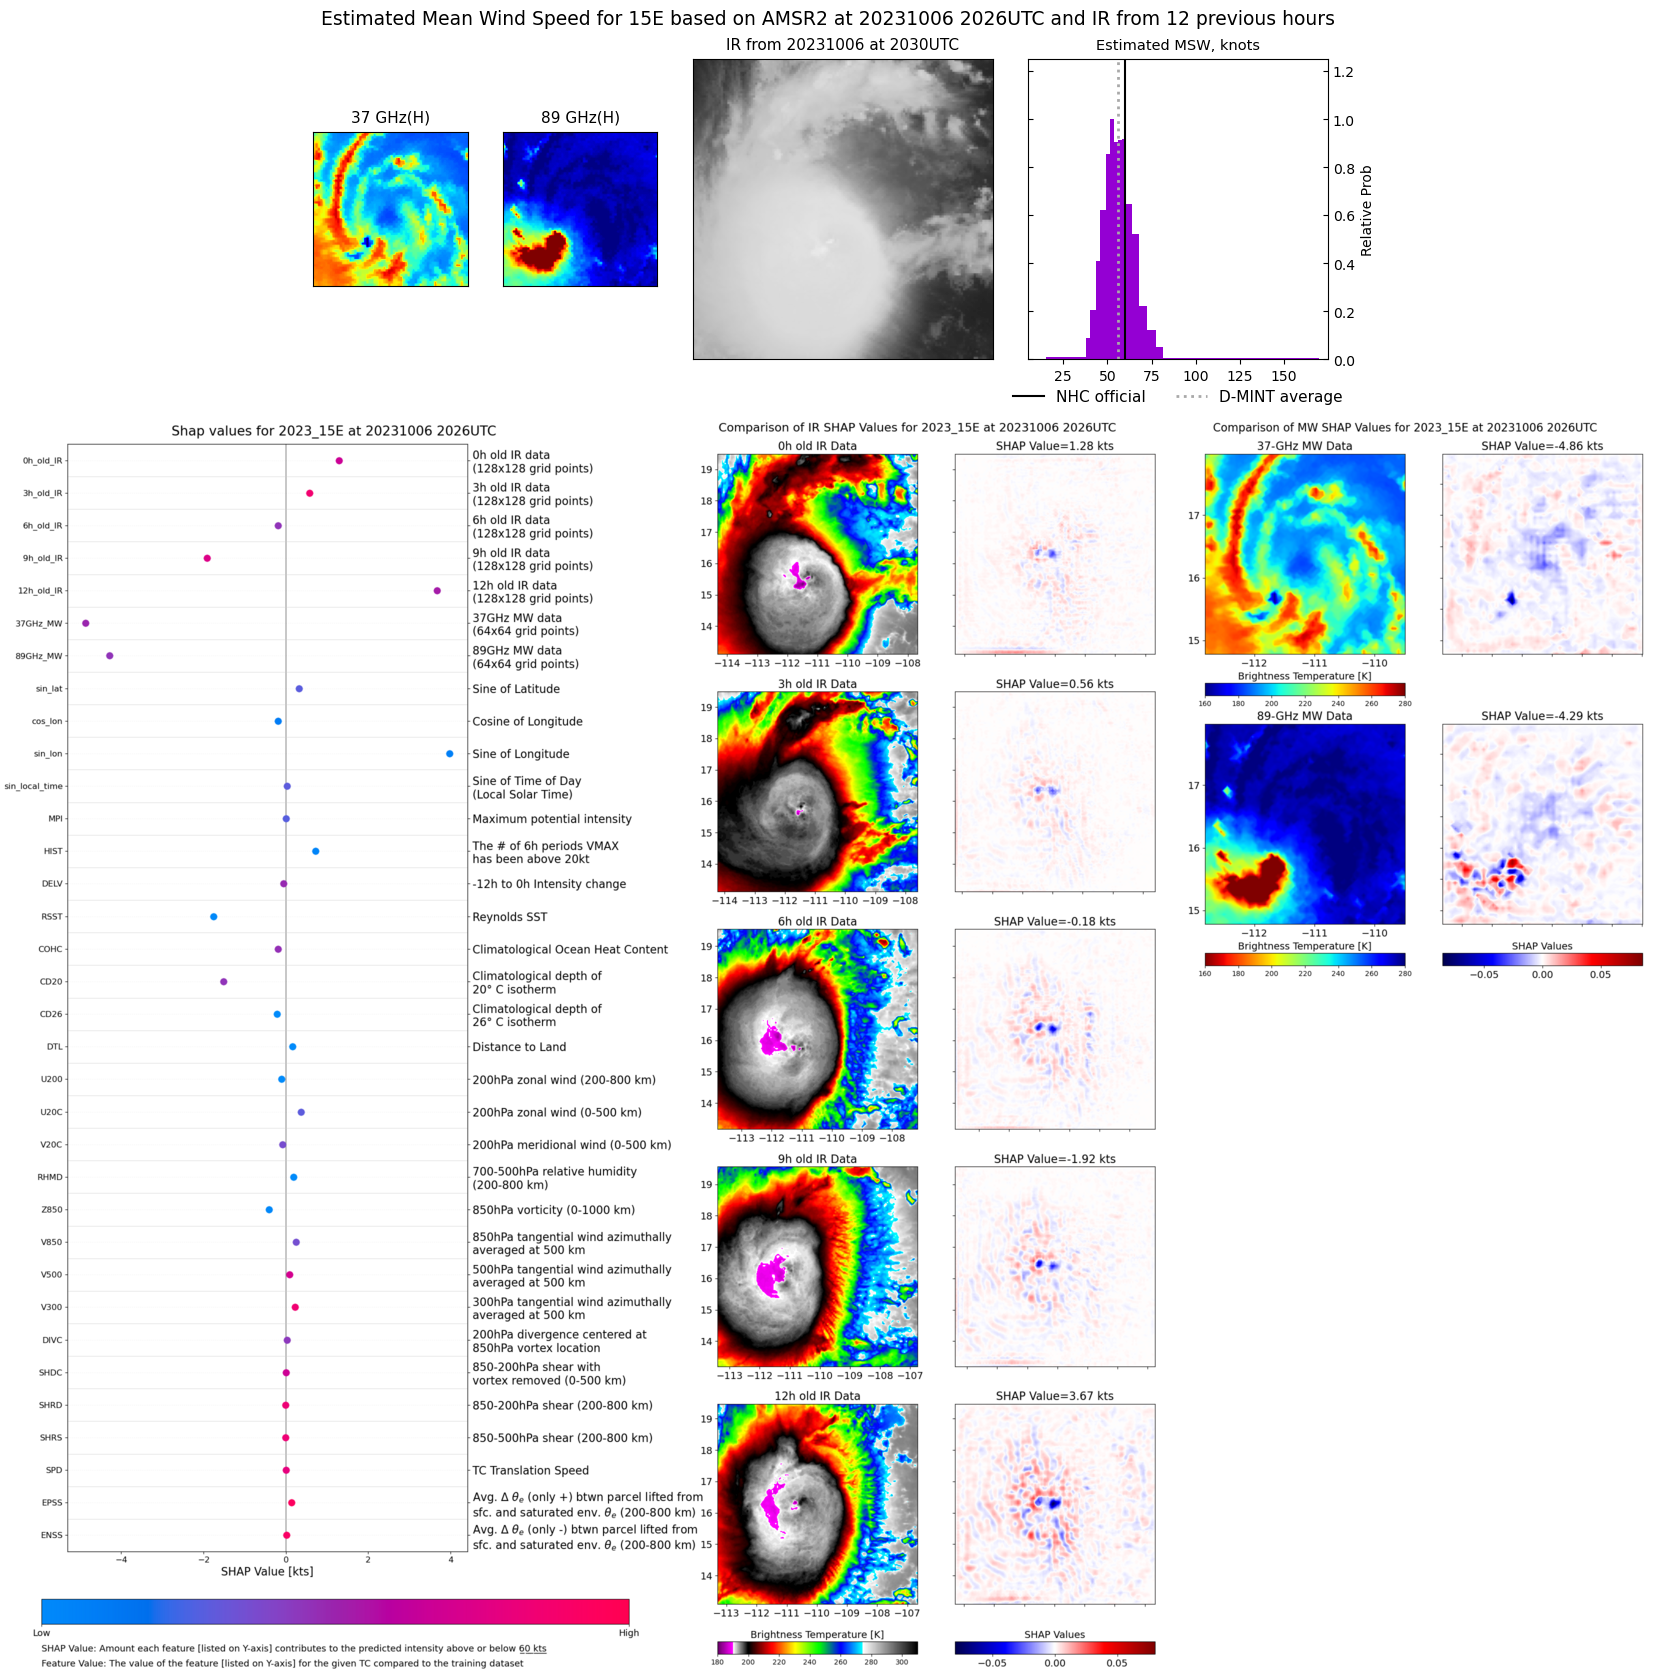 |
| 20231006 | 1329 UTC | SSMISF16 | 998 hPa | 58 kts | 51 kts | 64 kts | 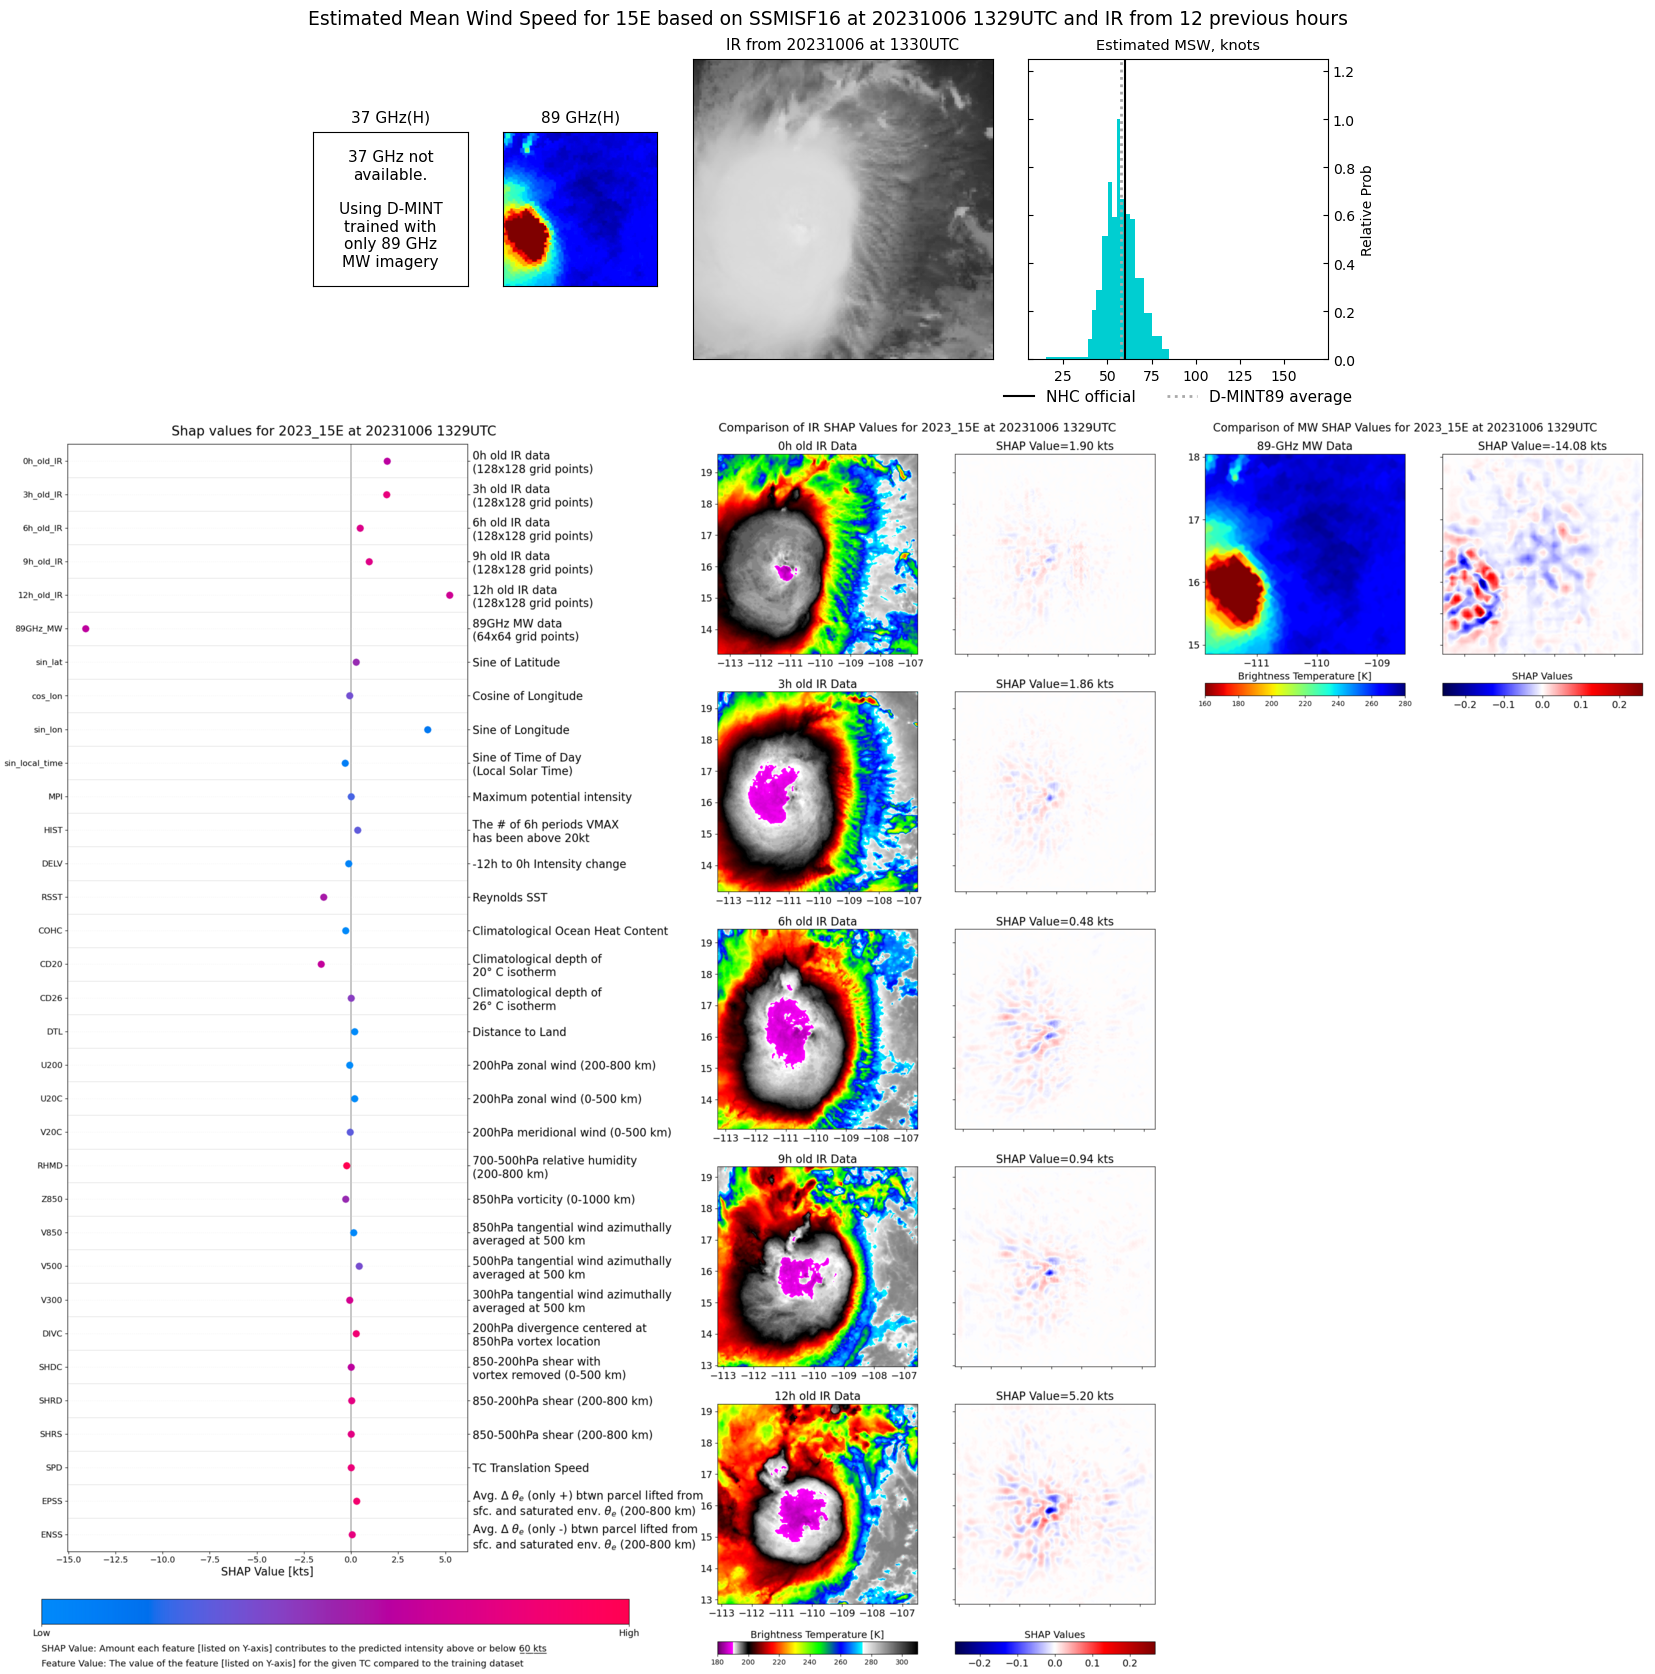 |
| 20231006 | 1136 UTC | SSMISF18 | 997 hPa | 56 kts | 50 kts | 62 kts | 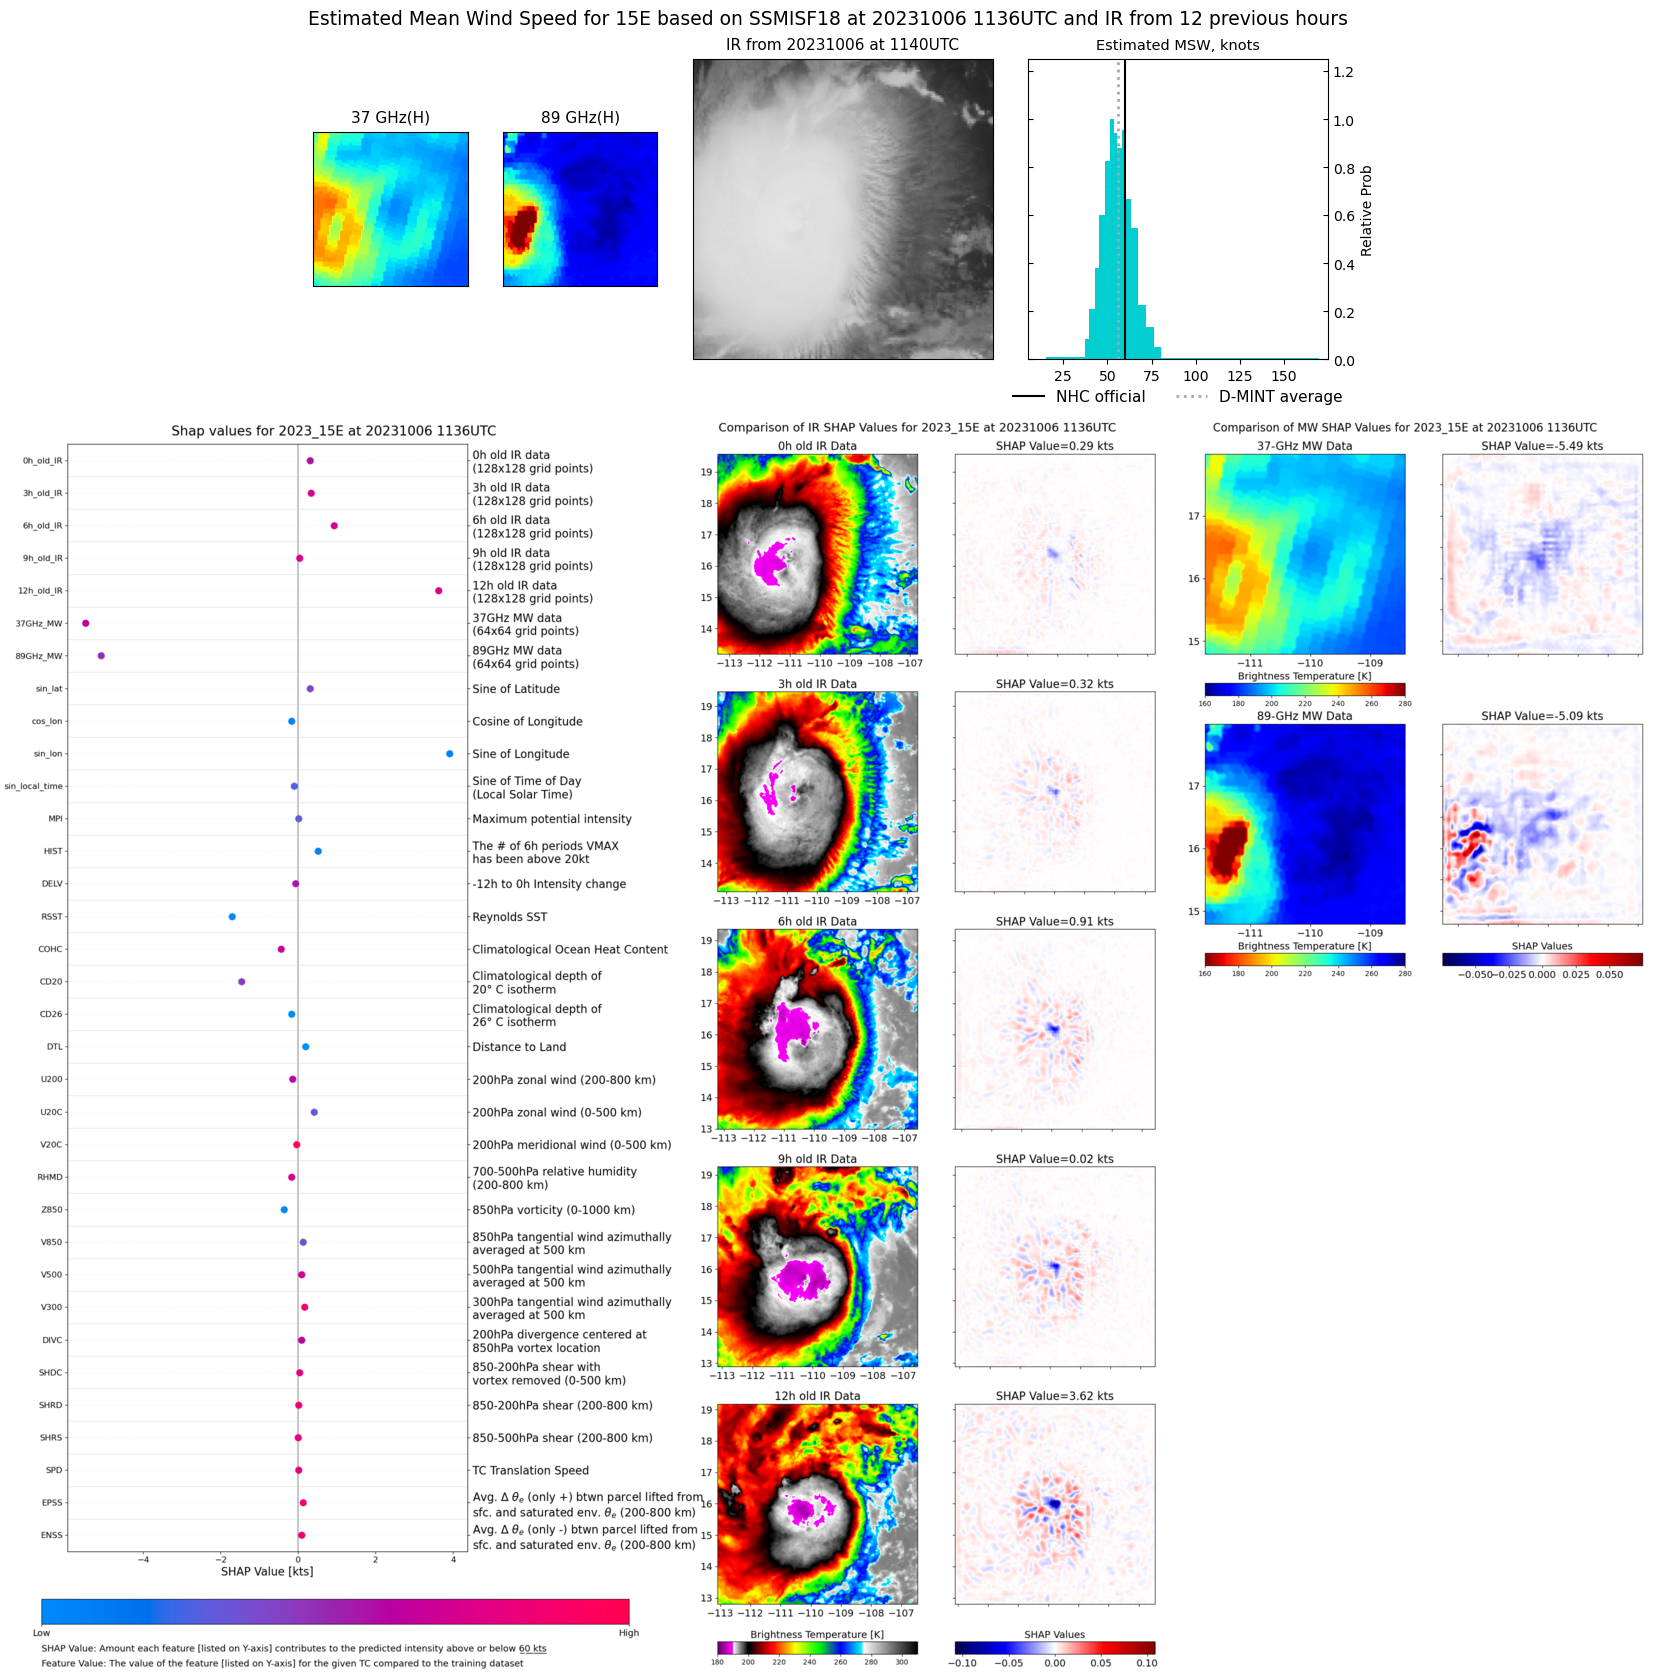 |
| 20231006 | 0721 UTC | GMI | 998 hPa | 58 kts | 52 kts | 65 kts | 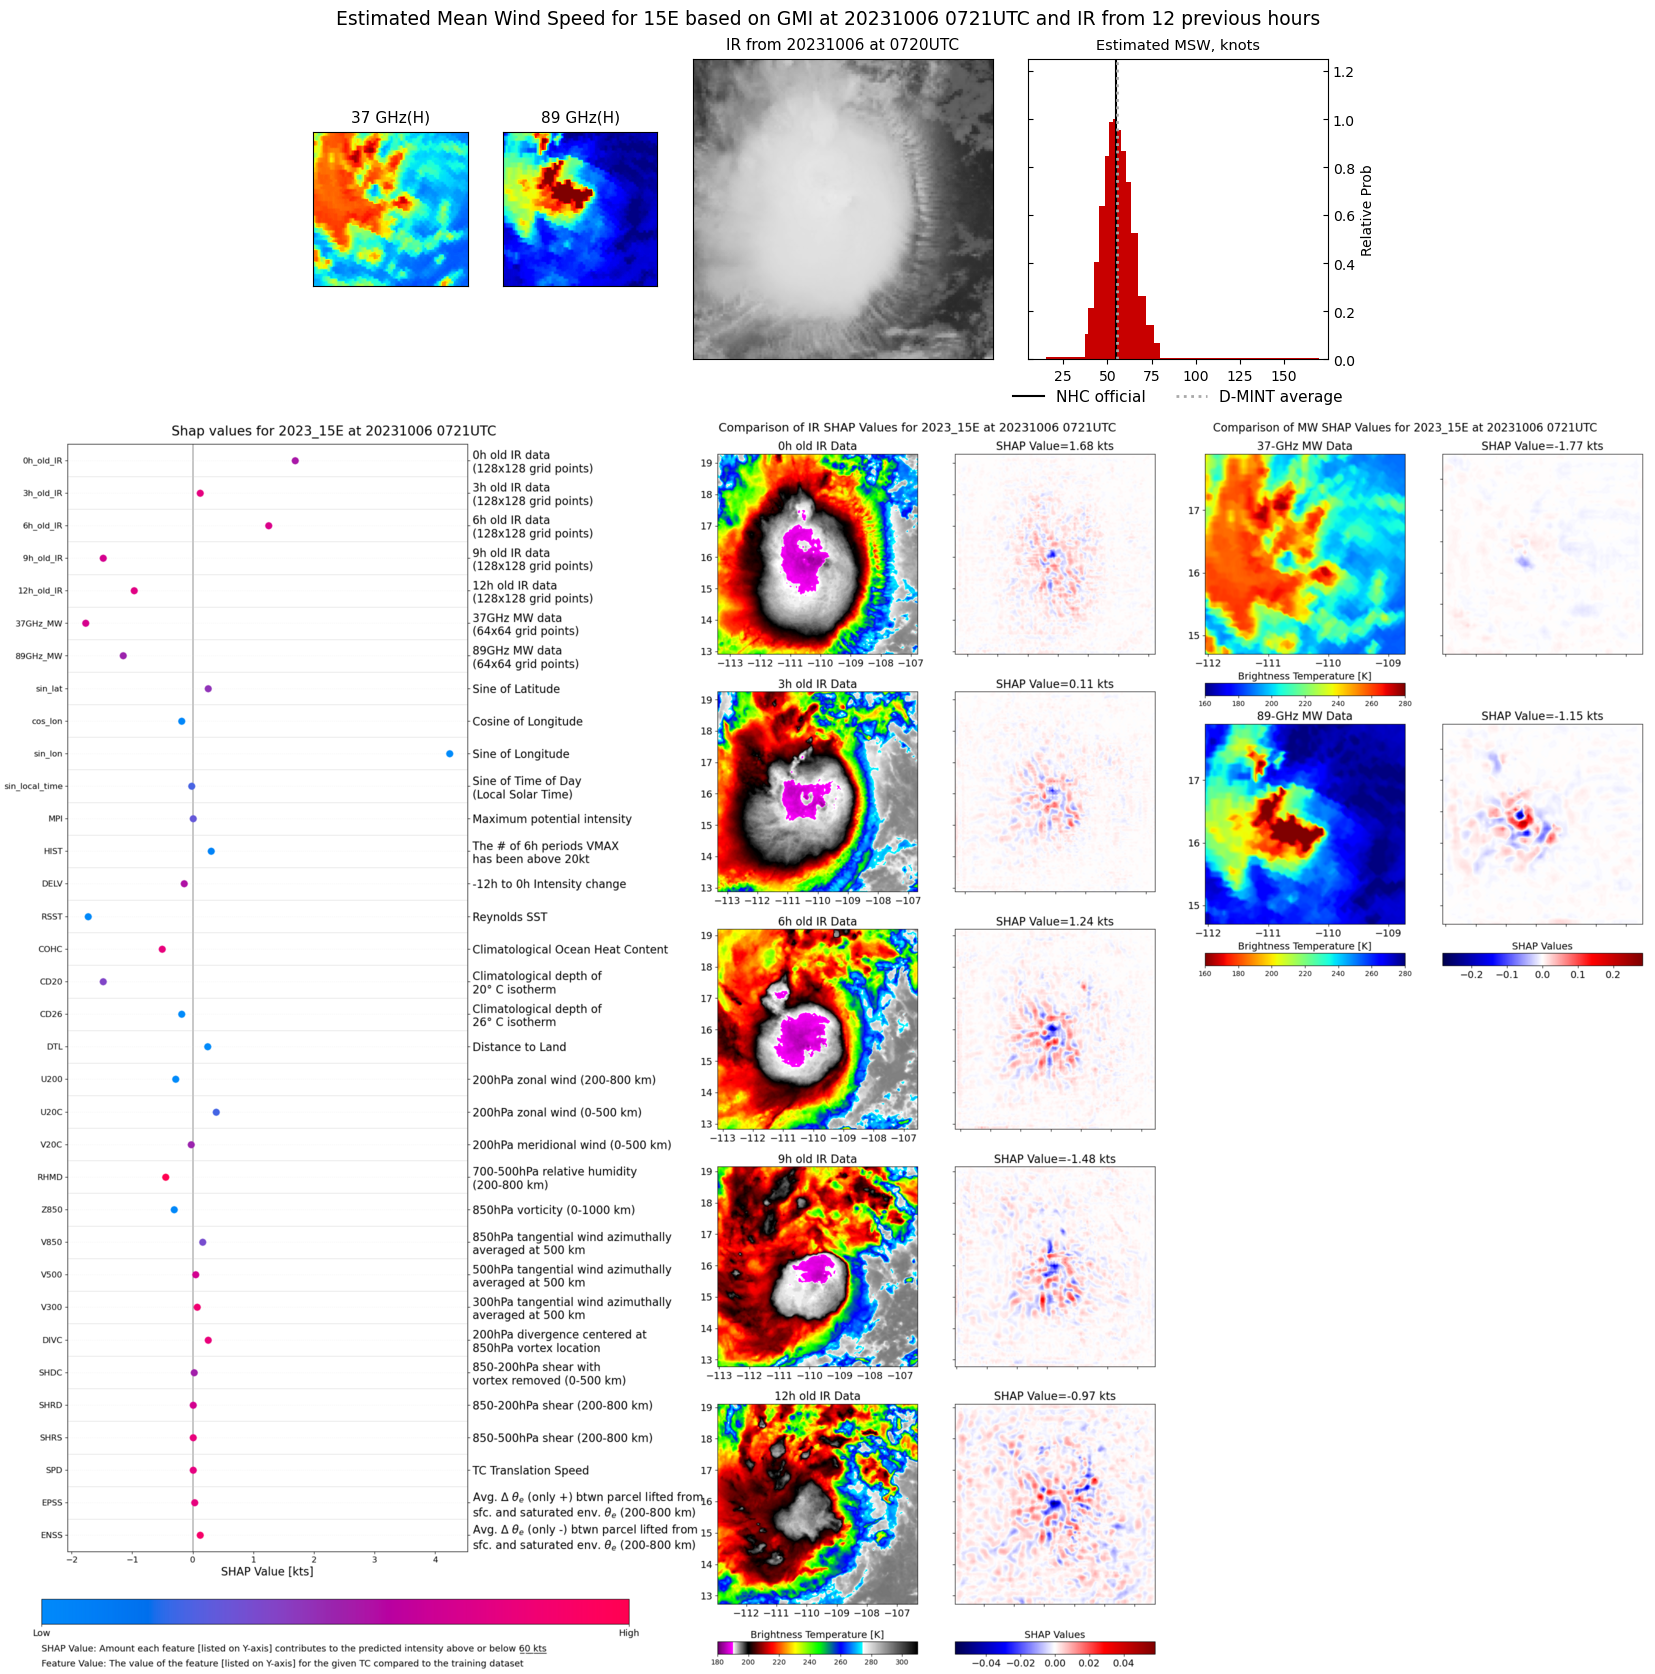 |
| 20231006 | 0054 UTC | SSMISF16 | 1000 hPa | 55 kts | 49 kts | 62 kts | 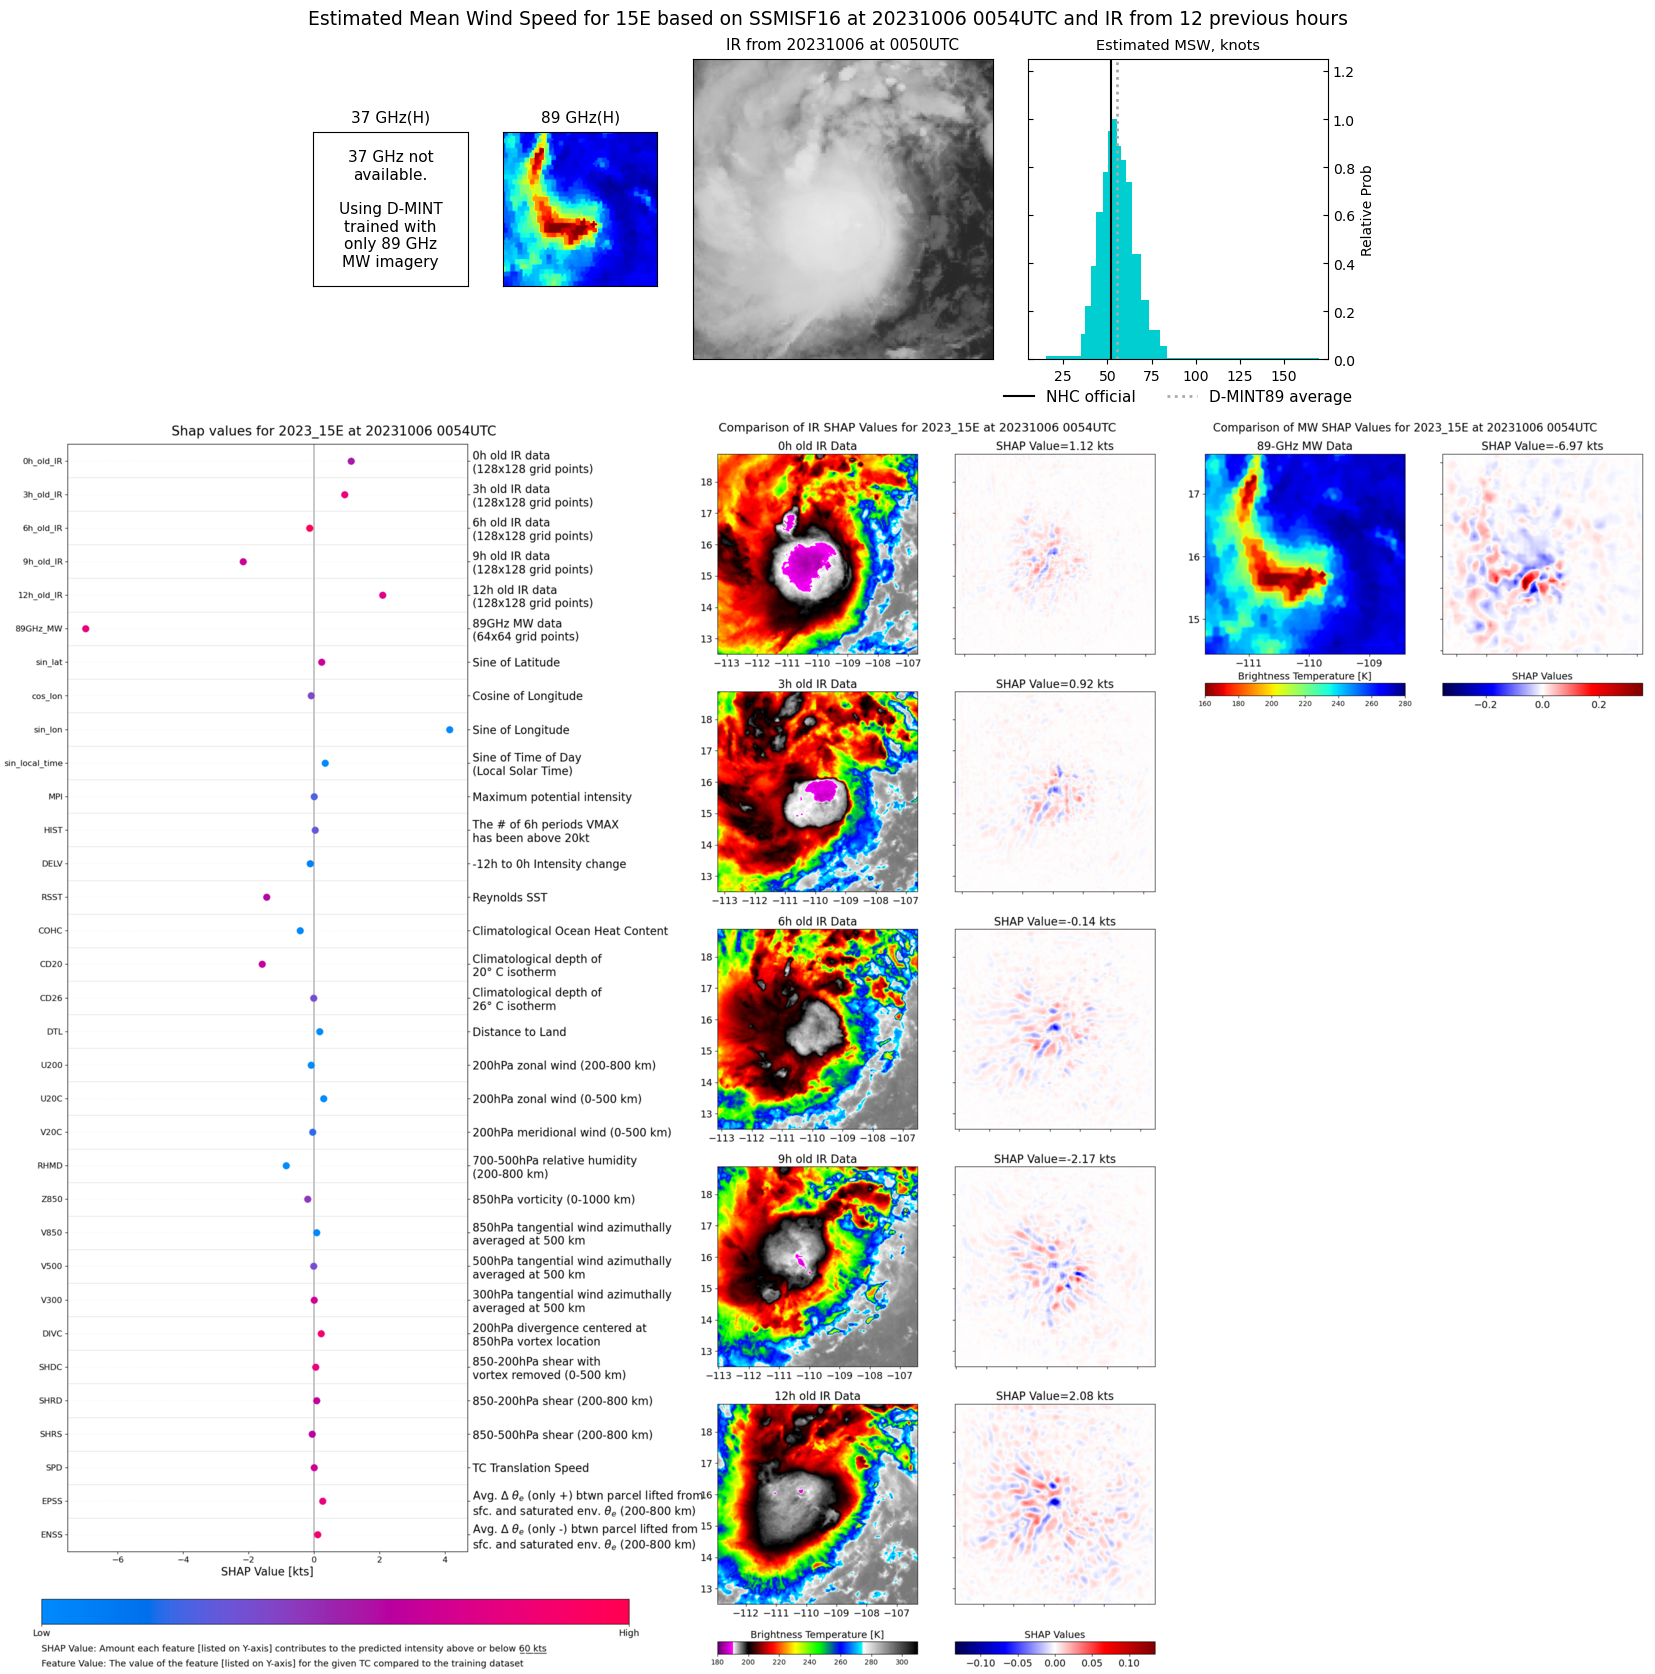 |
| 20231005 | 2301 UTC | SSMISF18 | 997 hPa | 49 kts | 44 kts | 55 kts | 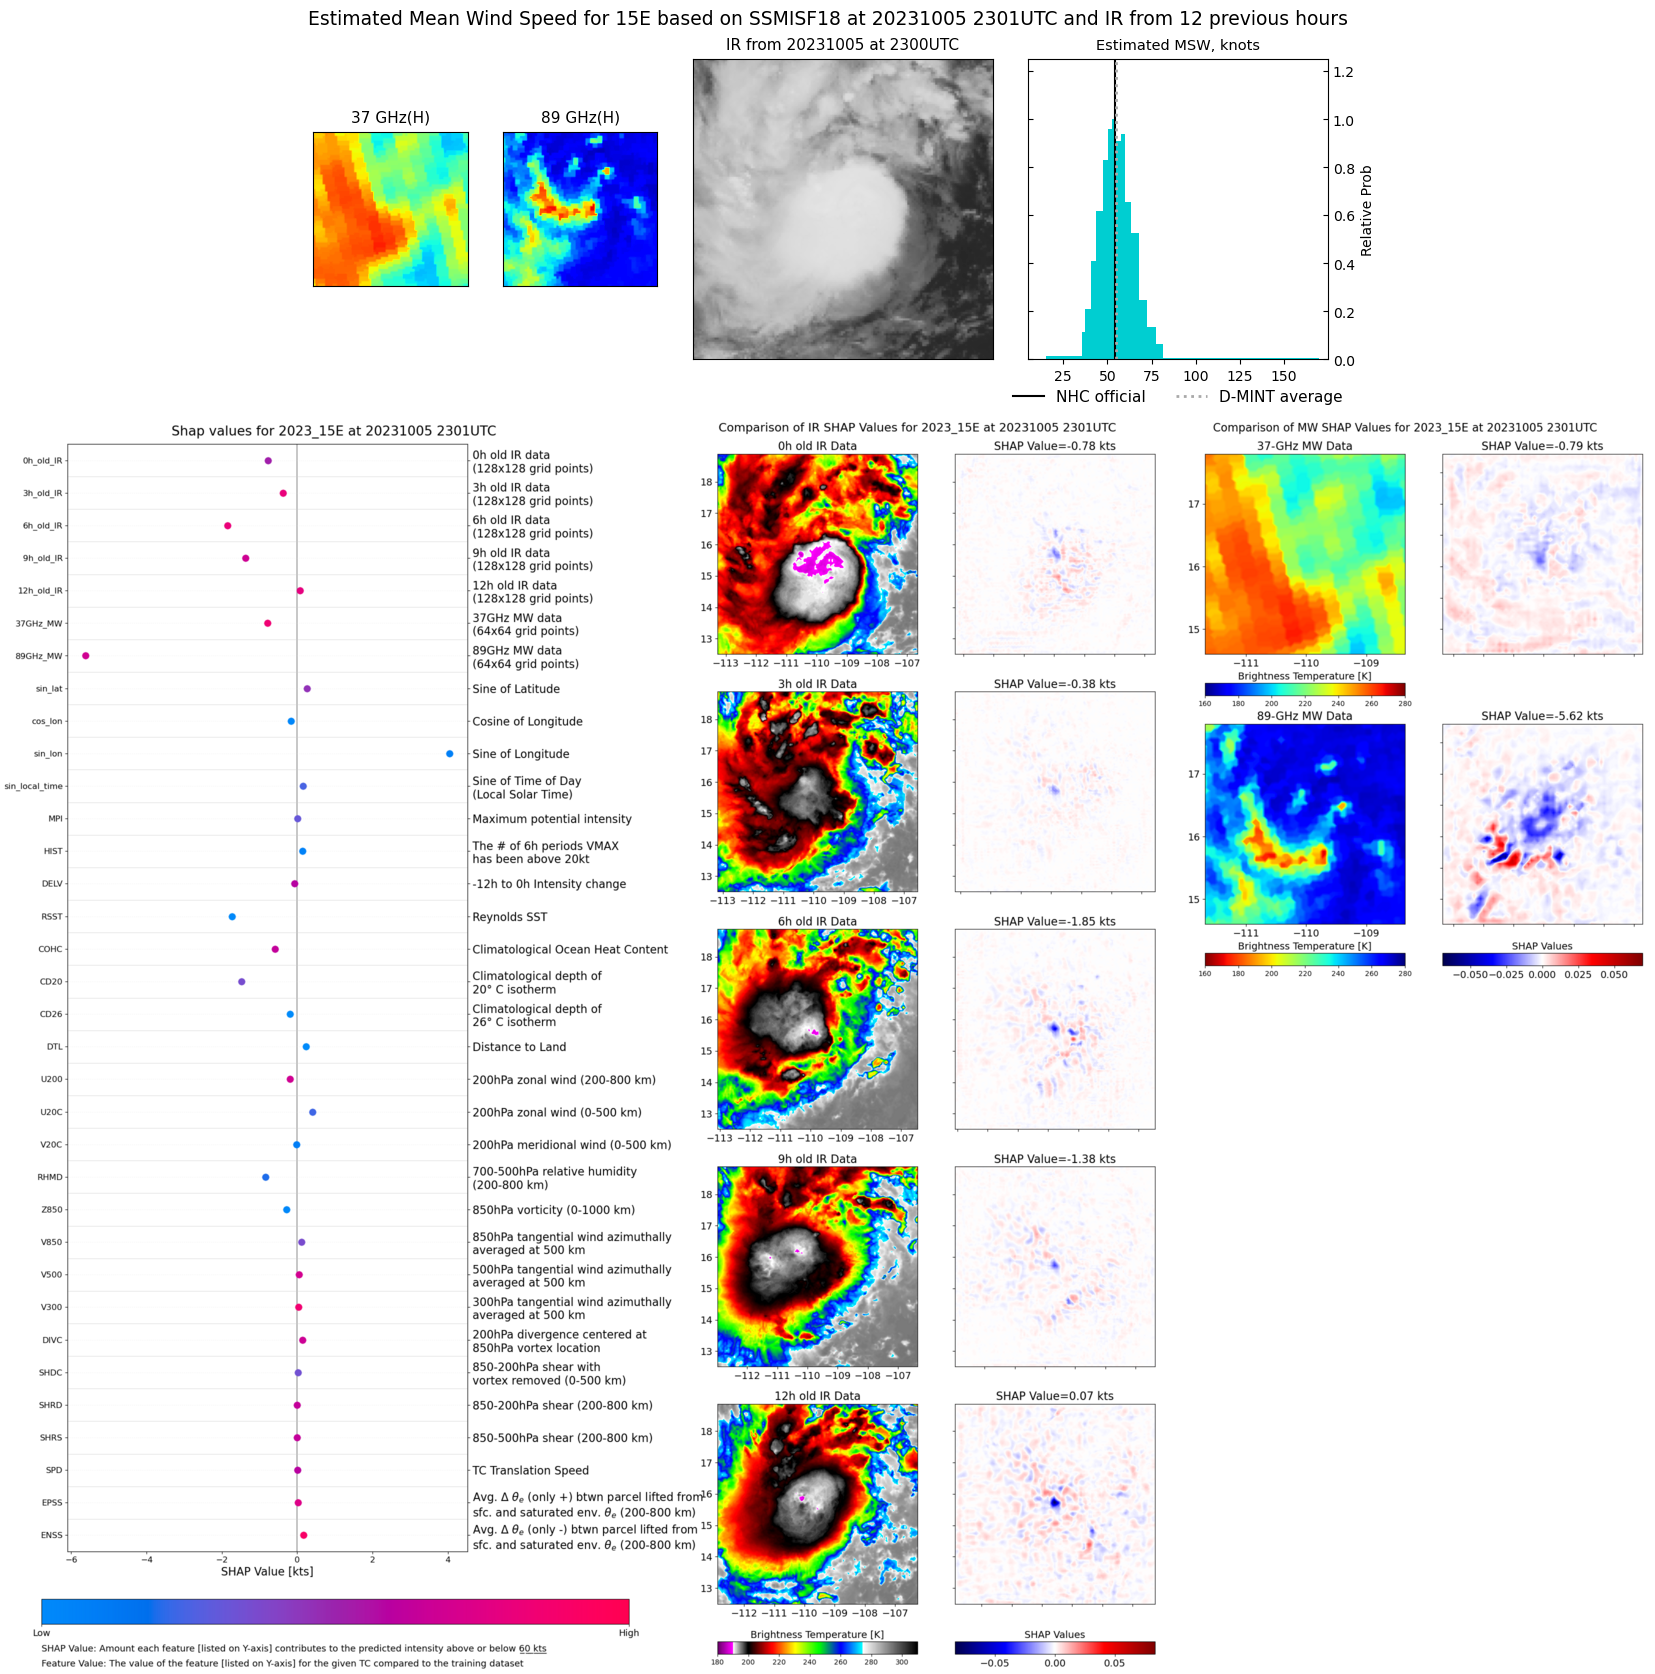 |
| 20231005 | 1324 UTC | SSMISF17 | 1001 hPa | 43 kts | 39 kts | 48 kts | 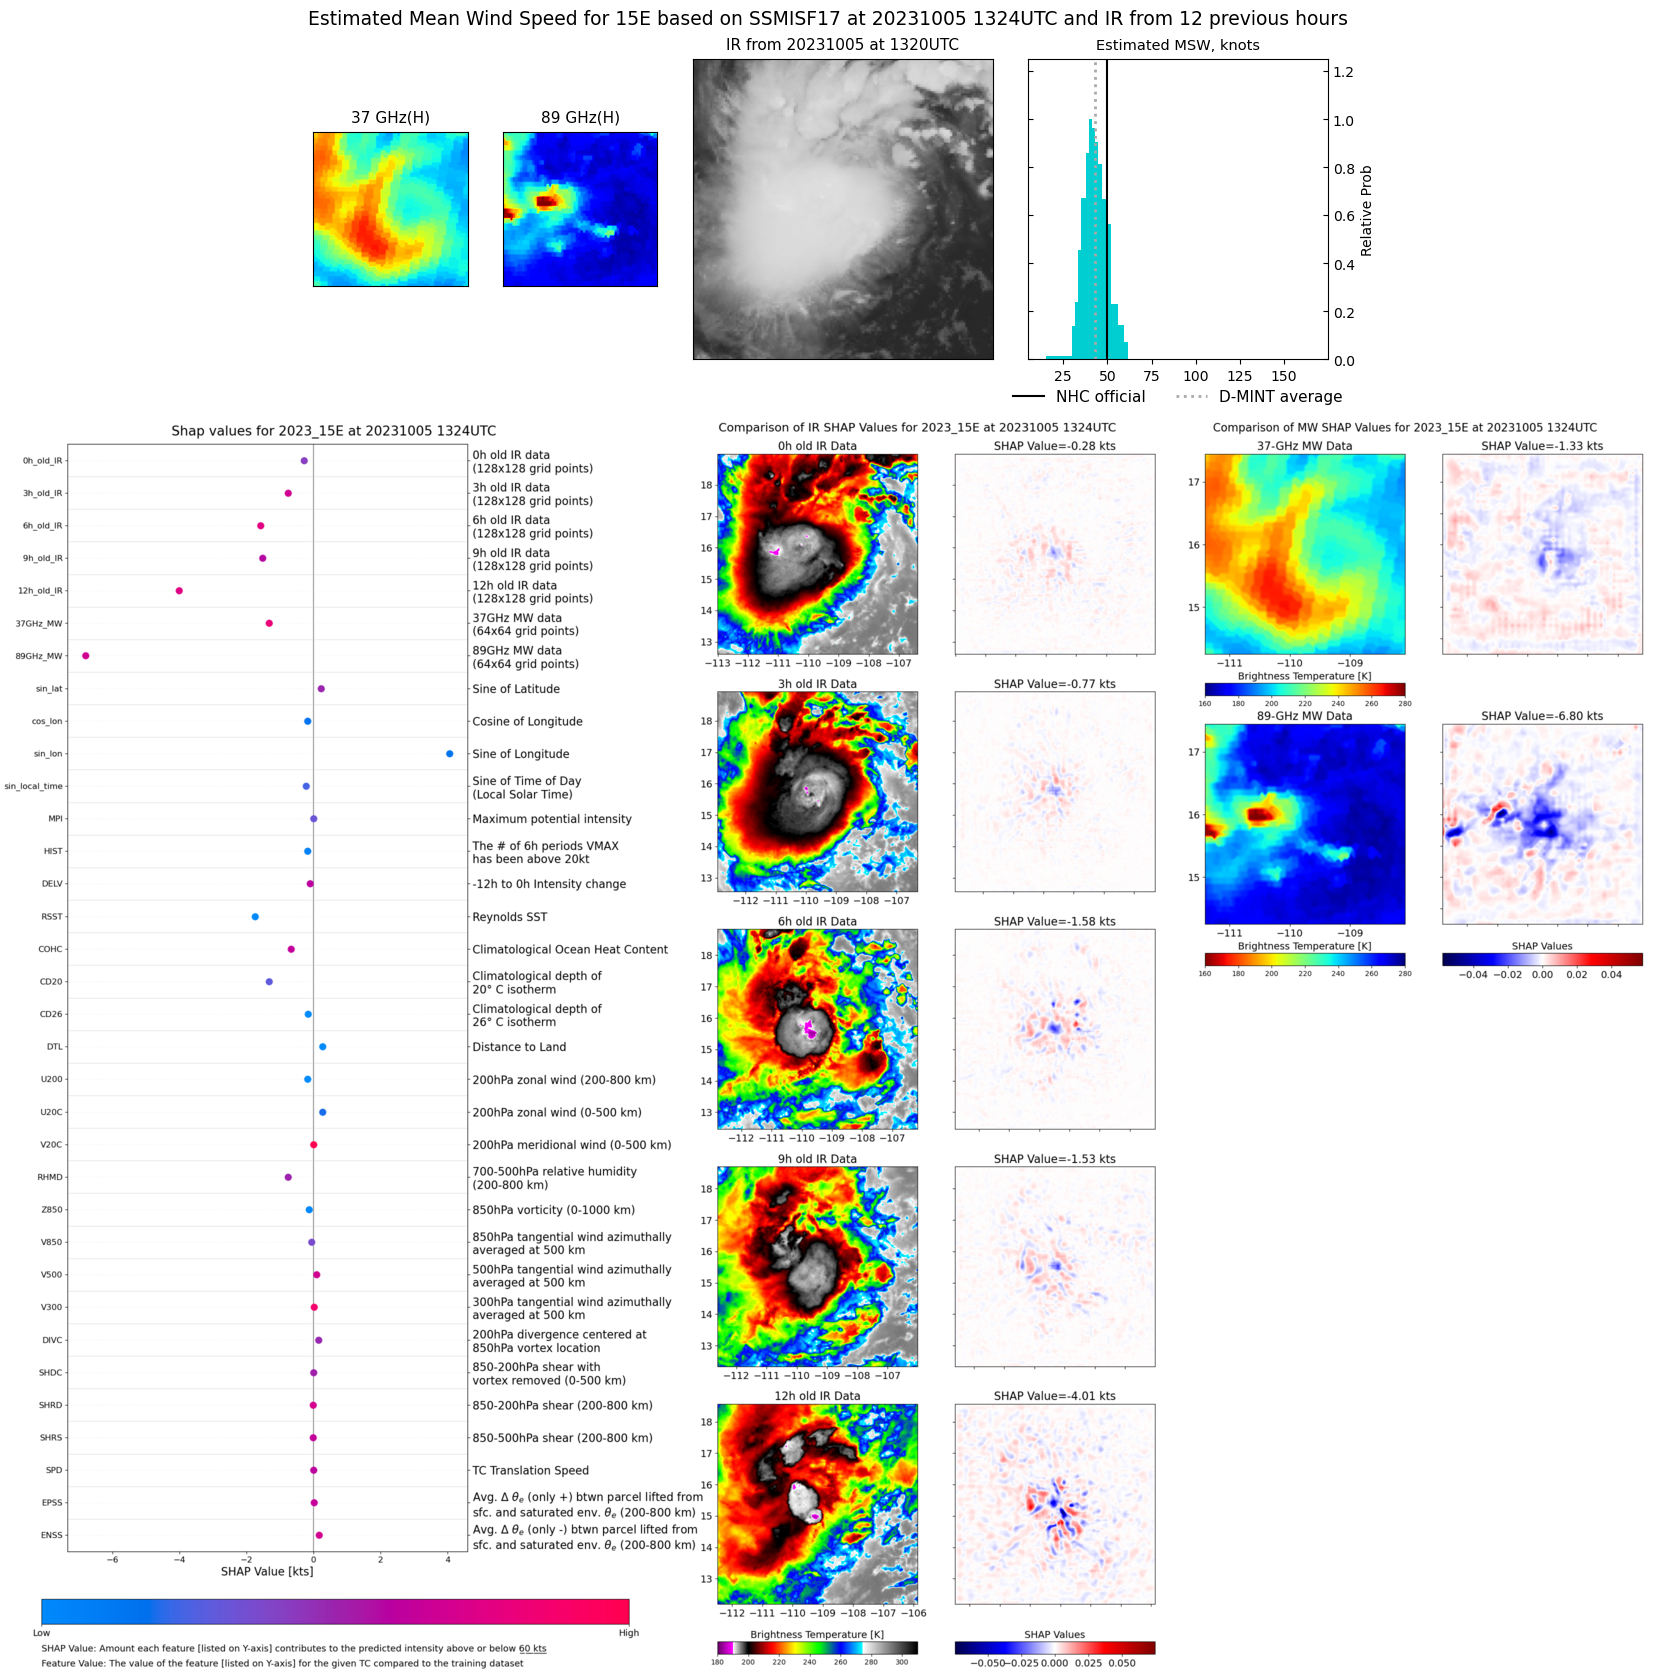 |
| 20231005 | 1151 UTC | SSMISF18 | 997 hPa | 51 kts | 45 kts | 57 kts | 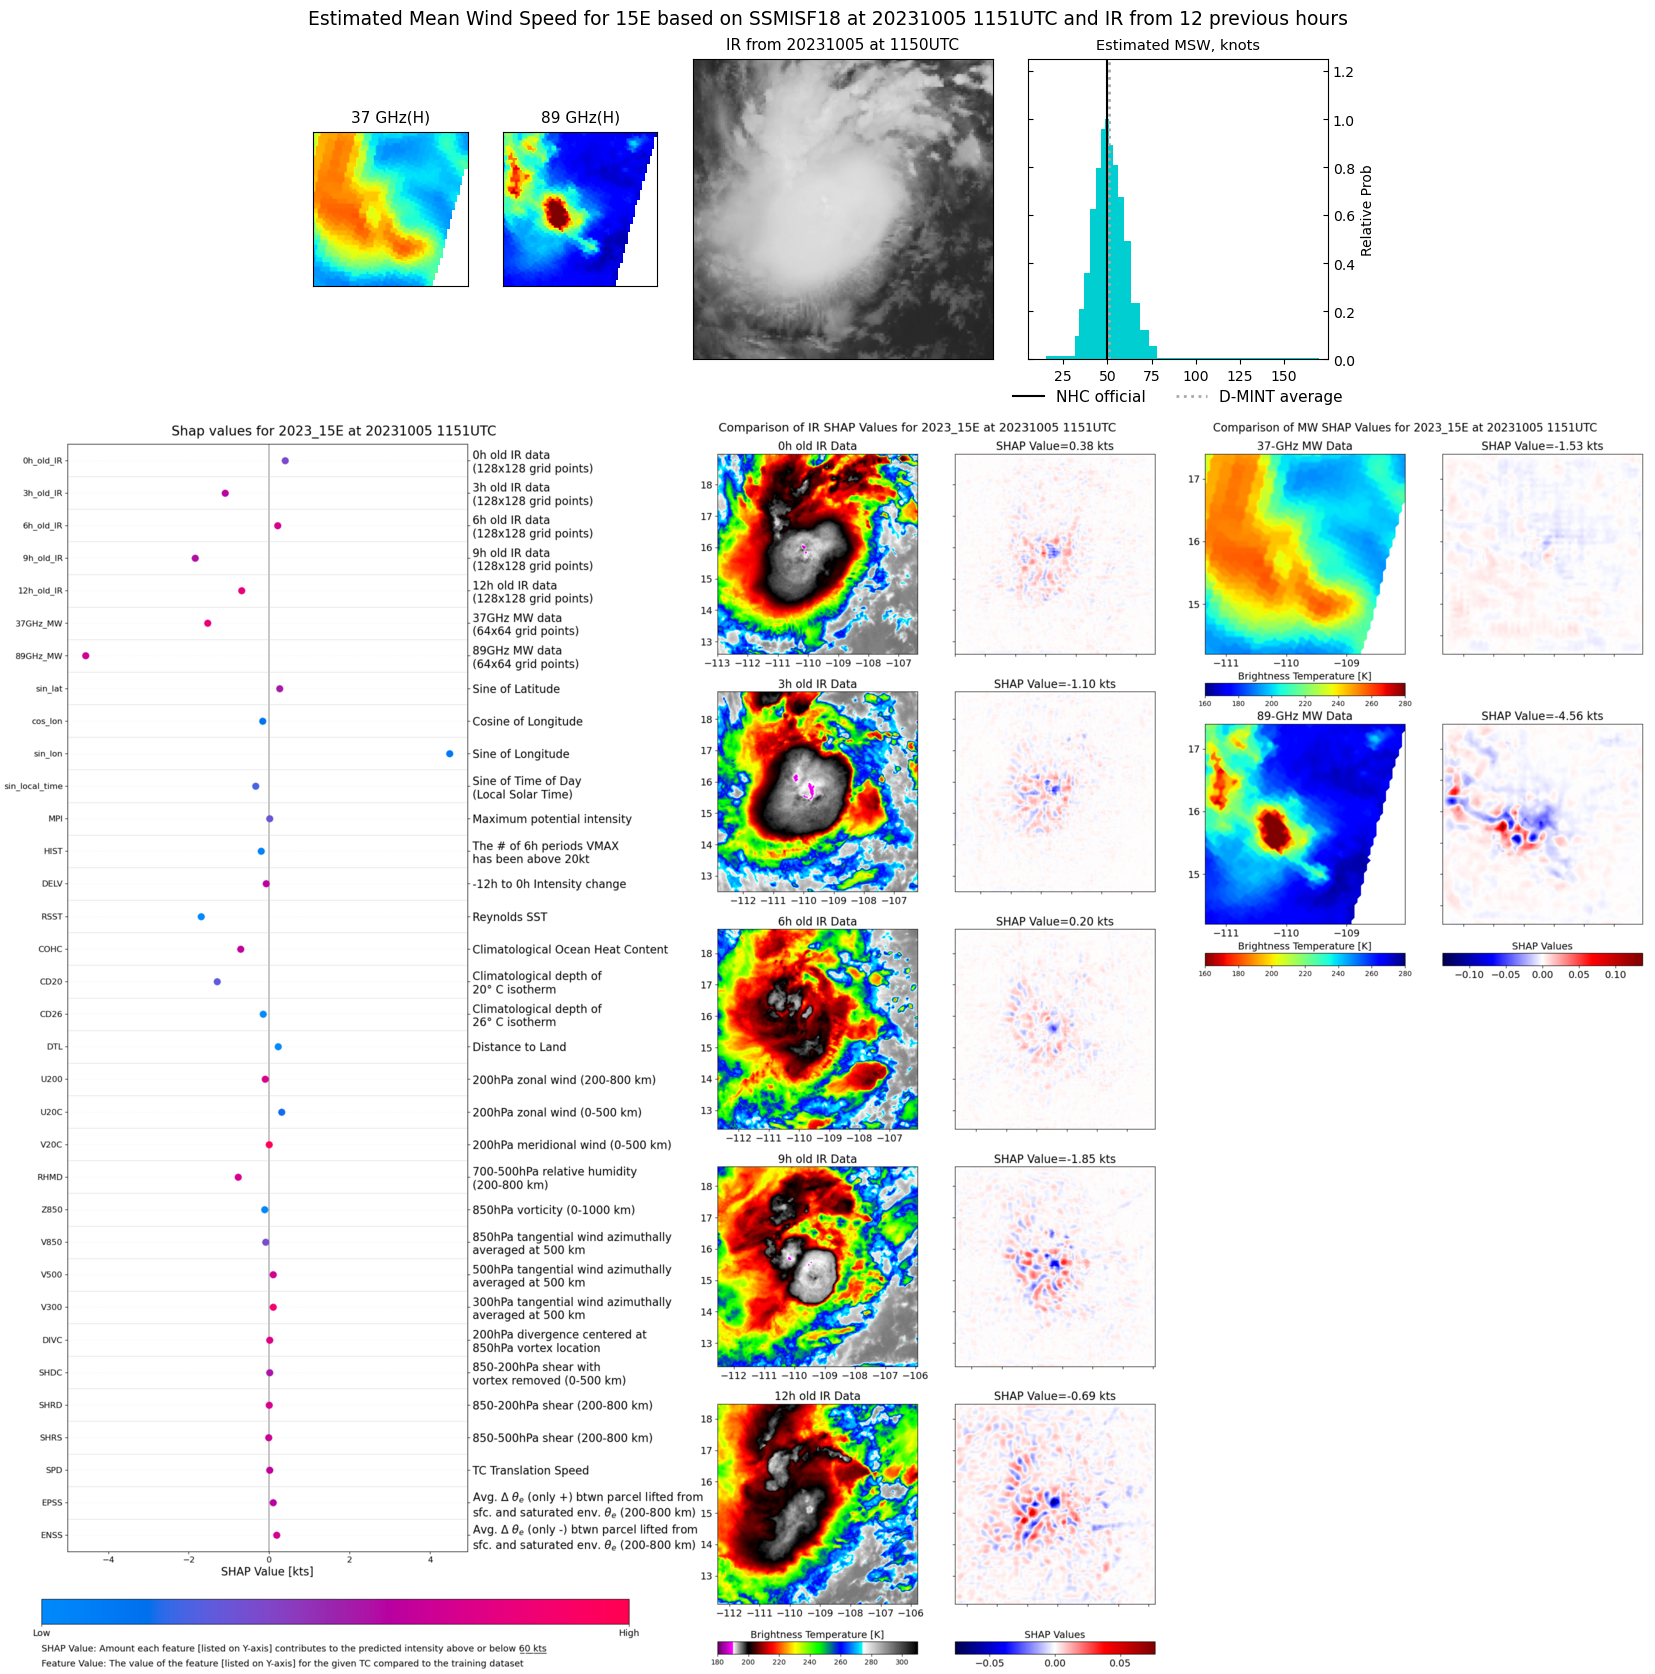 |
| 20231005 | 0850 UTC | AMSR2 | 1000 hPa | 50 kts | 44 kts | 56 kts | 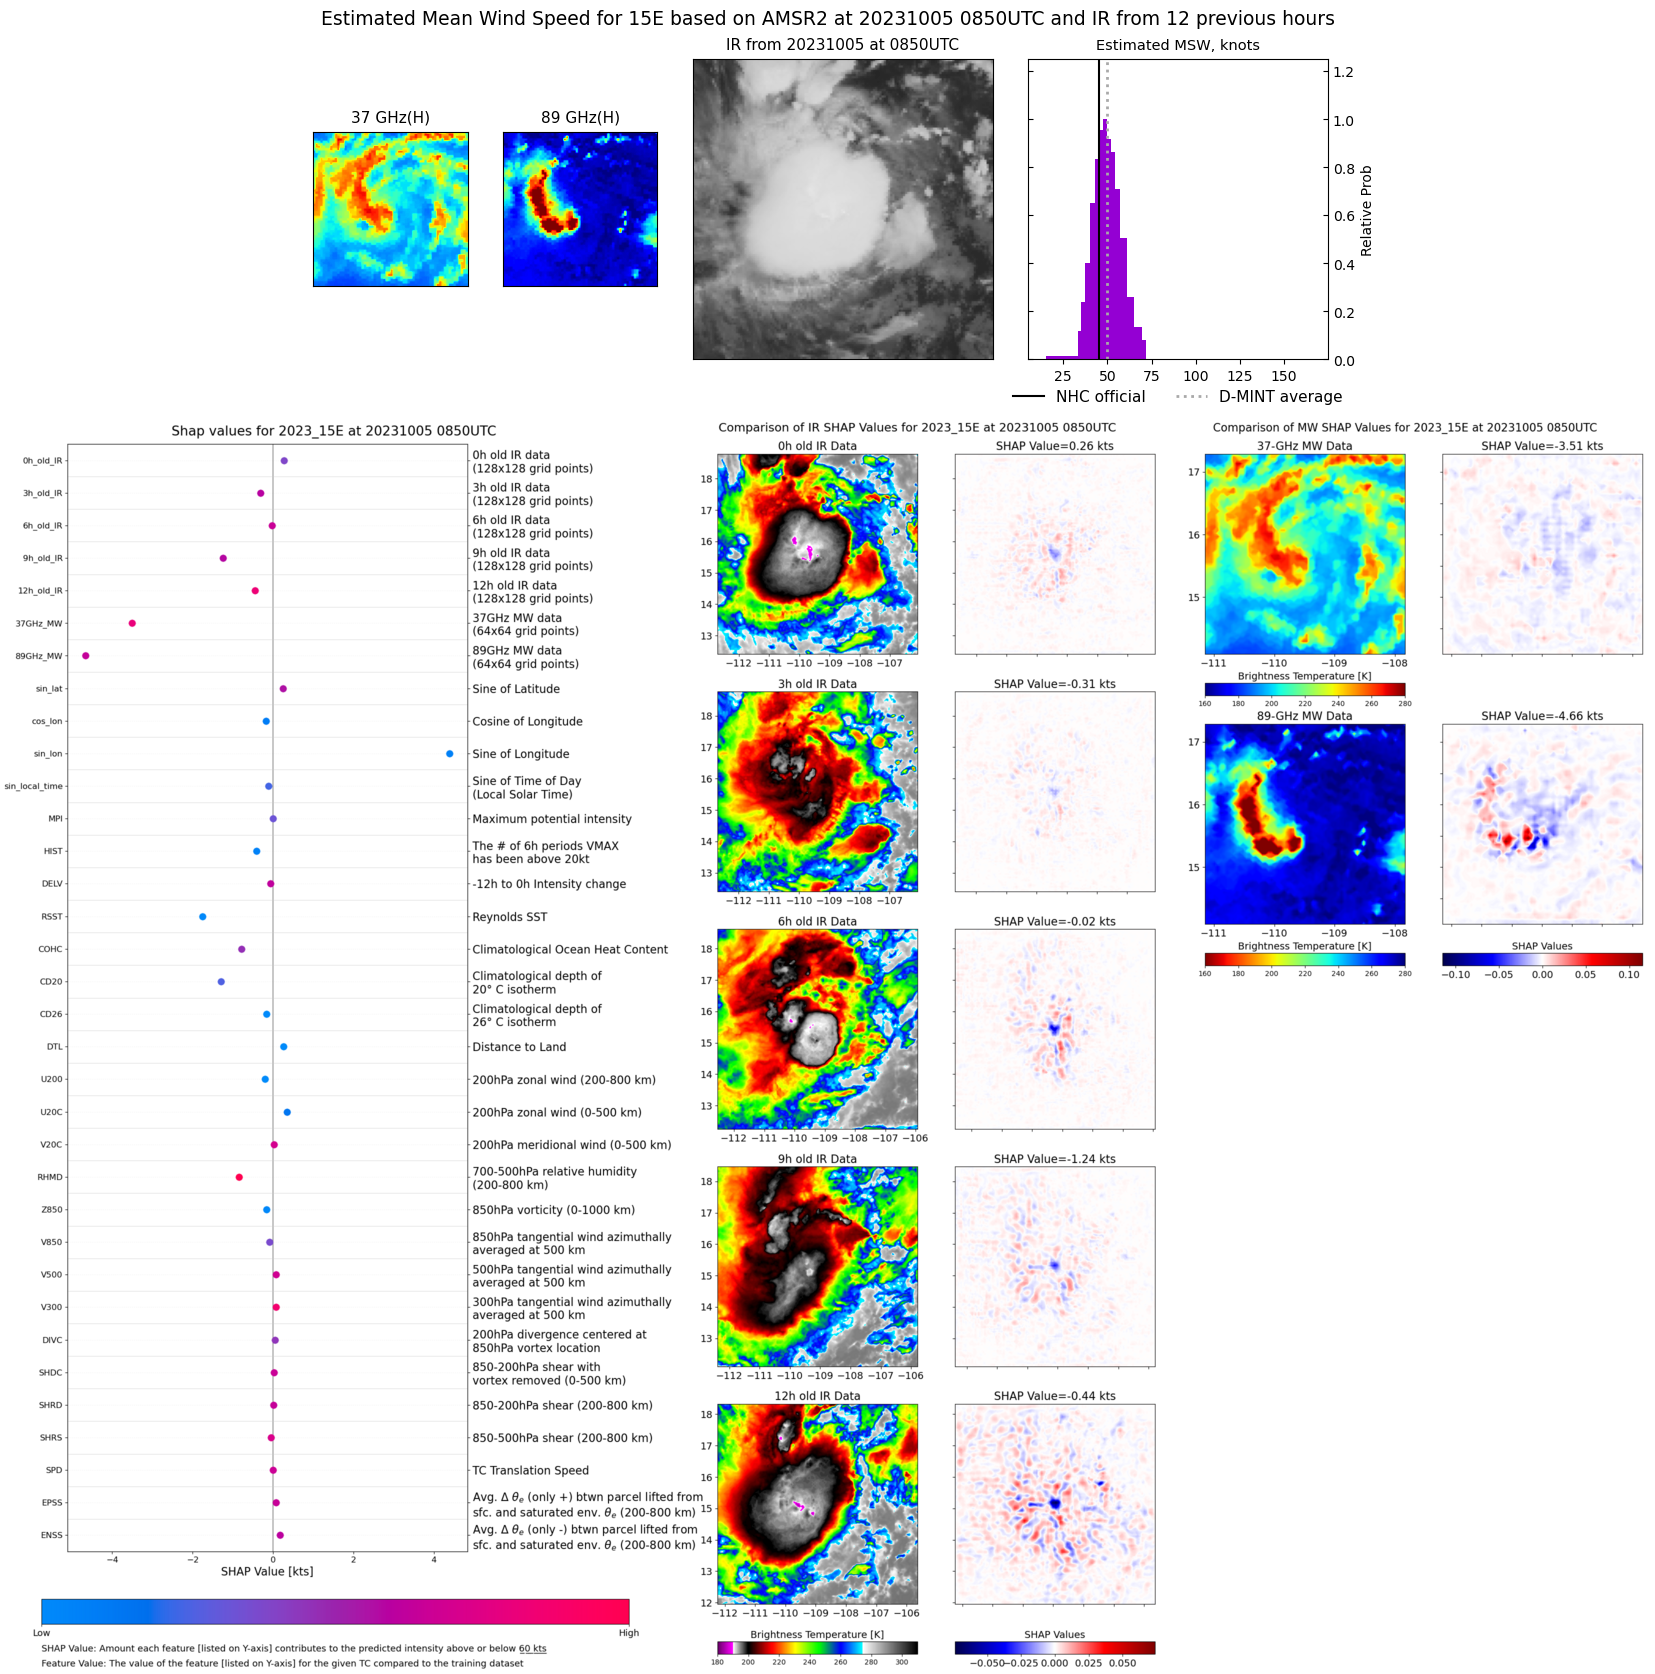 |
| 20231005 | 0108 UTC | SSMISF16 | 1000 hPa | 43 kts | 38 kts | 49 kts | 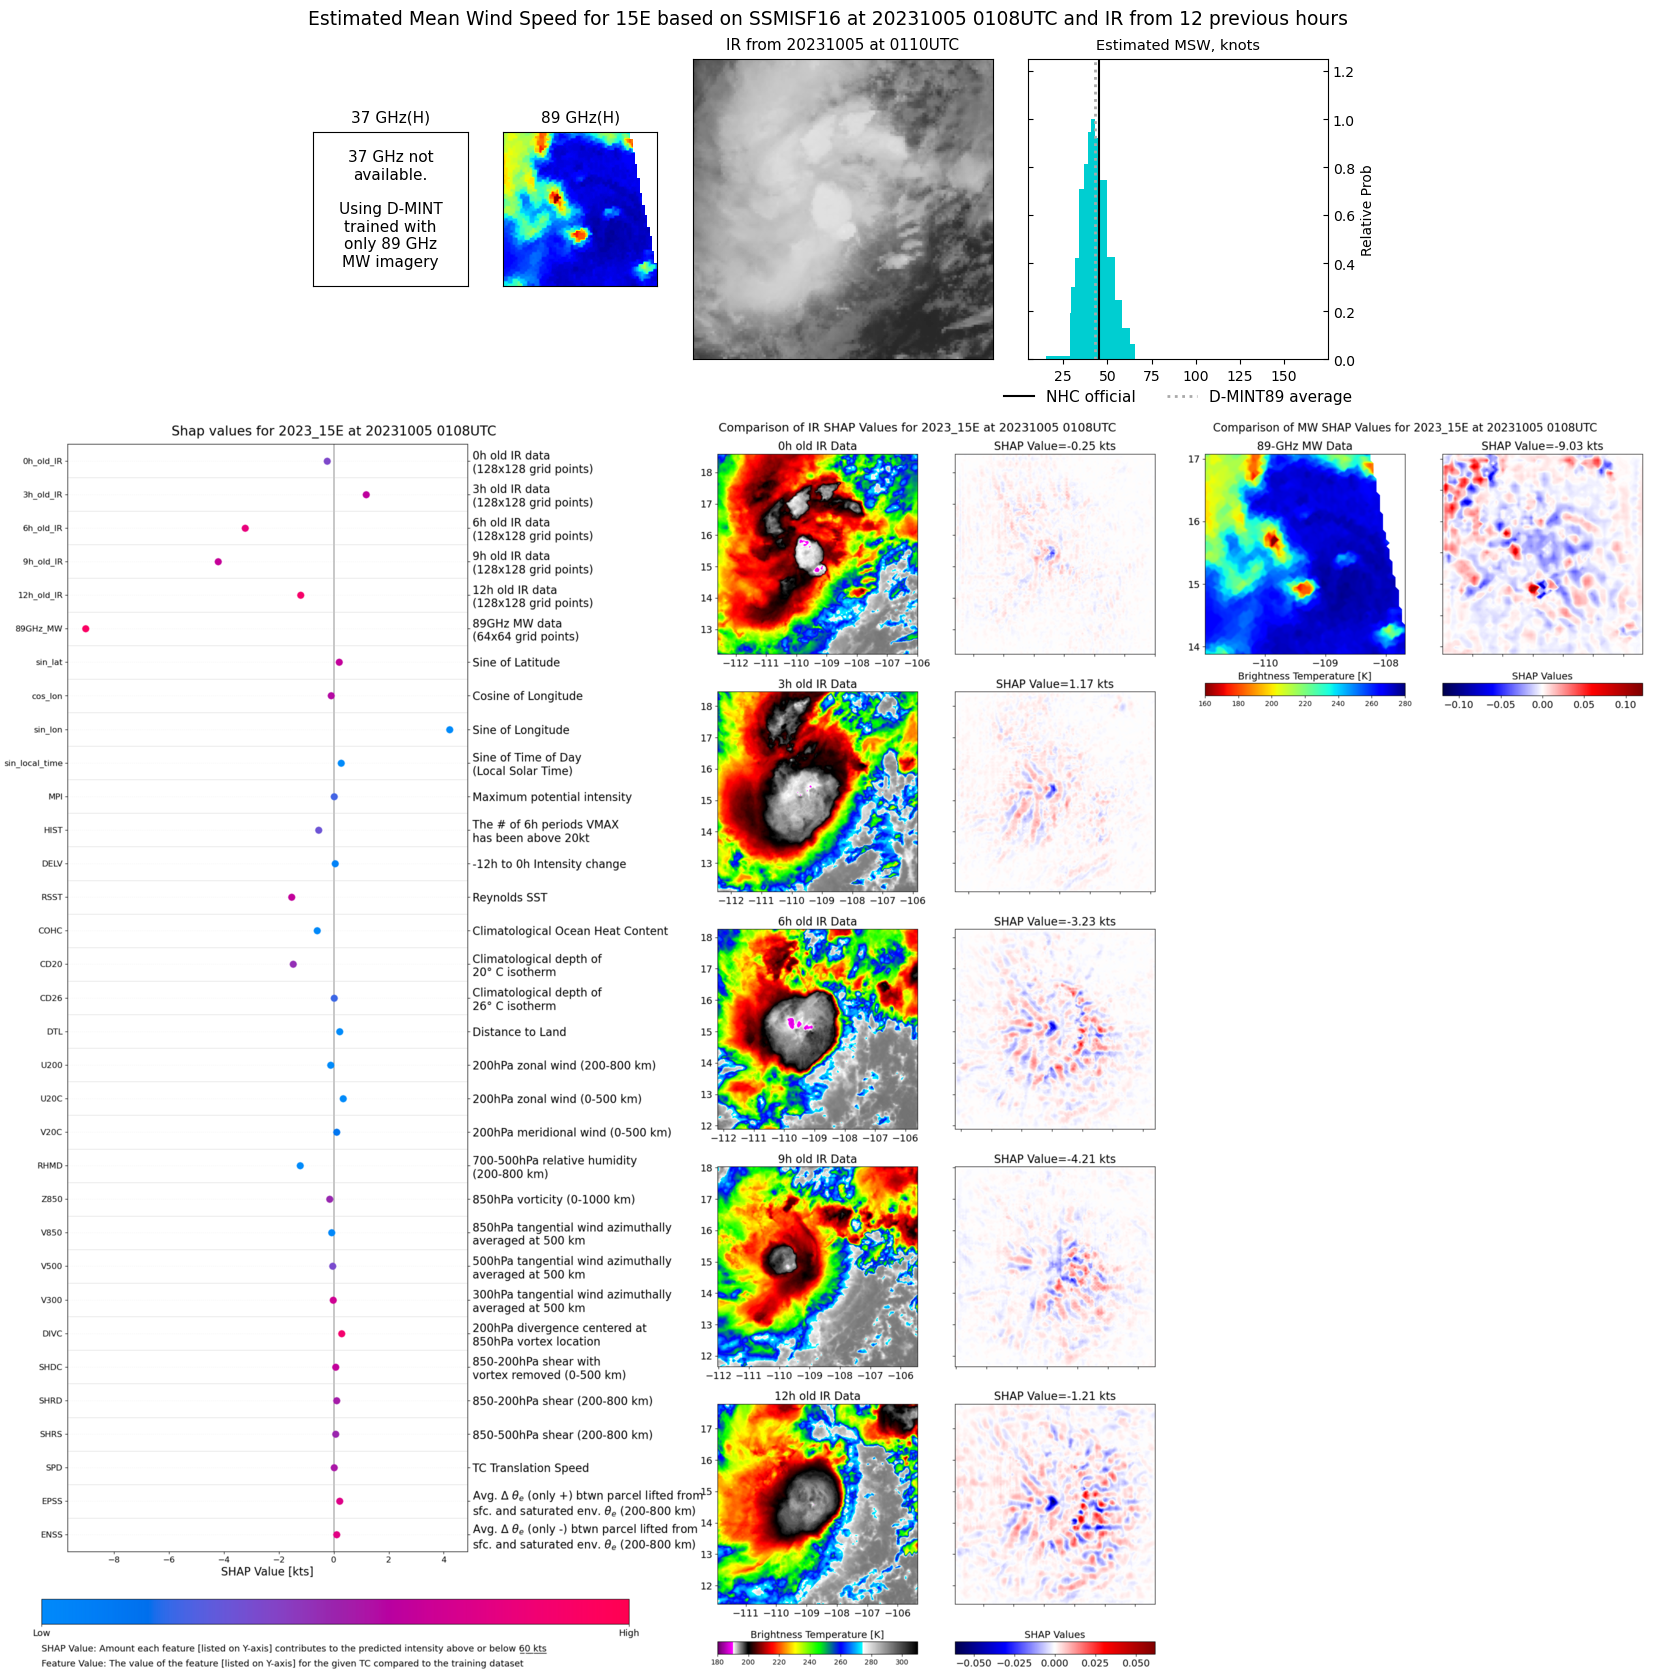 |
| 20231004 | 2315 UTC | SSMISF18 | 1001 hPa | 46 kts | 41 kts | 51 kts | 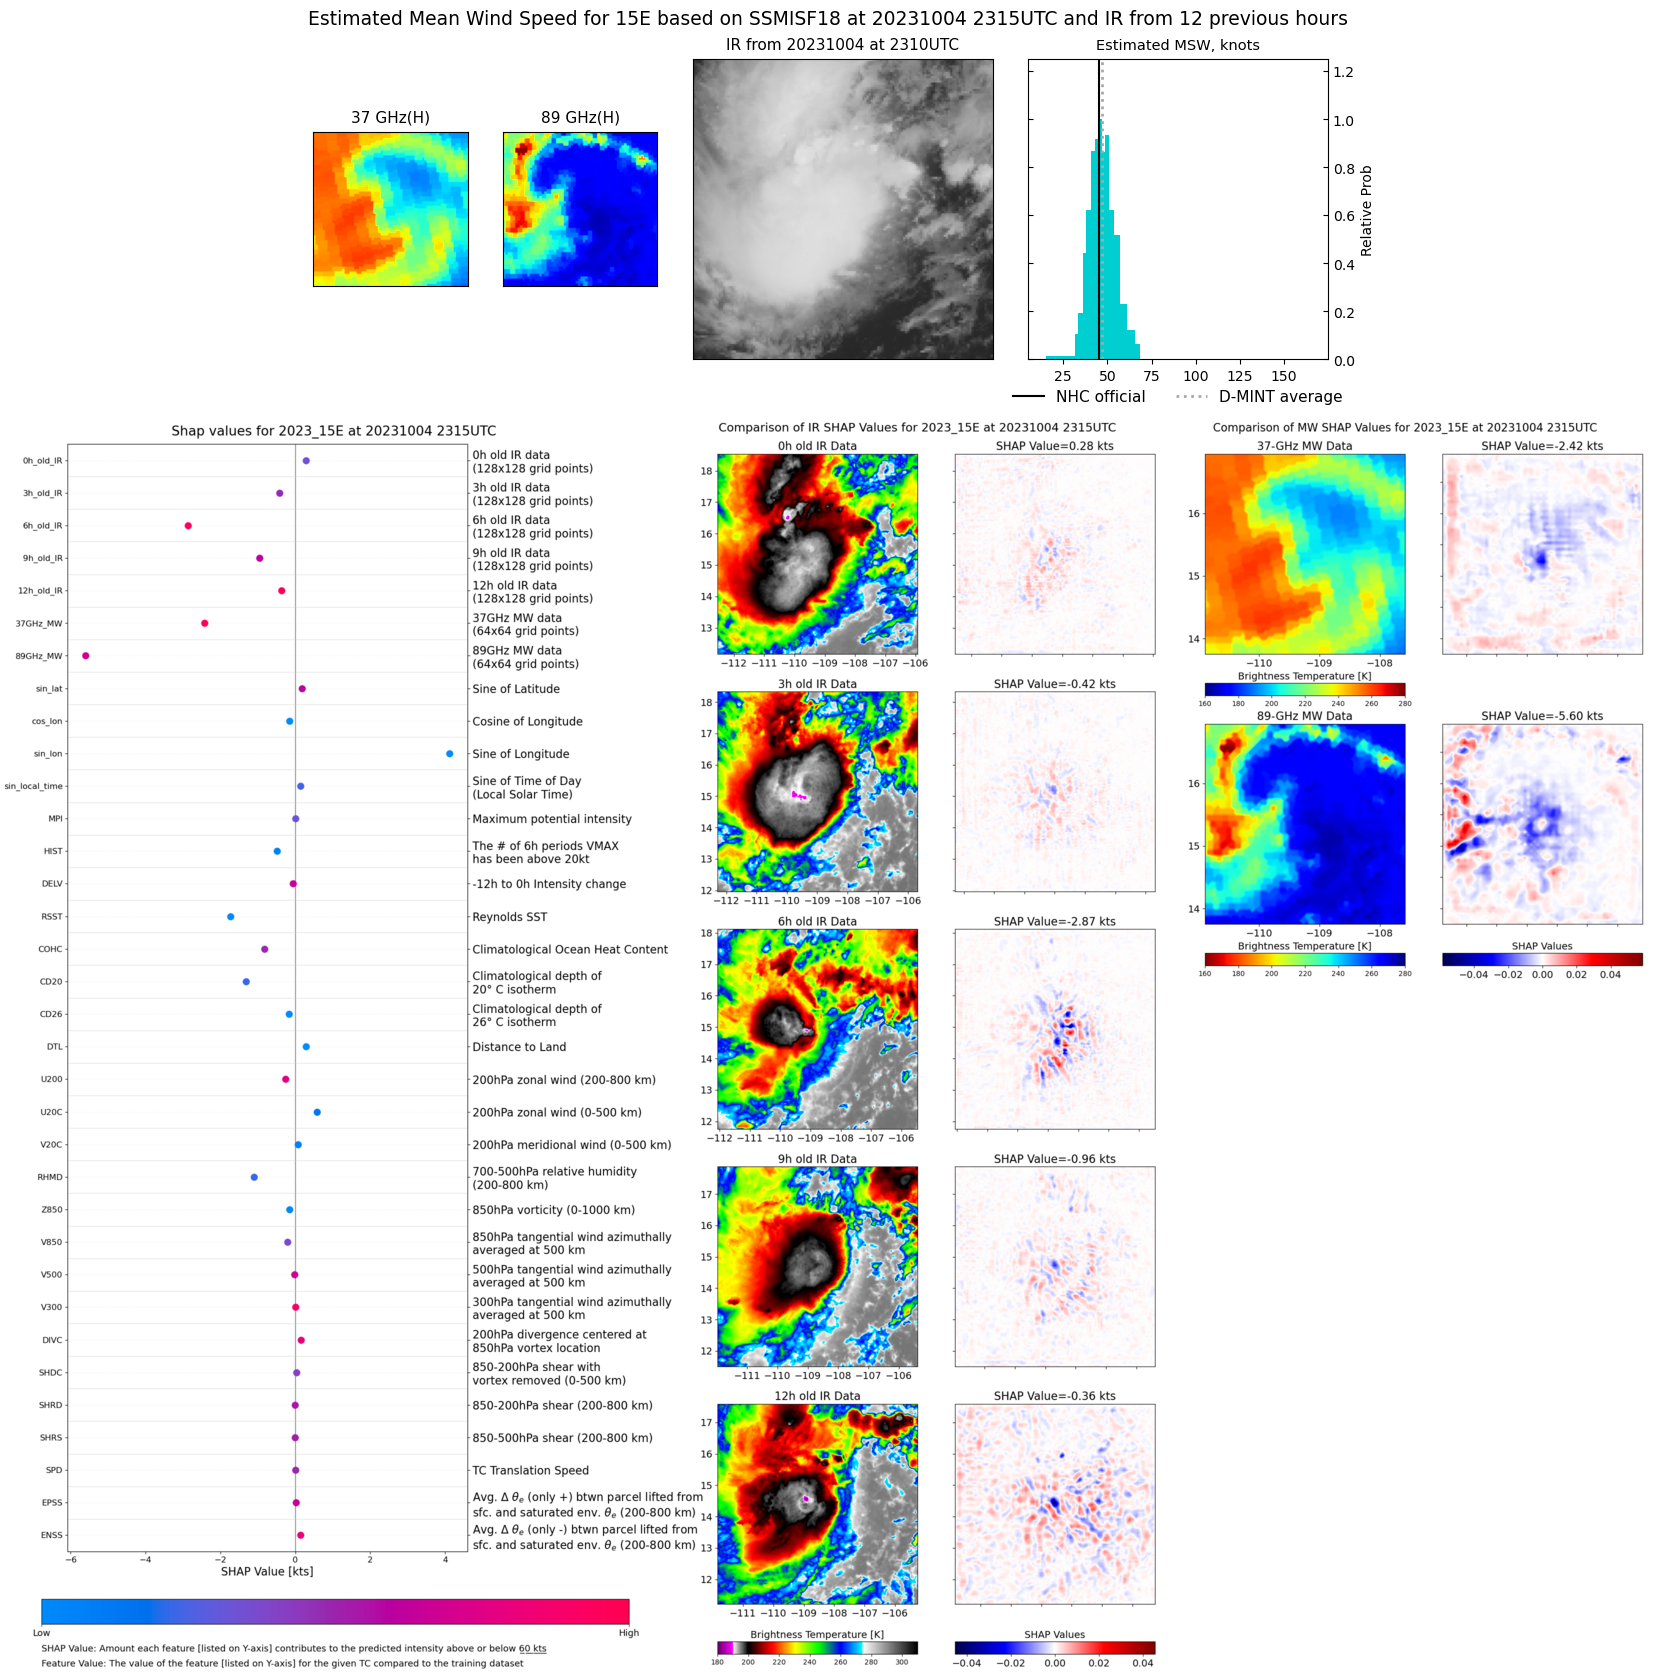 |
| 20231004 | 2037 UTC | AMSR2 | 1001 hPa | 51 kts | 45 kts | 56 kts | 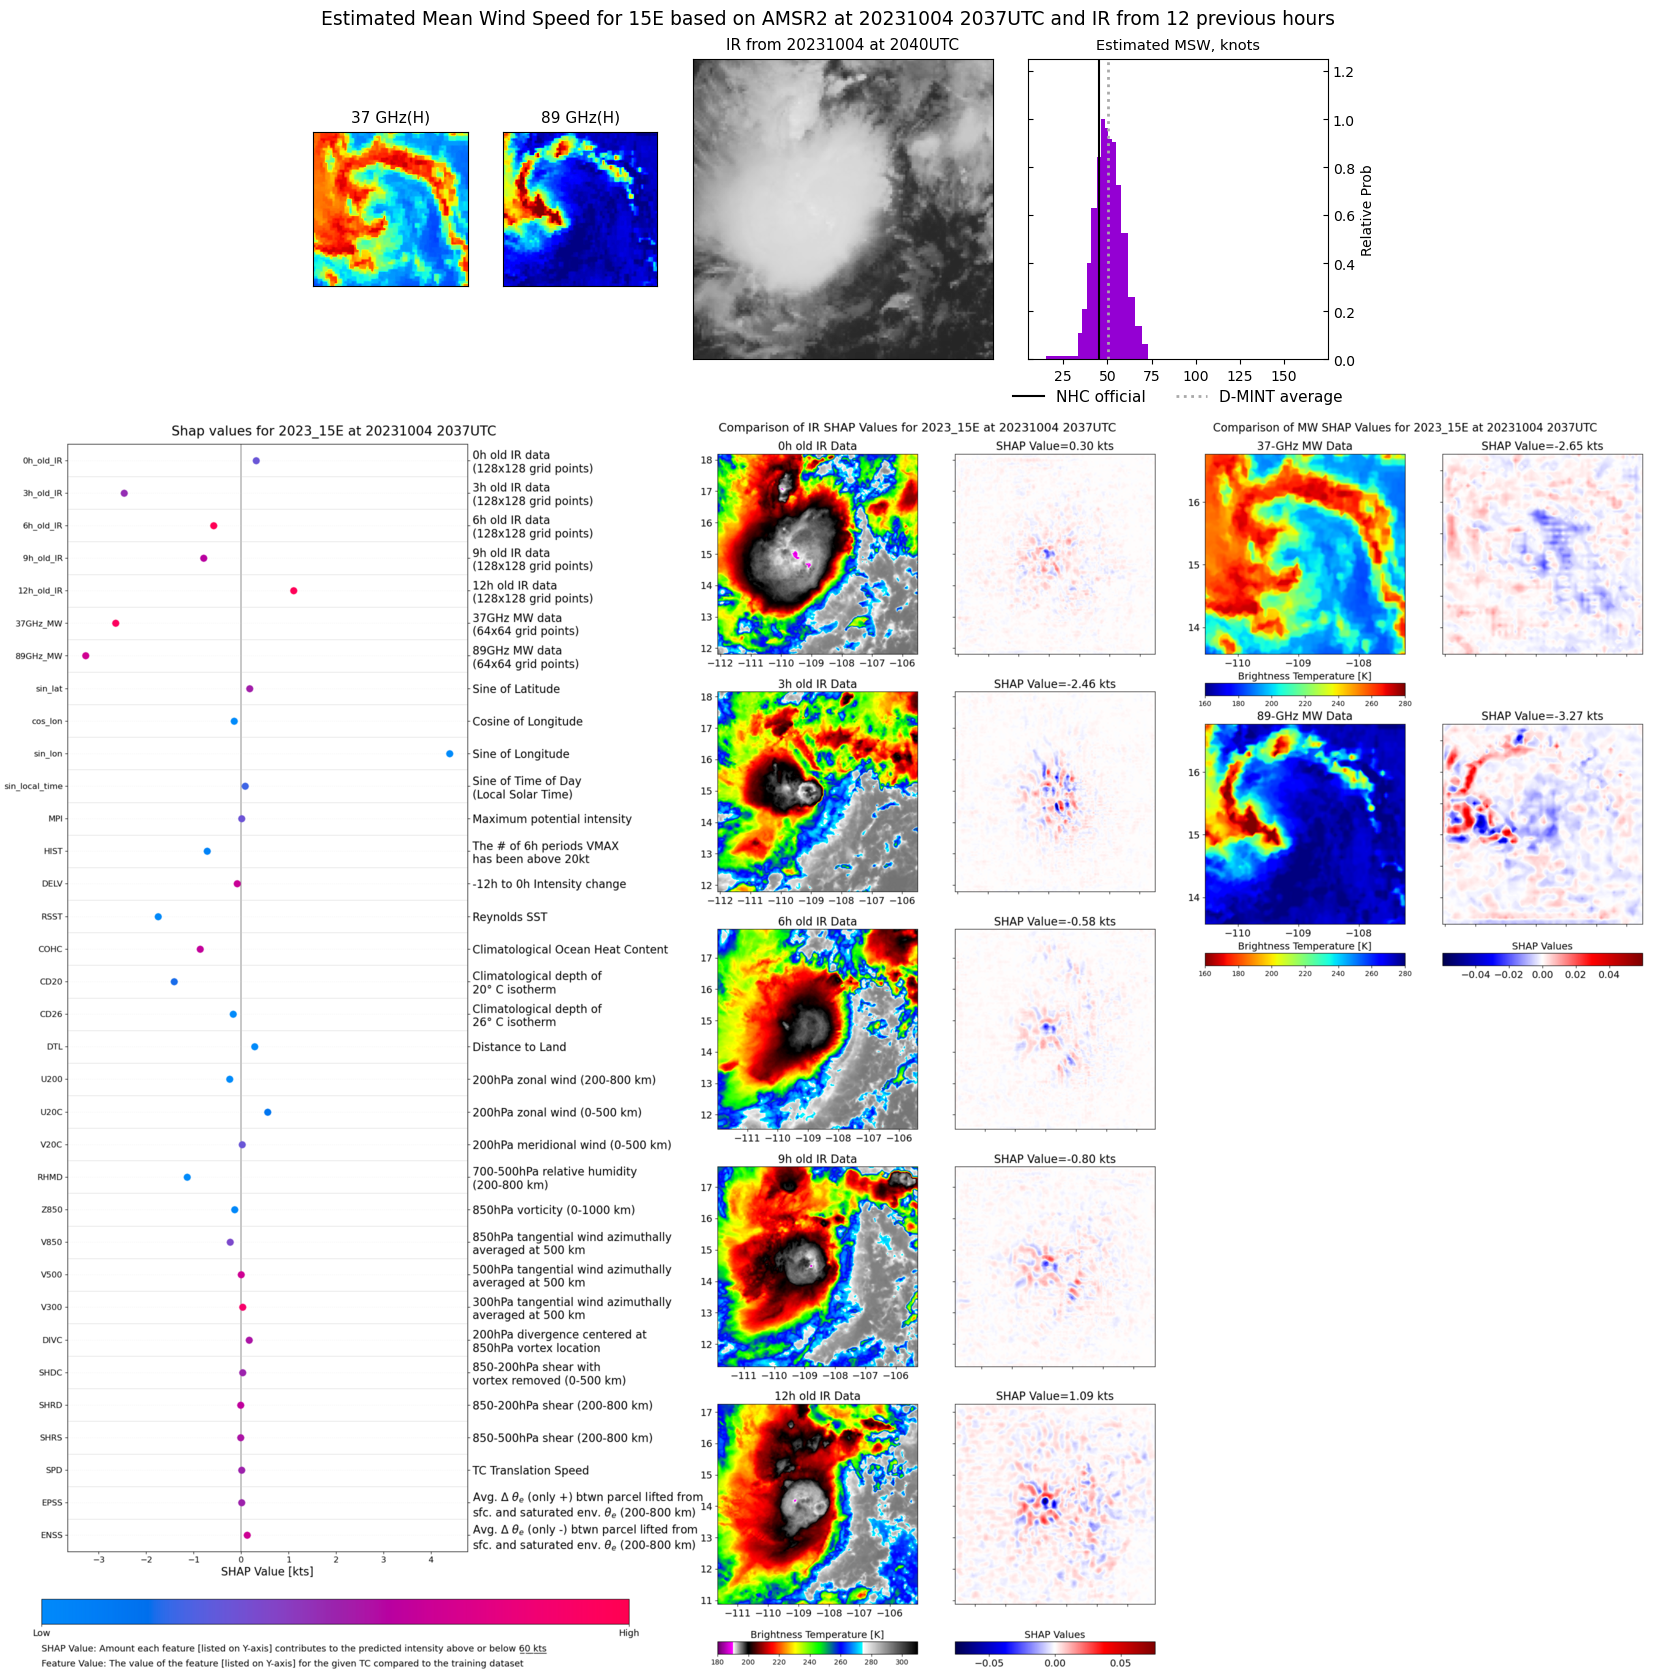 |
| 20231004 | 1901 UTC | GMI | 1003 hPa | 40 kts | 35 kts | 44 kts | 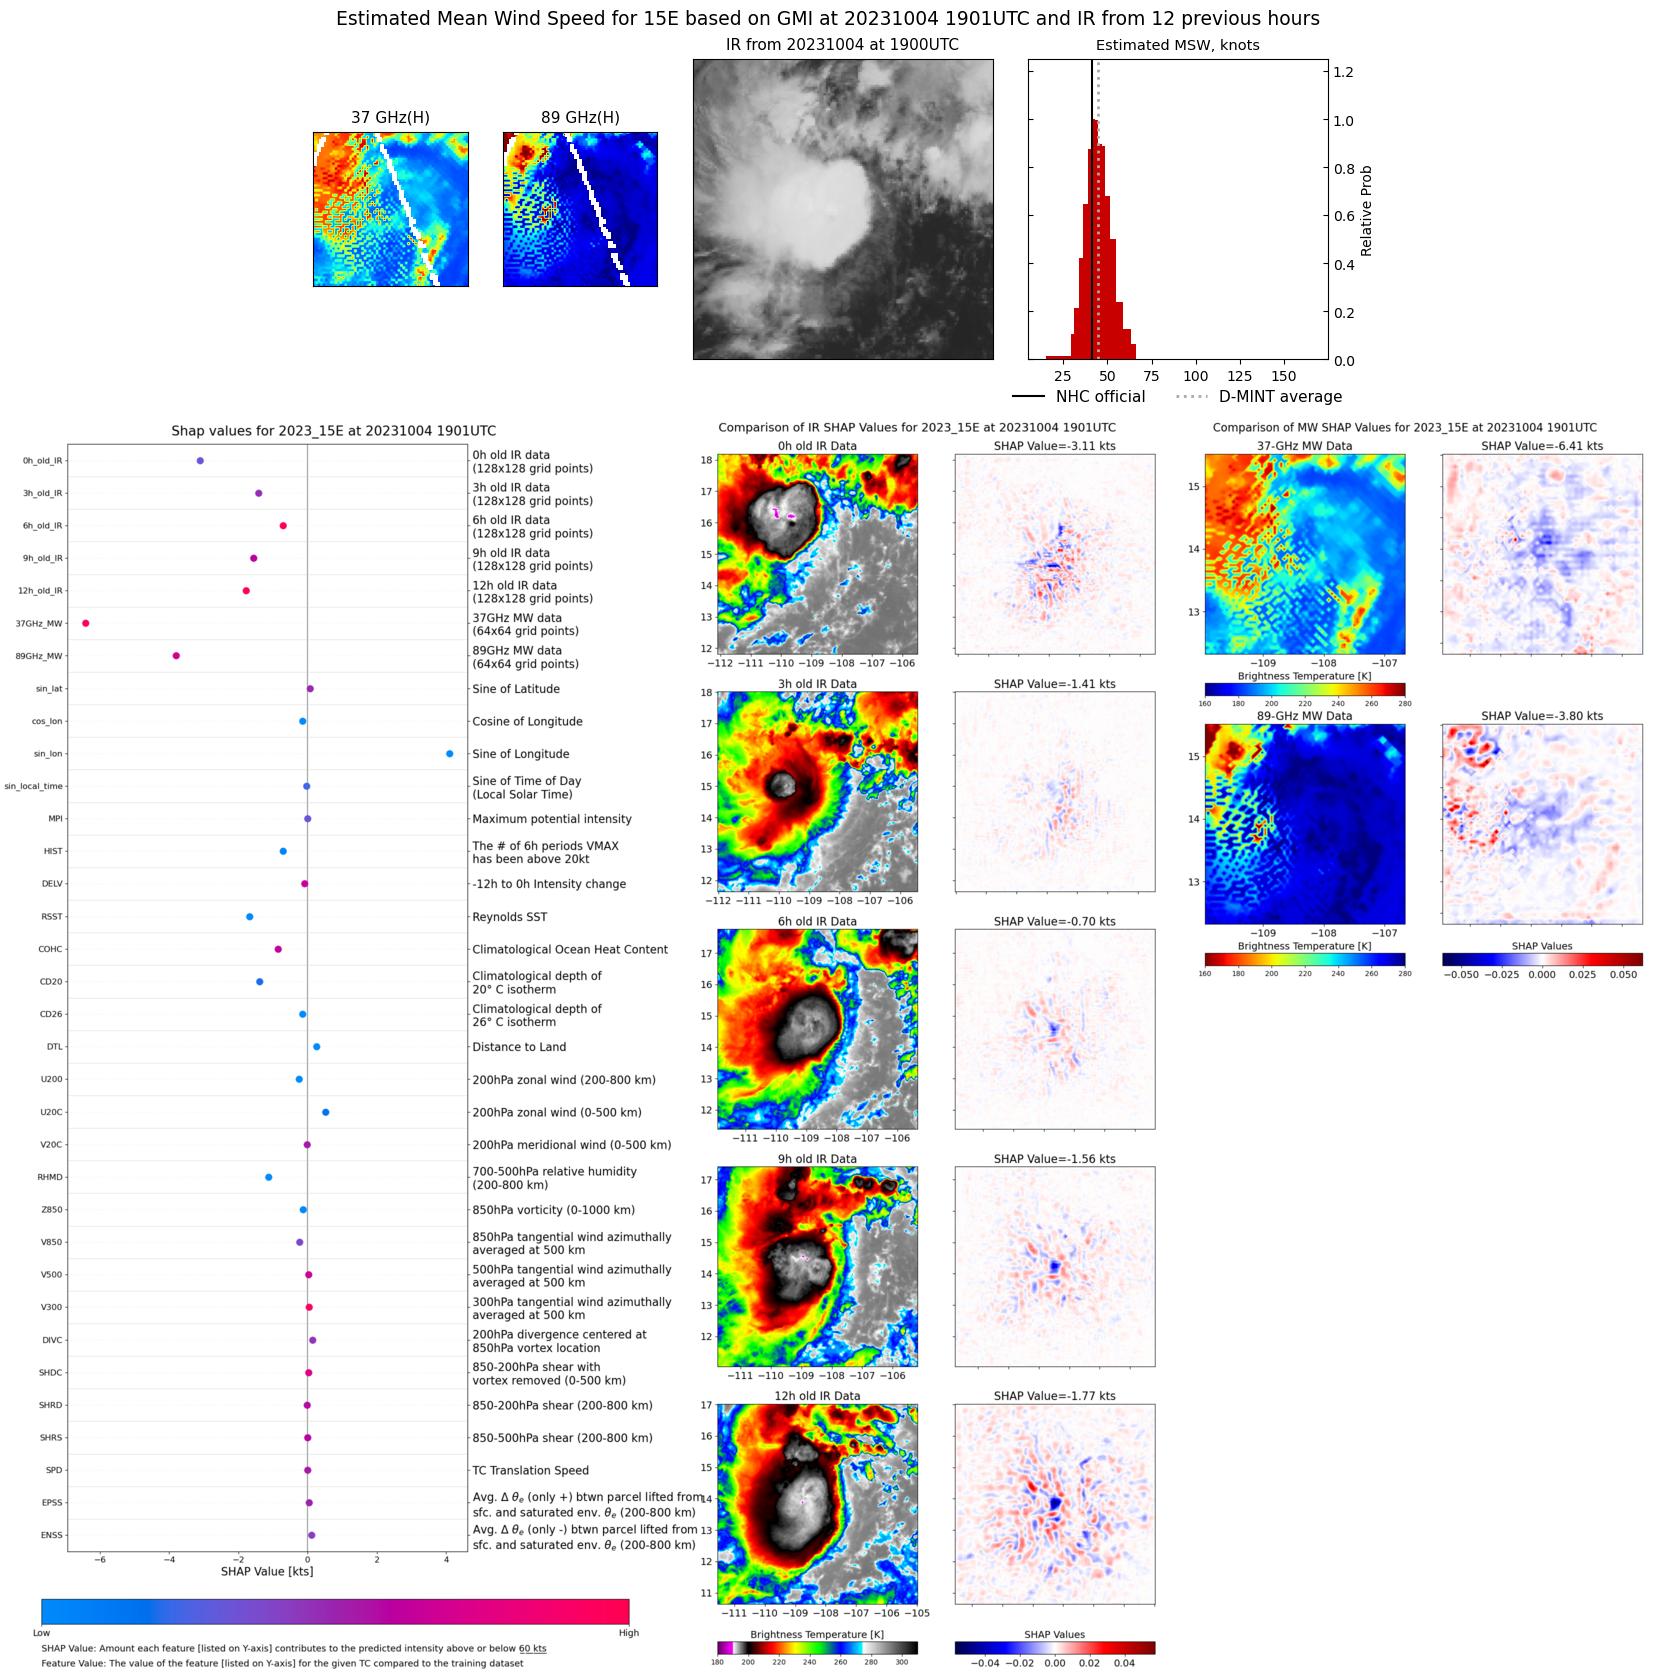 |
| 20231004 | 0731 UTC | GMI | 1003 hPa | 36 kts | 32 kts | 41 kts | 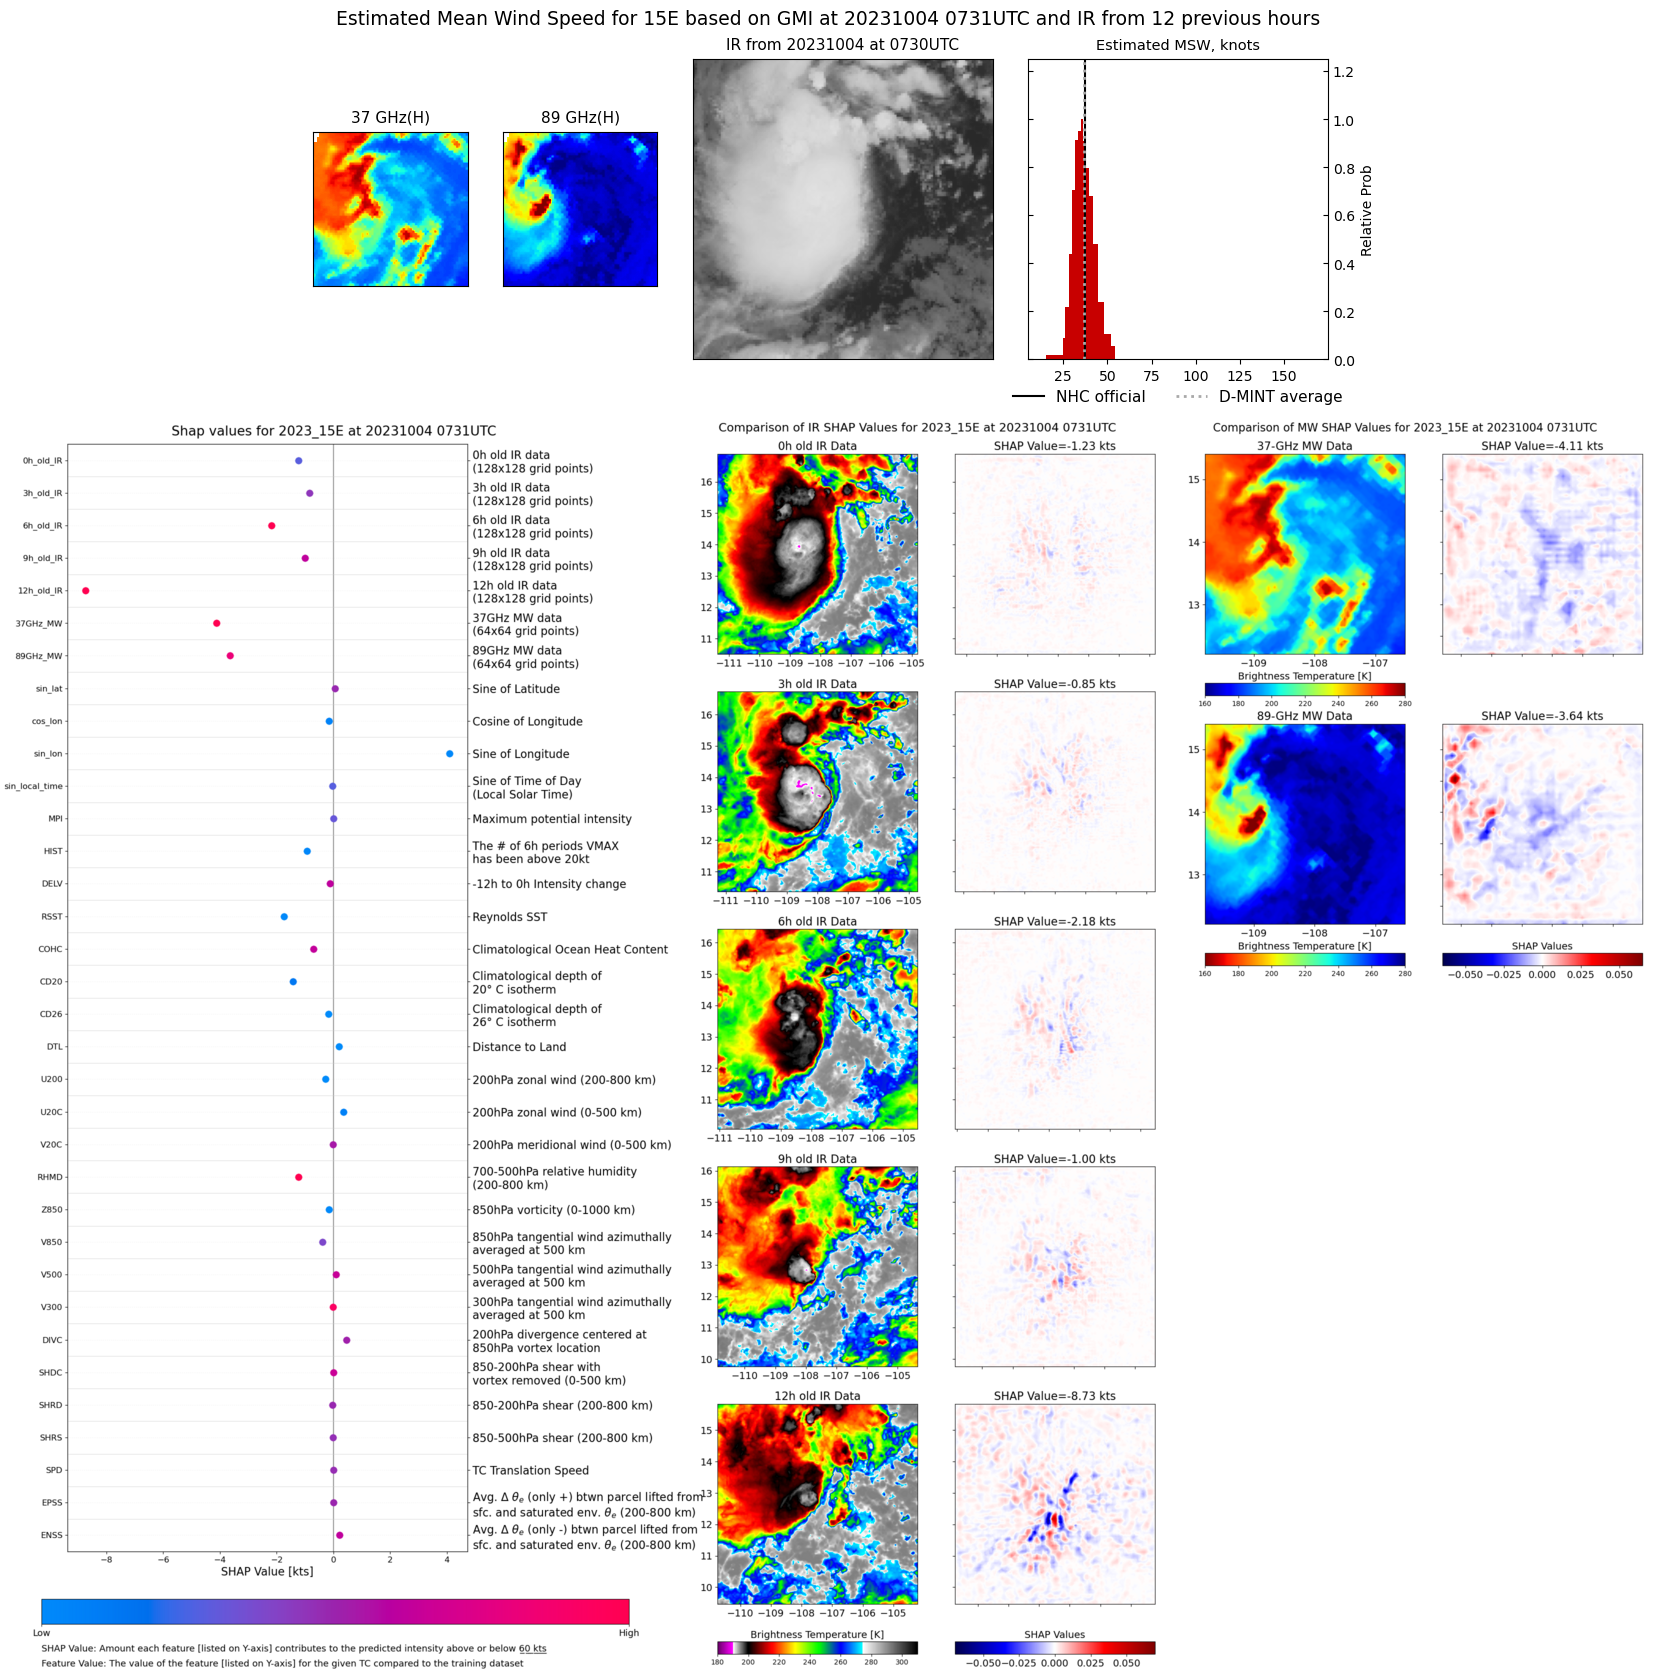 |
| 20231004 | 0102 UTC | SSMISF17 | 1005 hPa | 34 kts | 31 kts | 39 kts | 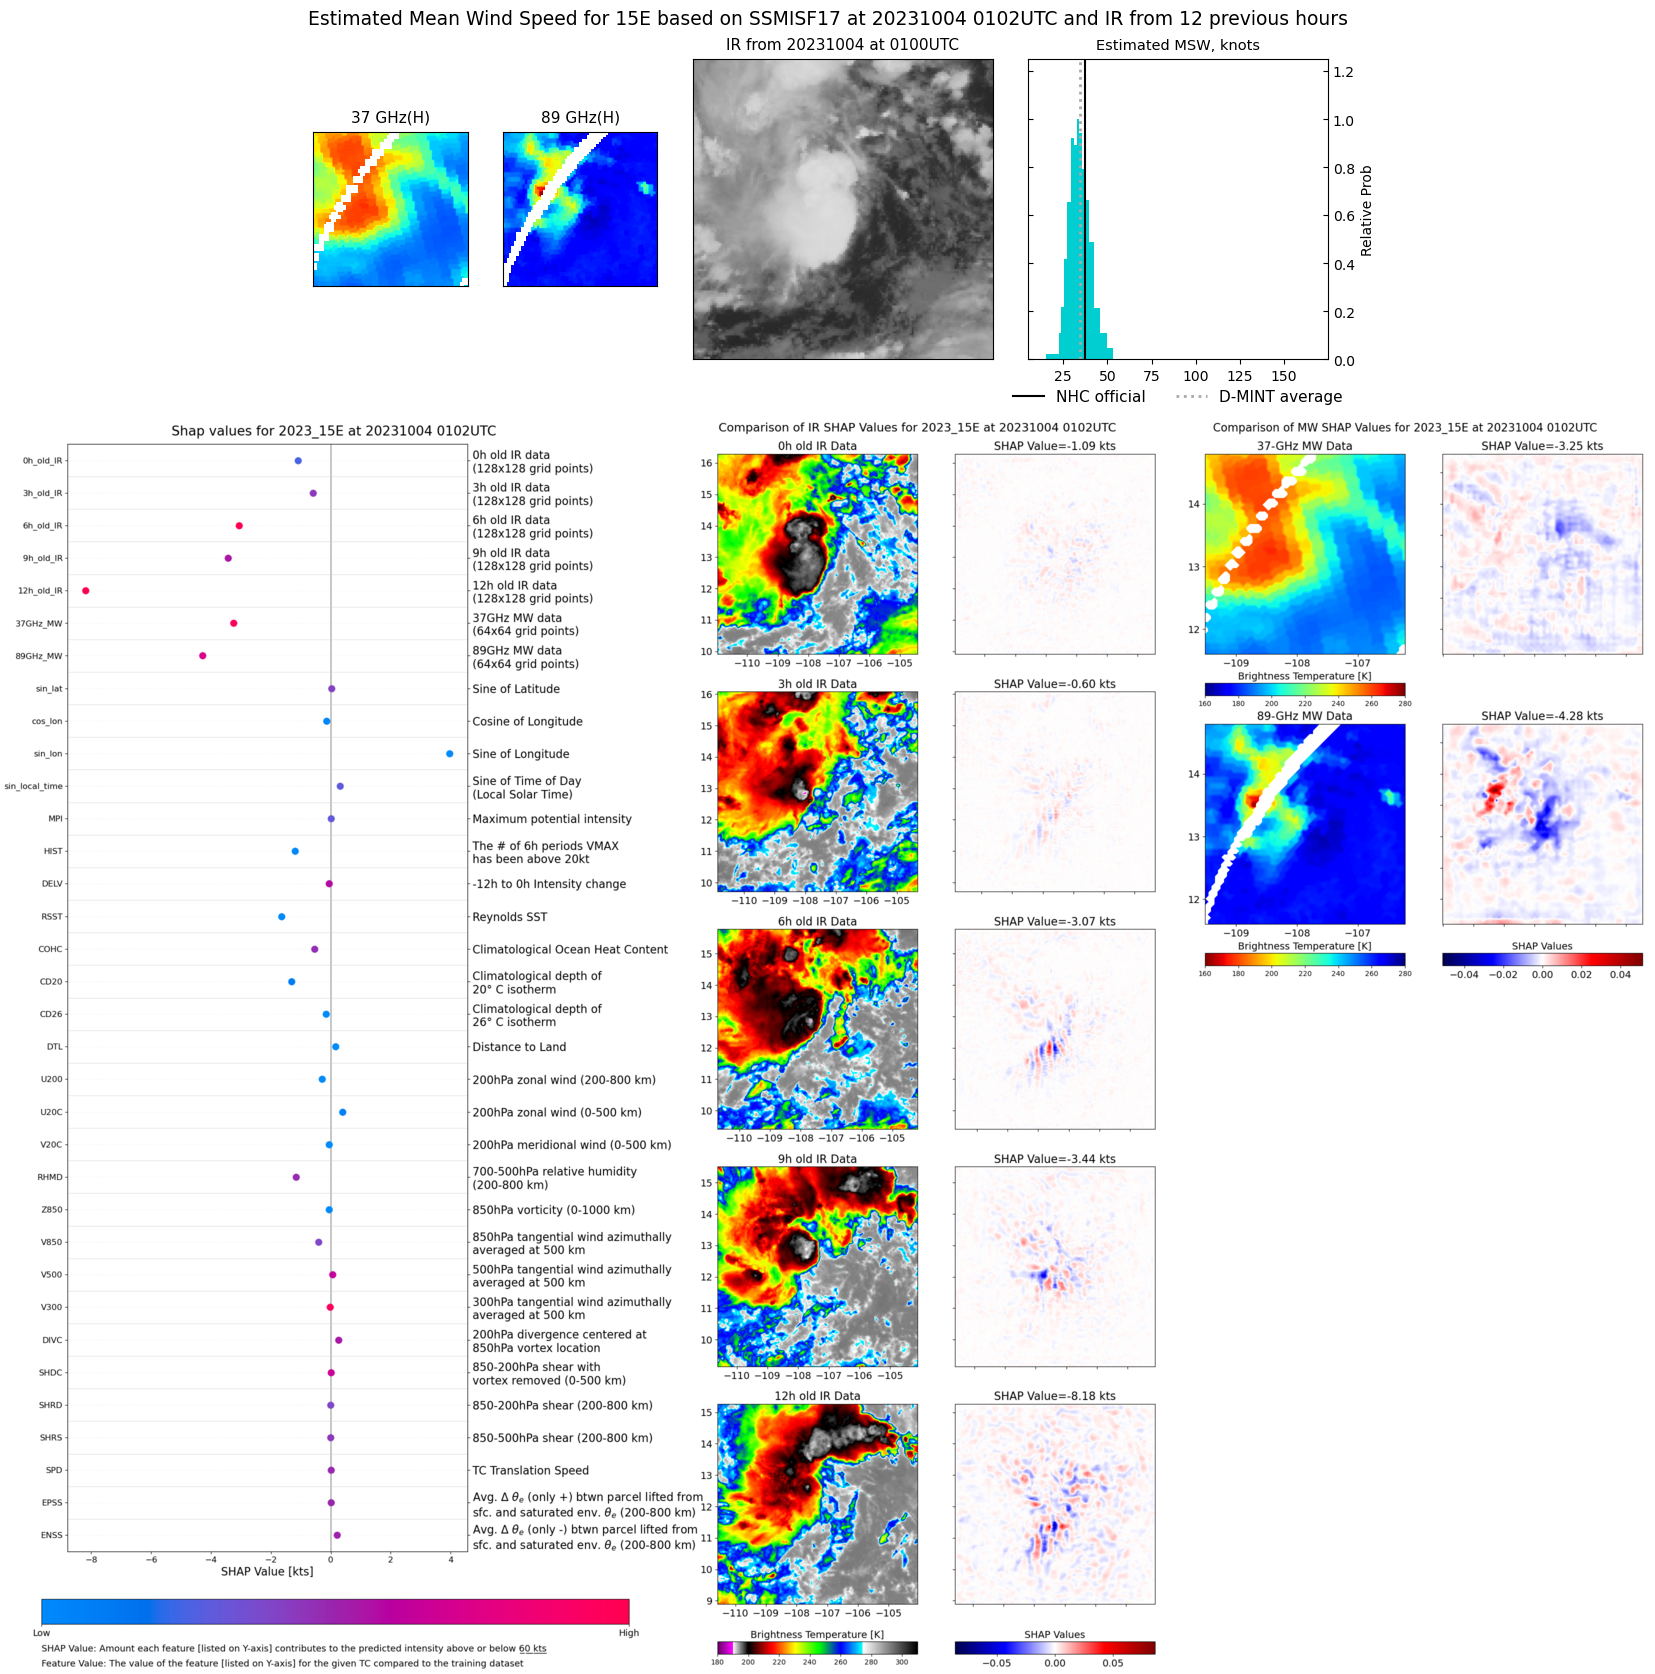 |
| 20231003 | 1351 UTC | SSMISF17 | 1006 hPa | 28 kts | 25 kts | 31 kts | 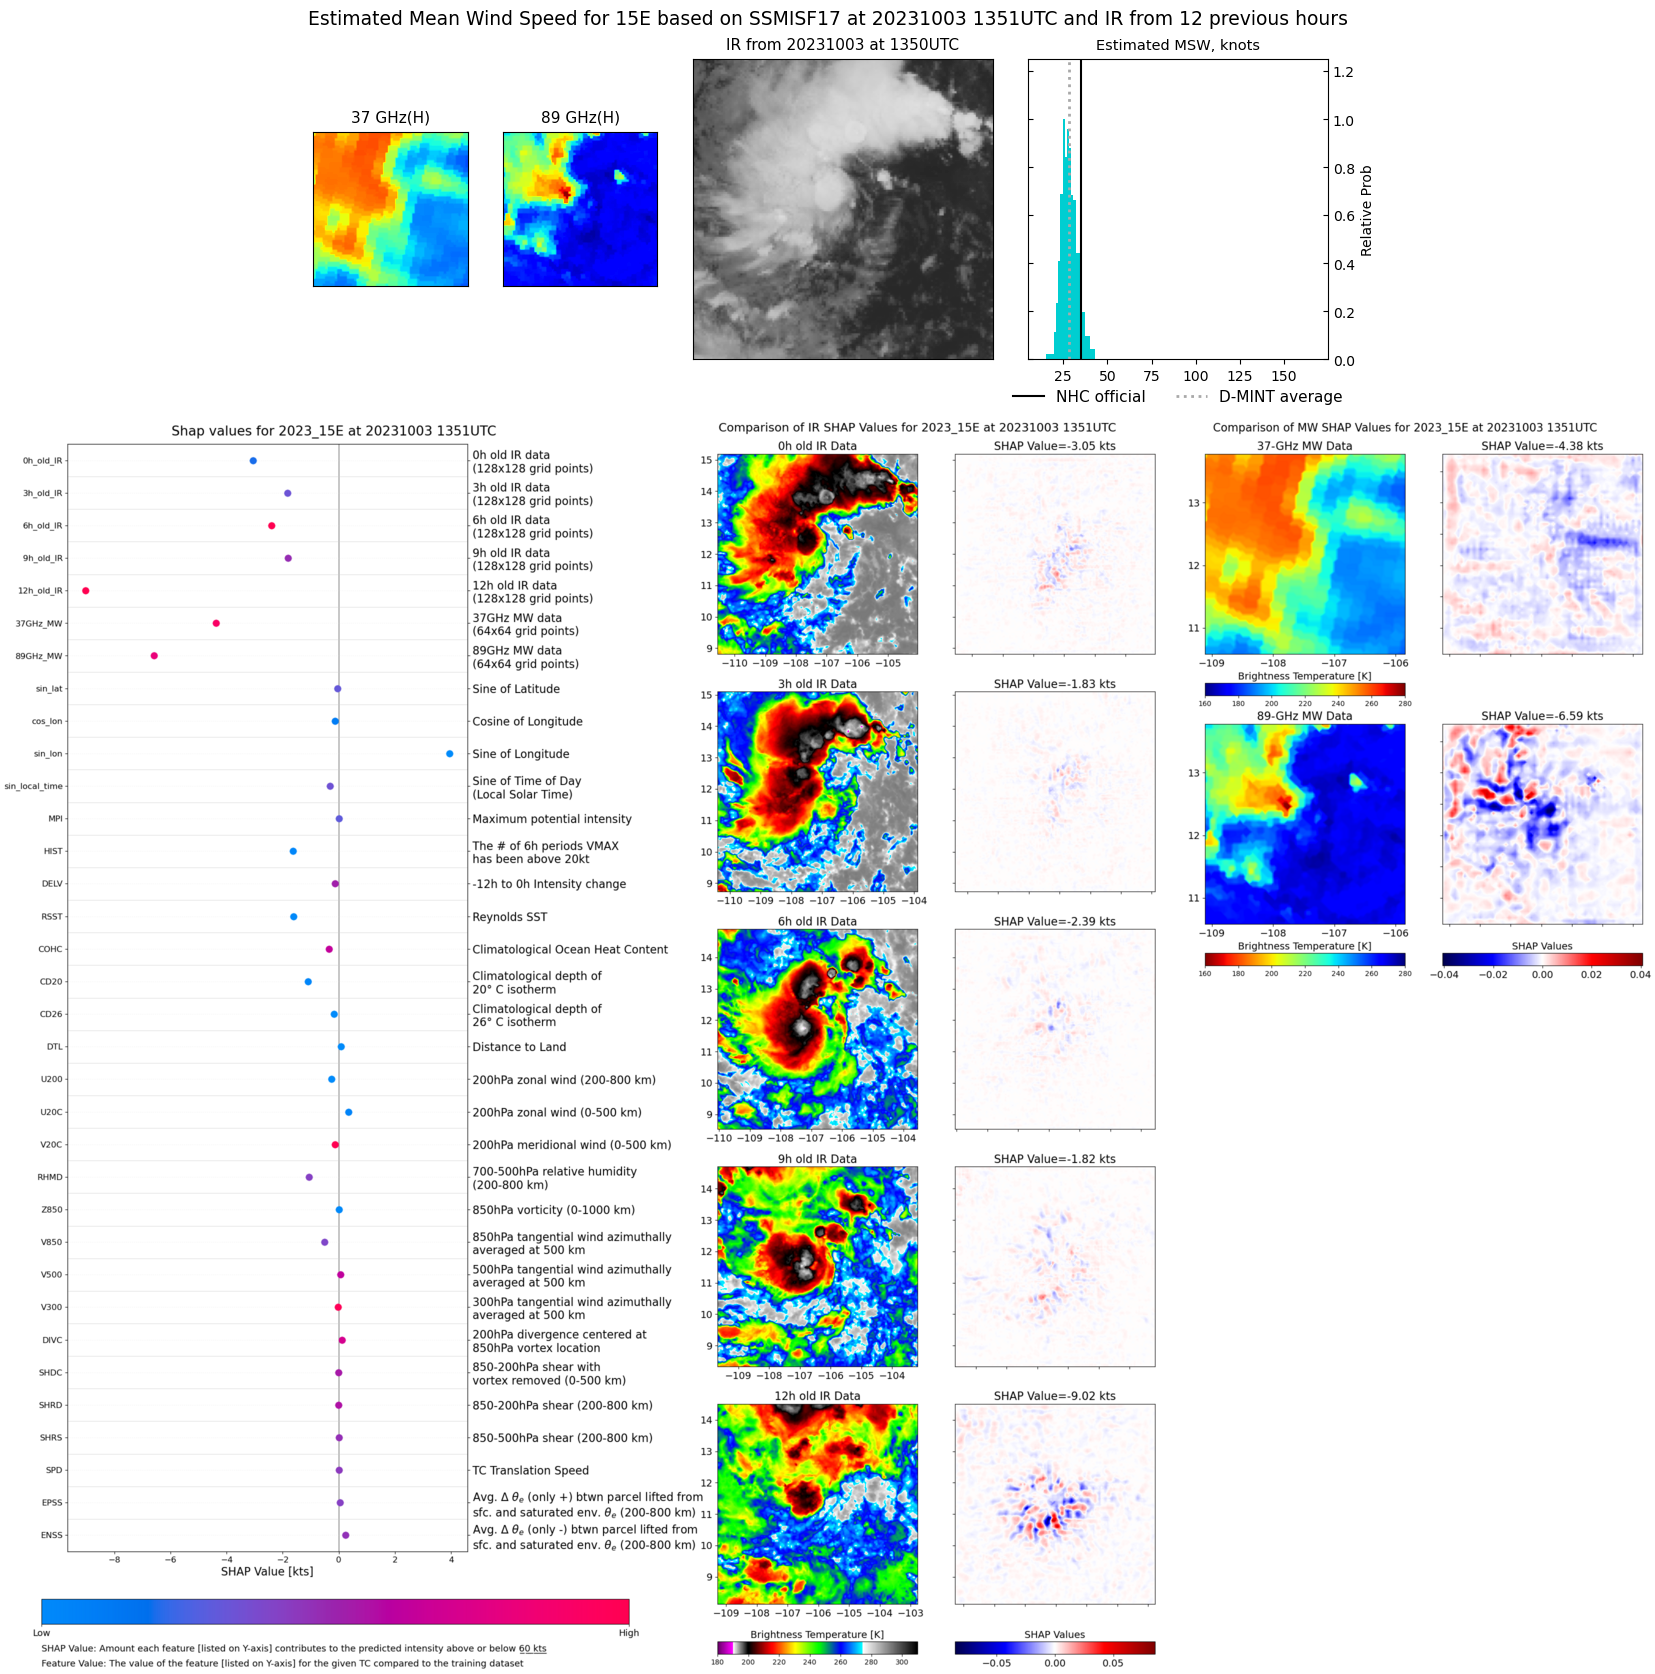 |
| 20231003 | 1229 UTC | SSMISF16 | 1006 hPa | 28 kts | 25 kts | 31 kts | 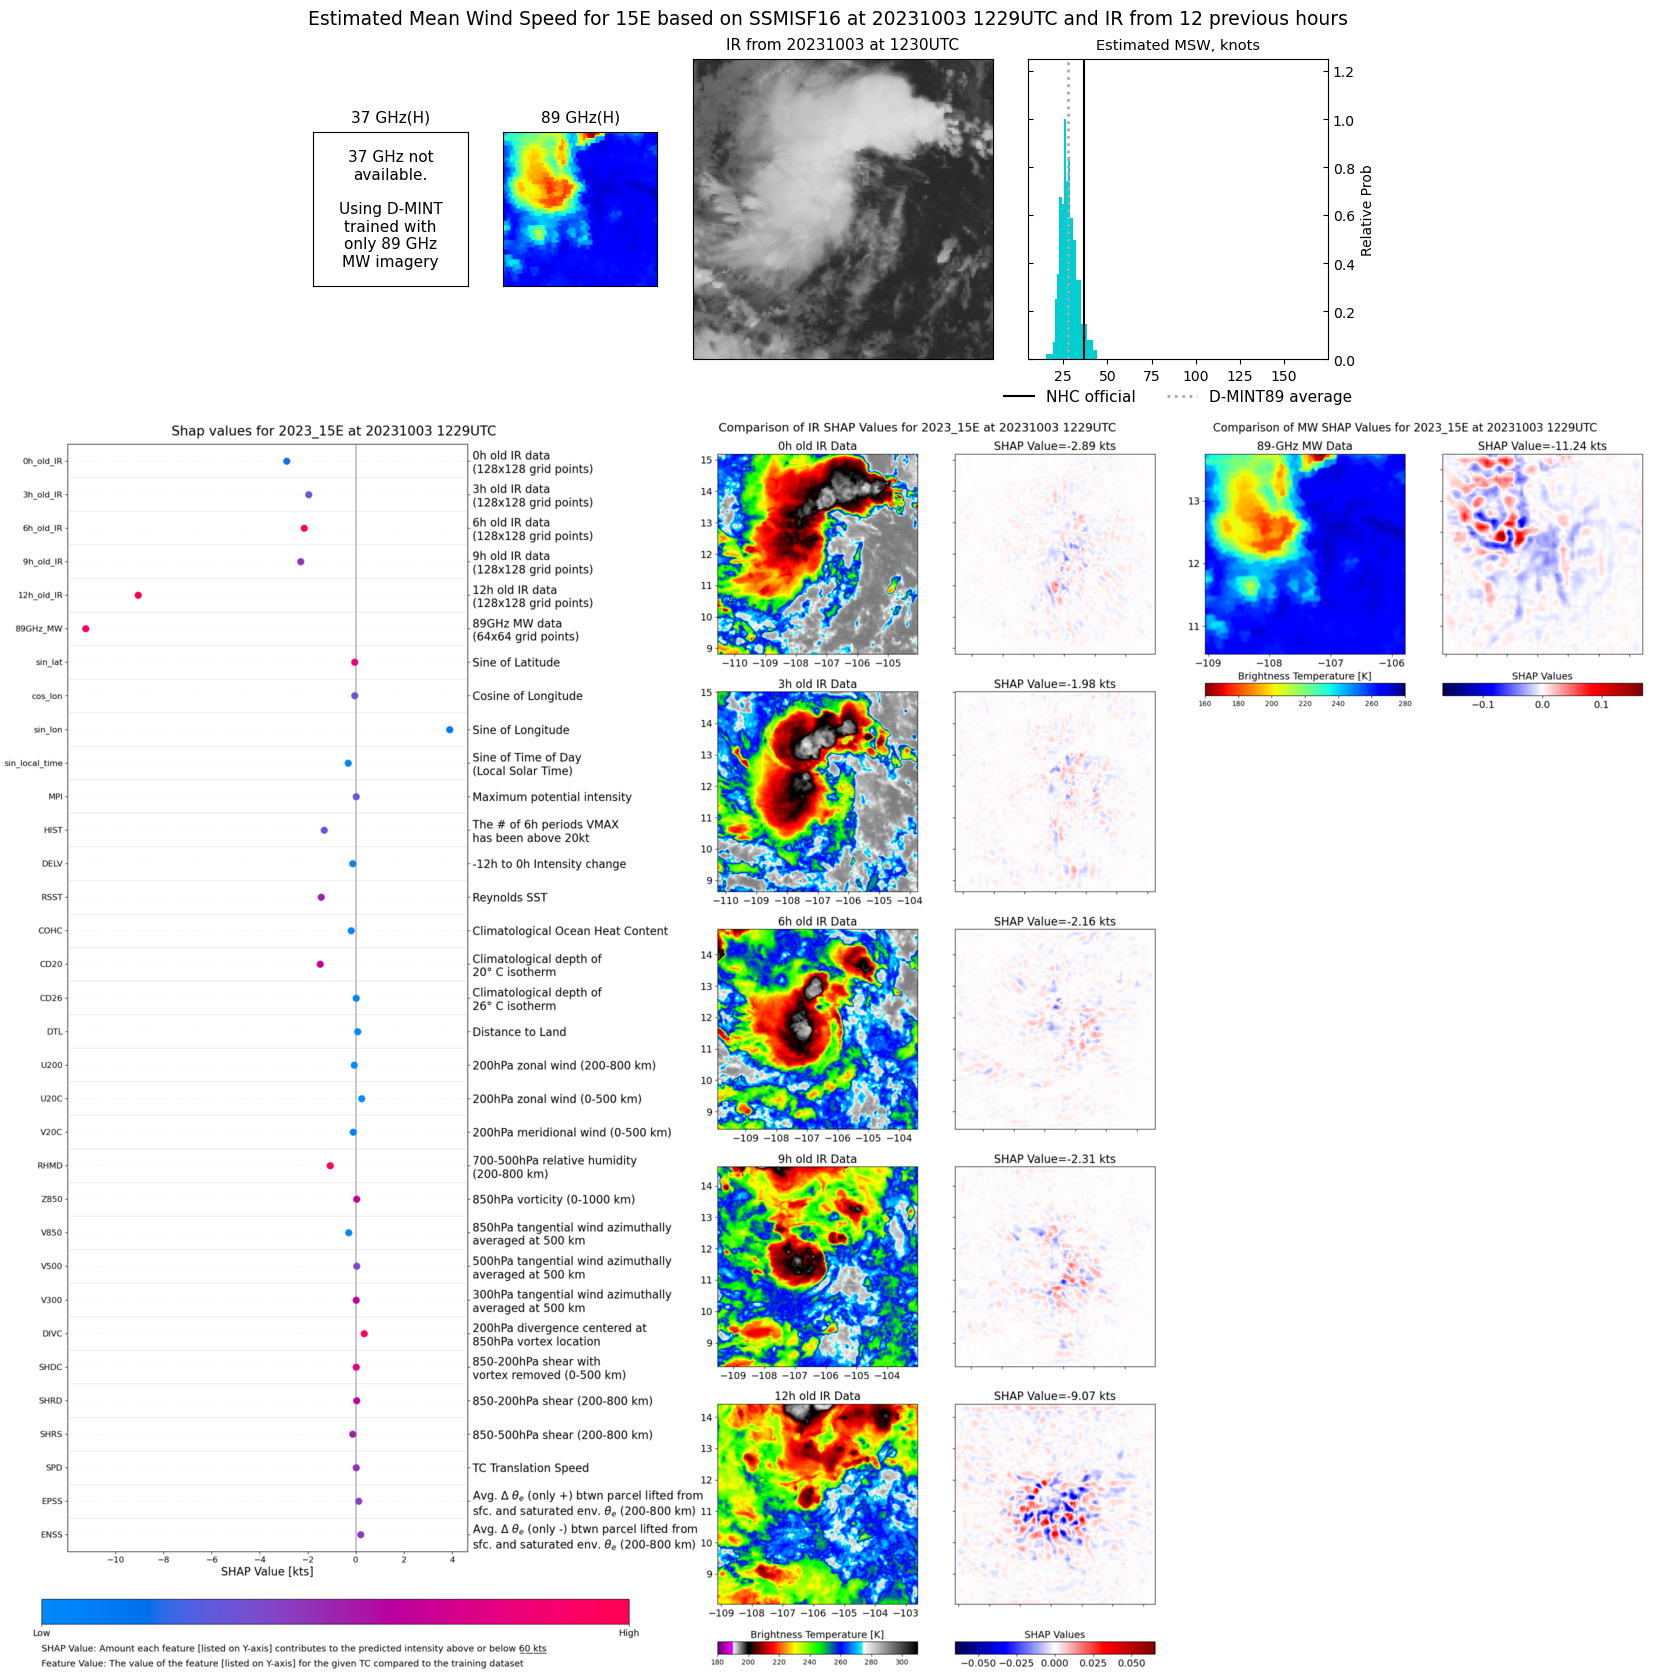 |
| 20231003 | 0903 UTC | AMSR2 | 1006 hPa | 30 kts | 27 kts | 33 kts | 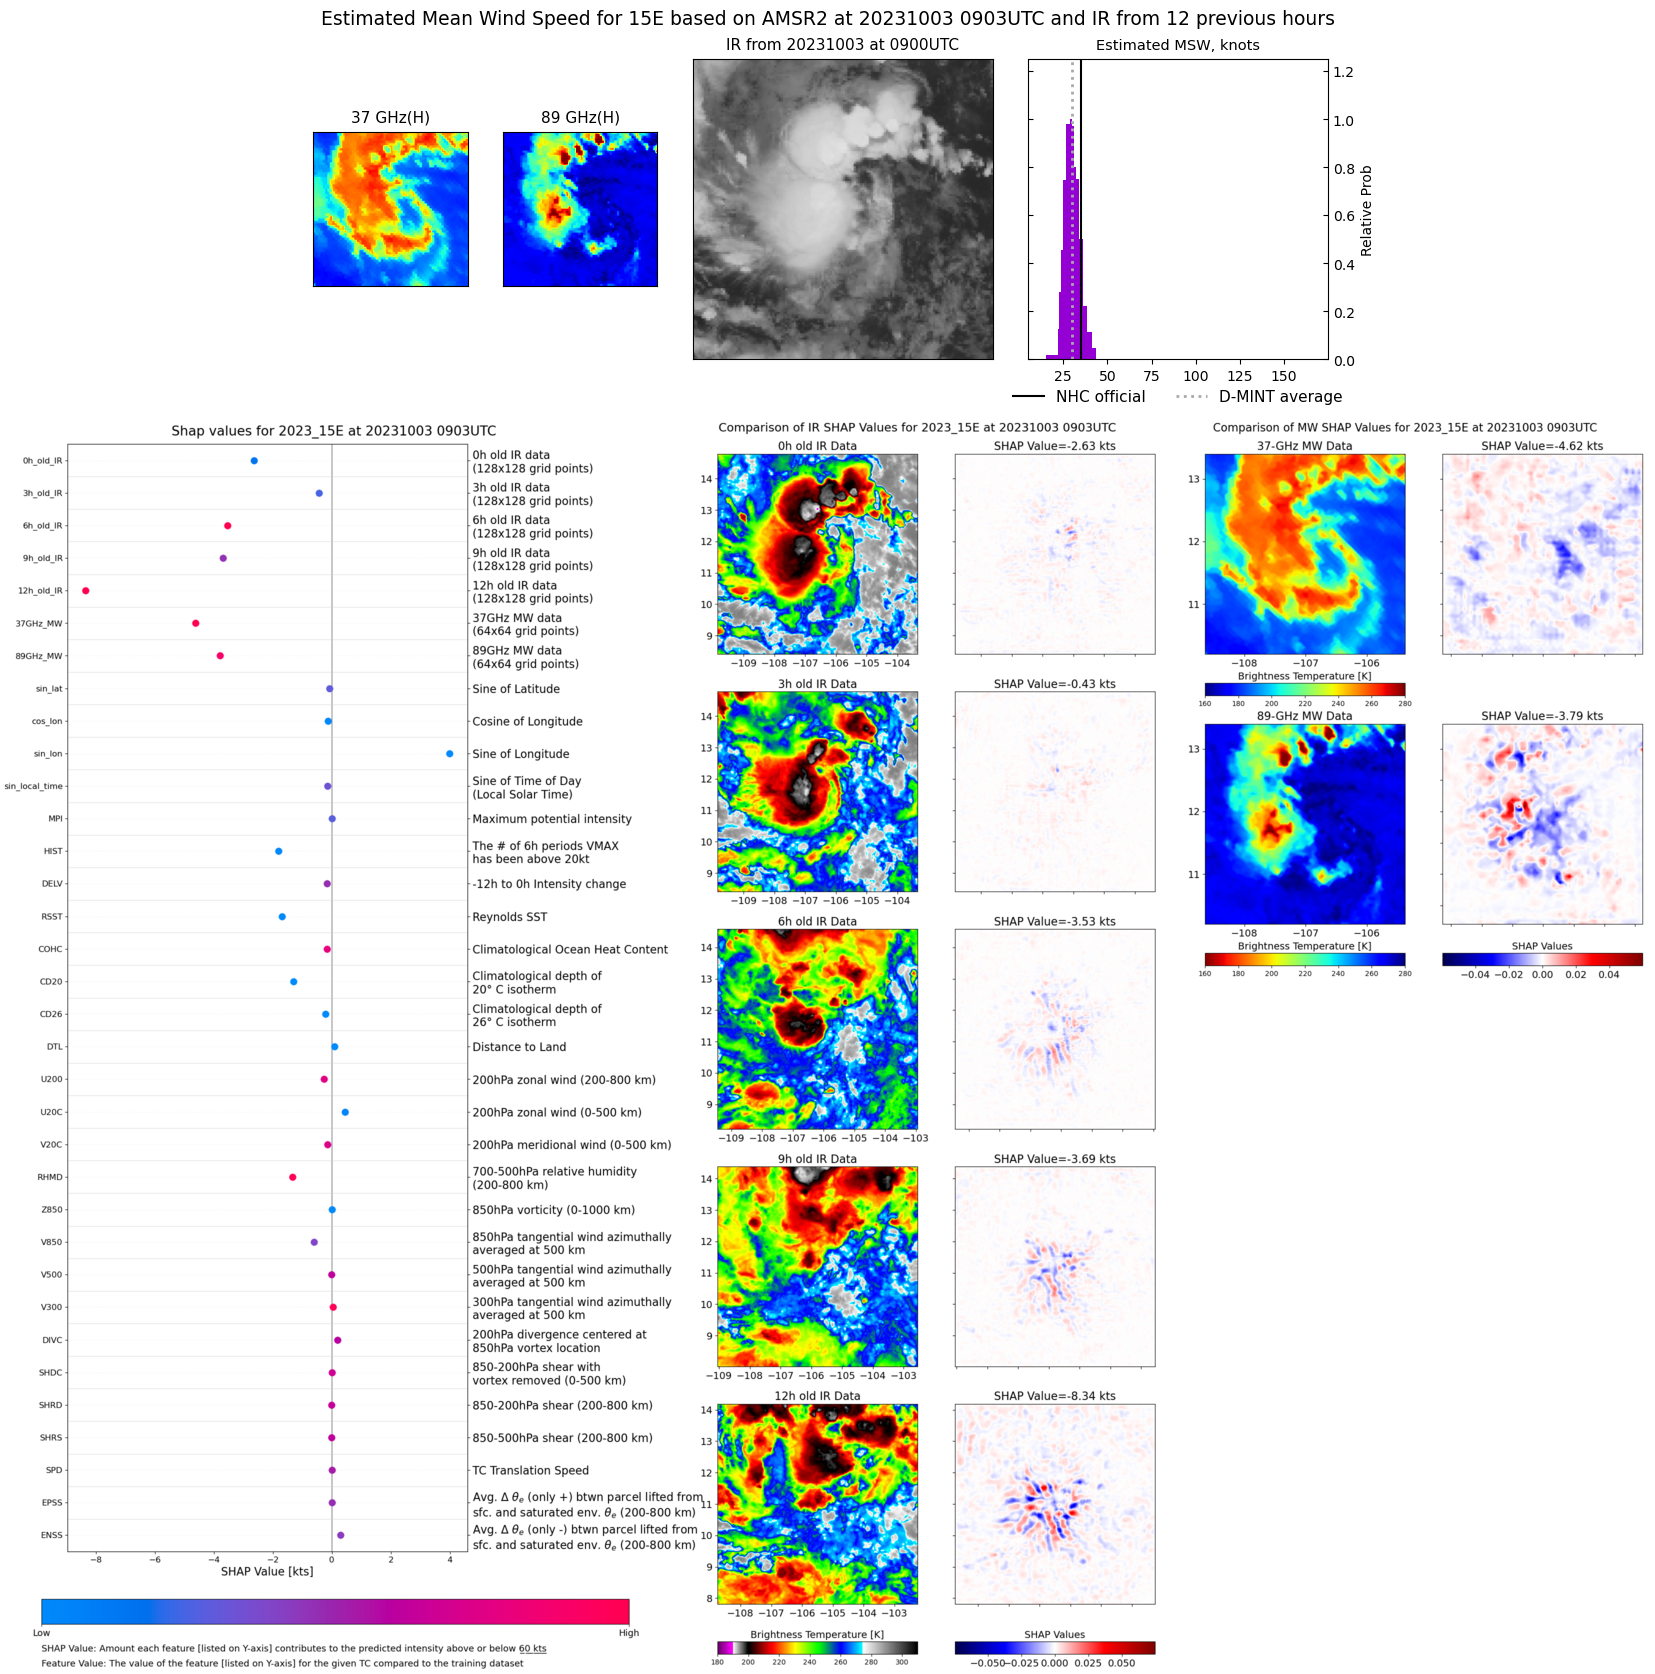 |