|
Storm: 15L
D-MINT HISTORY FILE for 2023_15L
| Date | Time | MW Sensor | MSLP | Vmax
(30th-70th percentile average) | Vmax
25th percentile | Vmax
75th percentile | Image |
| 20230922 | 1521 UTC | GMI | 988 hPa | 45 kts | 40 kts | 51 kts | 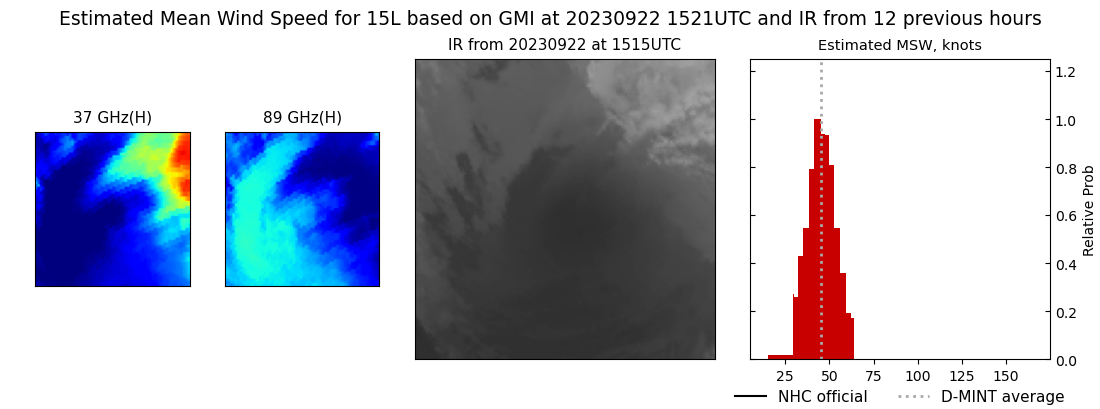 |
| 20230922 | 0721 UTC | GMI | 977 hPa | 62 kts | 55 kts | 68 kts | 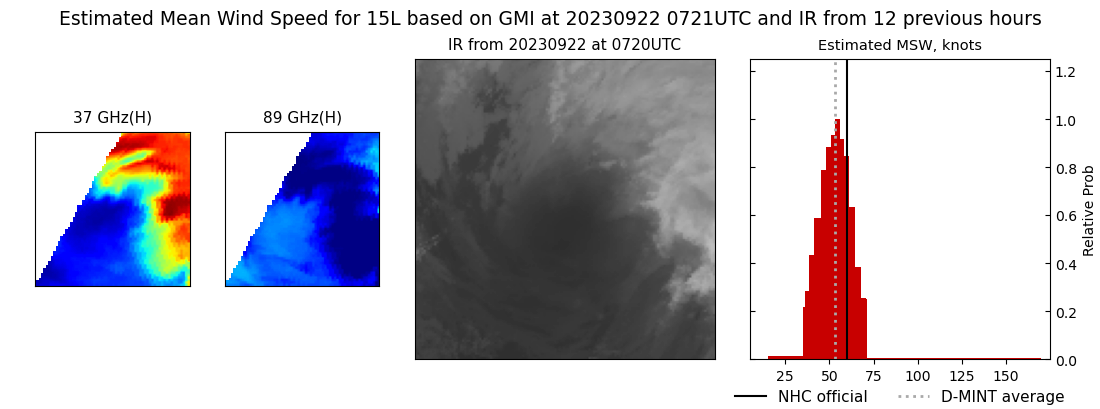 |
| 20230922 | 0416 UTC | AMSR2 | 971 hPa | 62 kts | 55 kts | 69 kts | 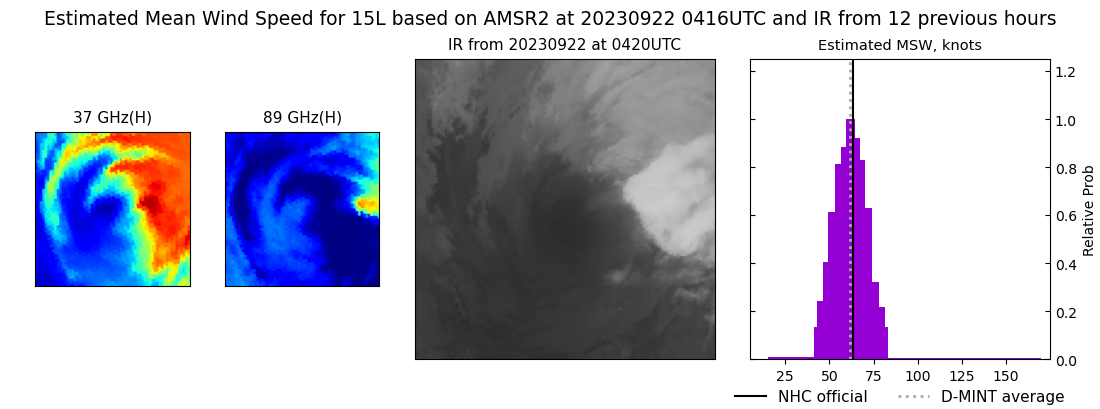 |
| 20230921 | 2108 UTC | SSMISF17 | 978 hPa | 63 kts | 56 kts | 69 kts |  |
| 20230921 | 1747 UTC | SSMISF18 | 980 hPa | 72 kts | 65 kts | 78 kts | 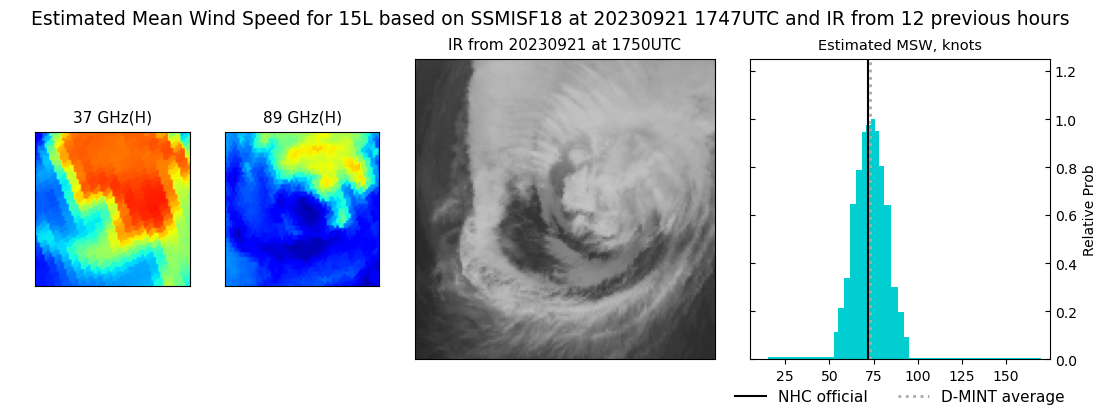 |
| 20230921 | 1619 UTC | AMSR2 | 978 hPa | 73 kts | 67 kts | 79 kts | 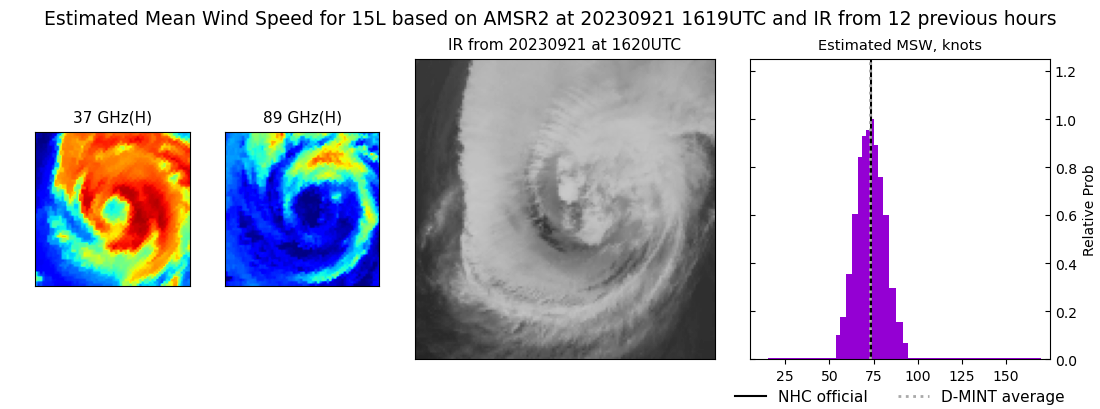 |
| 20230921 | 0941 UTC | SSMISF17 | 981 hPa | 80 kts | 74 kts | 86 kts | 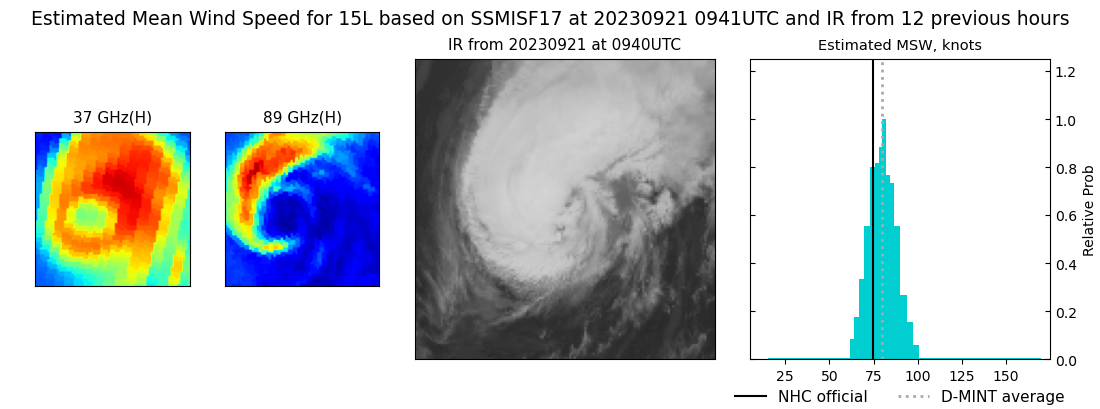 |
| 20230921 | 0802 UTC | SSMISF18 | 979 hPa | 82 kts | 76 kts | 87 kts | 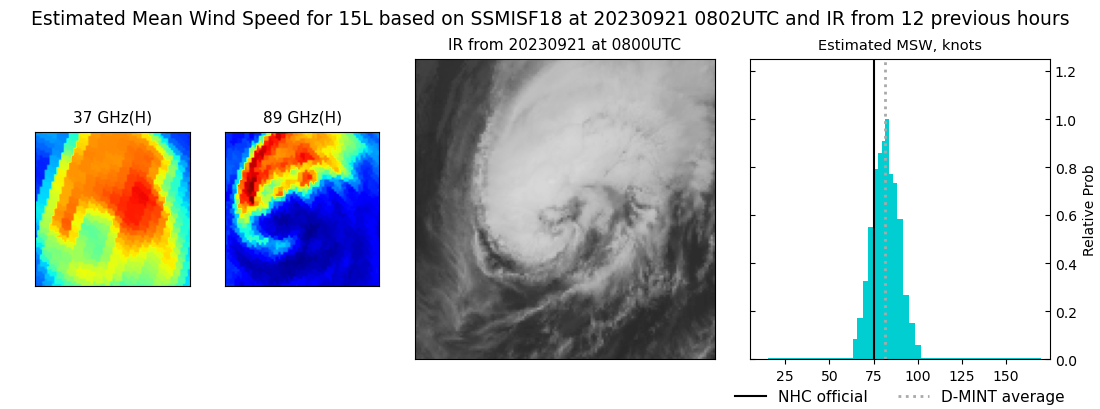 |
| 20230921 | 0513 UTC | AMSR2 | 974 hPa | 82 kts | 77 kts | 88 kts | 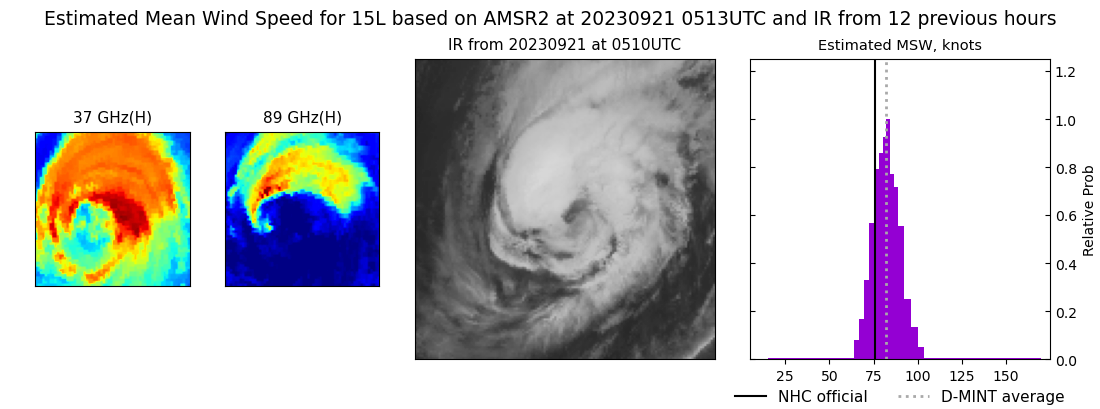 |
| 20230920 | 2119 UTC | SSMISF17 | 979 hPa | 74 kts | 69 kts | 80 kts | 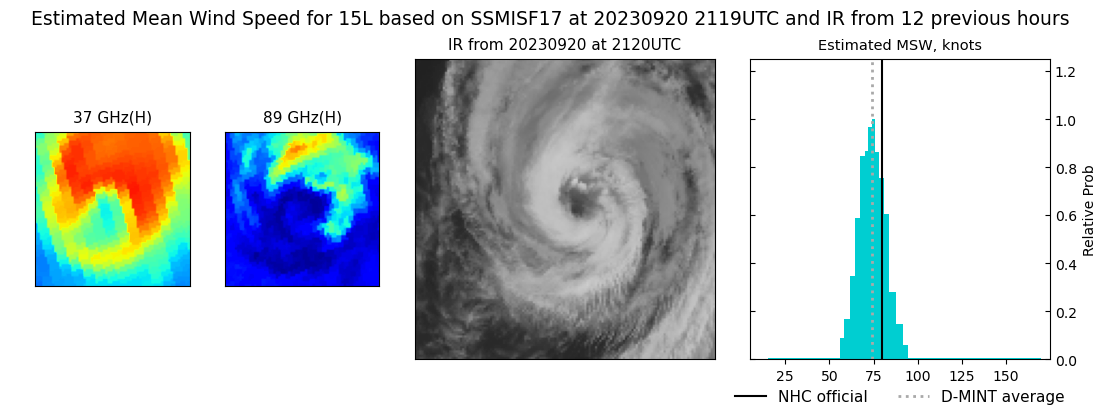 |
| 20230920 | 1713 UTC | AMSR2 | 978 hPa | 71 kts | 66 kts | 77 kts | 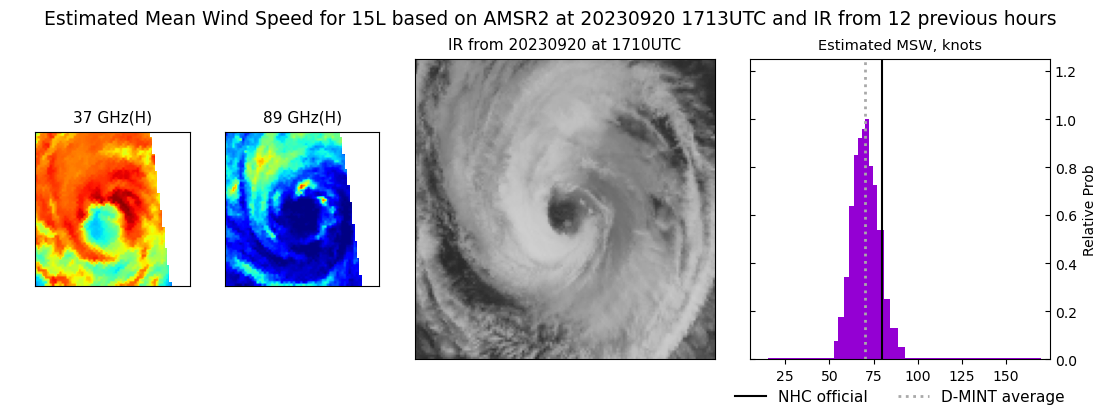 |
| 20230920 | 0957 UTC | SSMISF17 | 972 hPa | 86 kts | 80 kts | 91 kts | 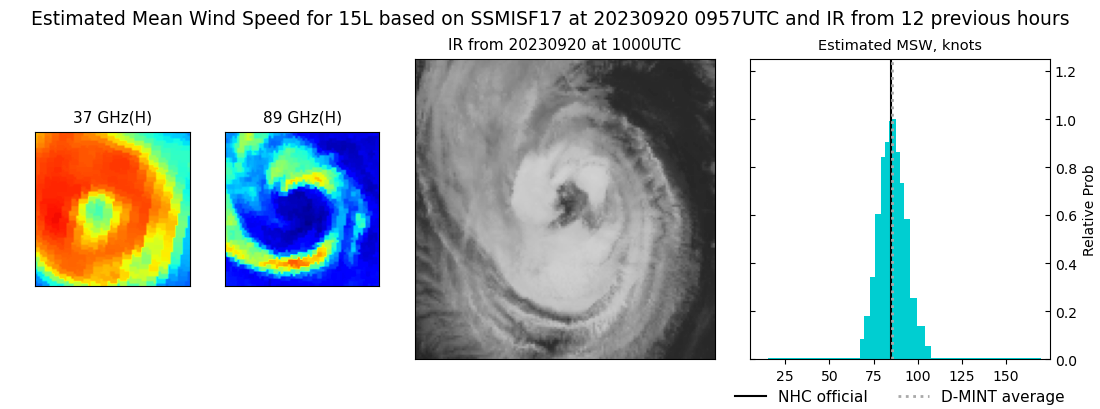 |
| 20230920 | 0901 UTC | GMI | 968 hPa | 83 kts | 79 kts | 88 kts | 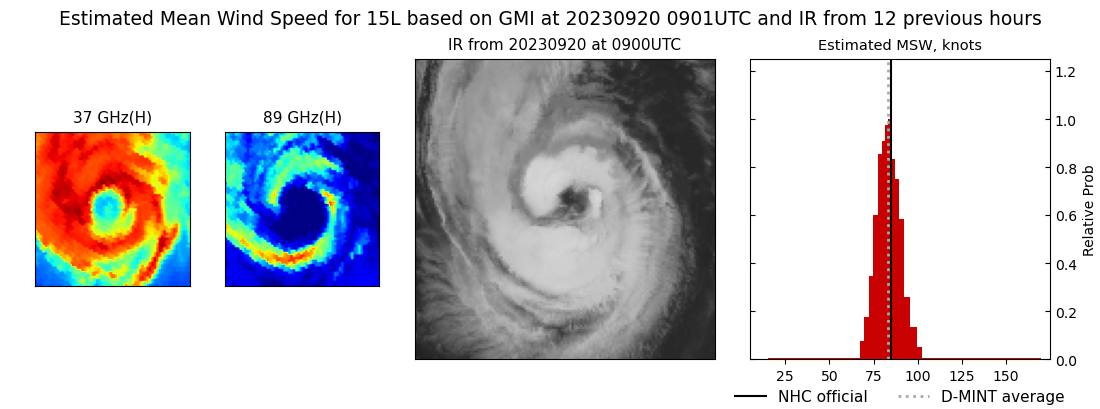 |
| 20230920 | 0816 UTC | SSMISF18 | 969 hPa | 88 kts | 83 kts | 93 kts | 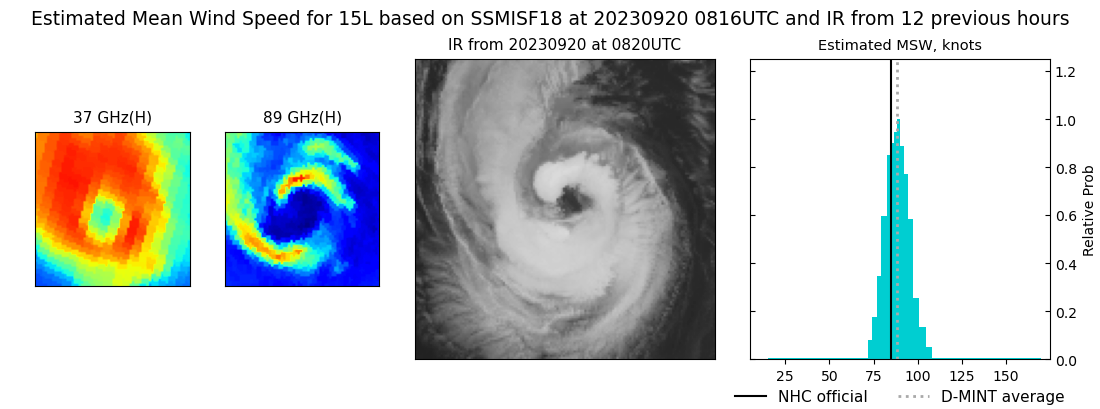 |
| 20230919 | 2132 UTC | SSMISF17 | 969 hPa | 89 kts | 84 kts | 94 kts | 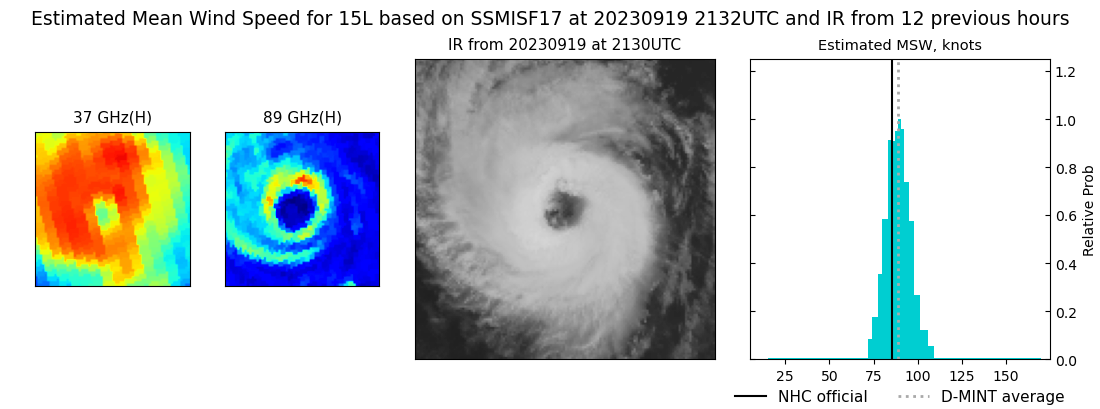 |
| 20230919 | 1629 UTC | AMSR2 | 977 hPa | 83 kts | 79 kts | 88 kts | 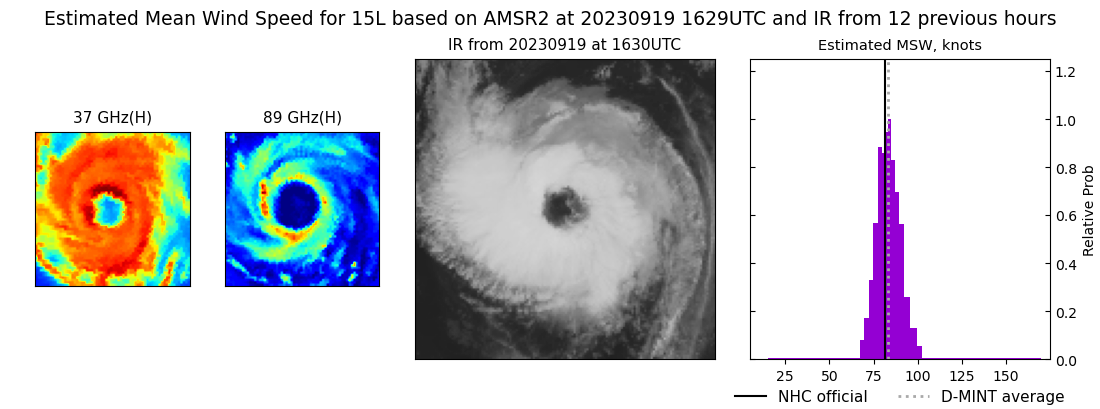 |
| 20230919 | 1011 UTC | SSMISF17 | 983 hPa | 69 kts | 64 kts | 74 kts | 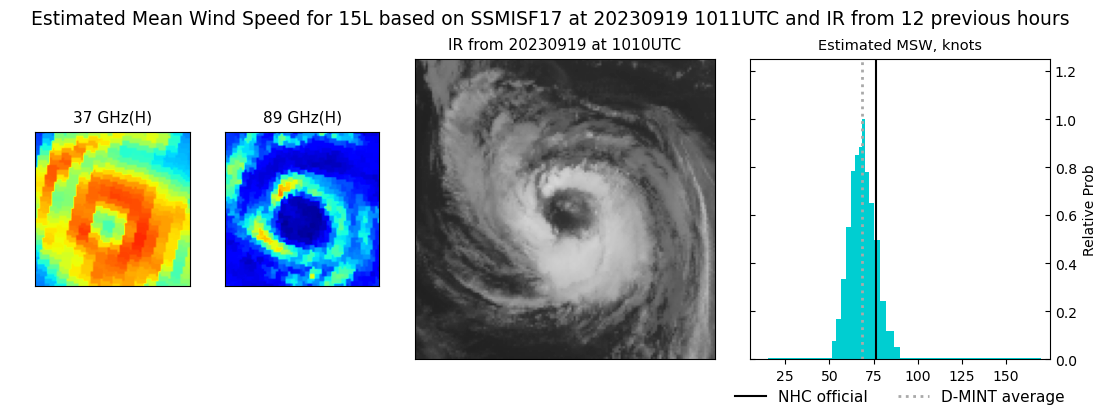 |
| 20230919 | 0529 UTC | AMSR2 | 983 hPa | 75 kts | 70 kts | 80 kts |  |
| 20230918 | 2144 UTC | SSMISF17 | 983 hPa | 72 kts | 66 kts | 78 kts | 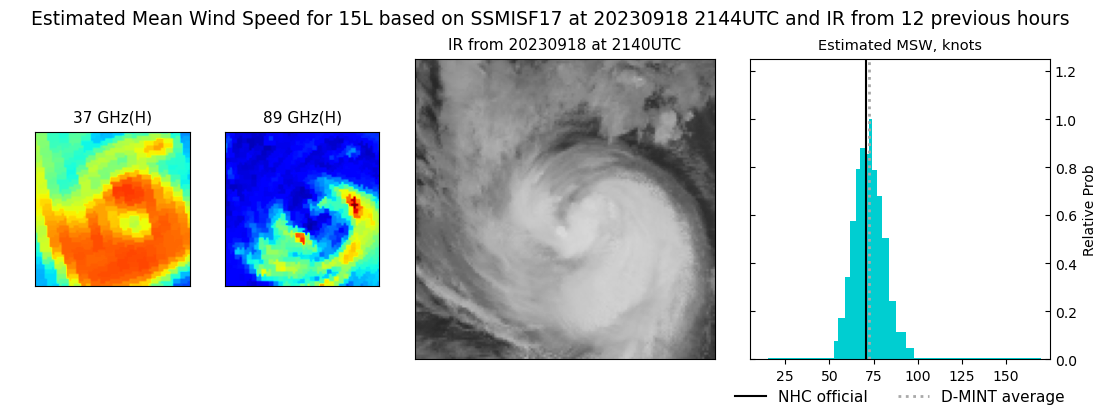 |
| 20230918 | 1901 UTC | GMI | 978 hPa | 69 kts | 63 kts | 75 kts | 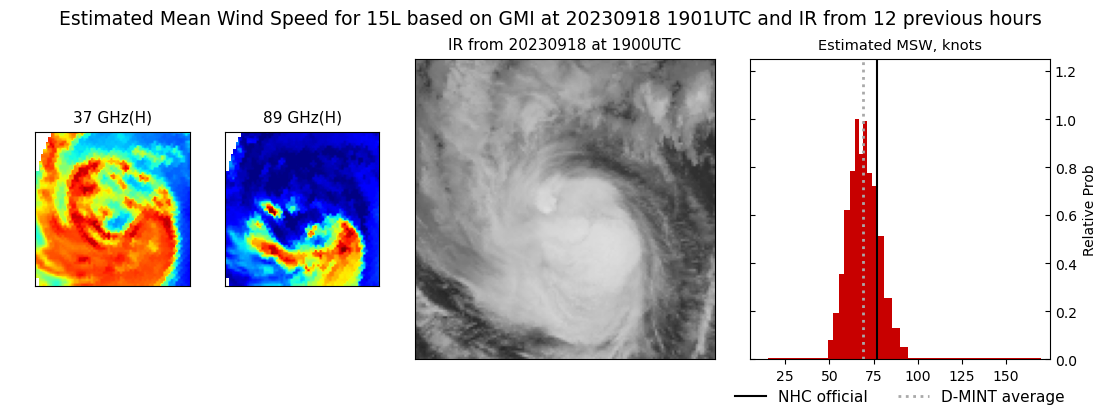 |
| 20230918 | 1856 UTC | GMI | 979 hPa | 67 kts | 61 kts | 73 kts | 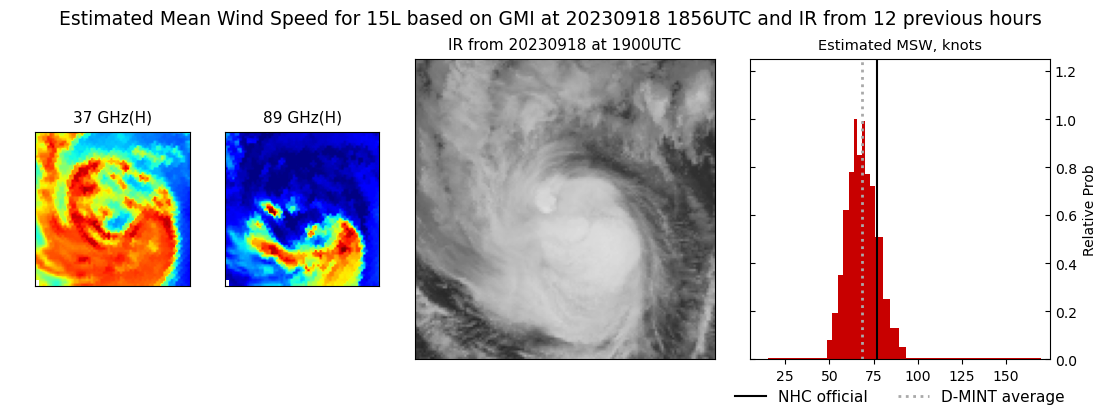 |
| 20230918 | 1026 UTC | SSMISF17 | 983 hPa | 73 kts | 67 kts | 79 kts | 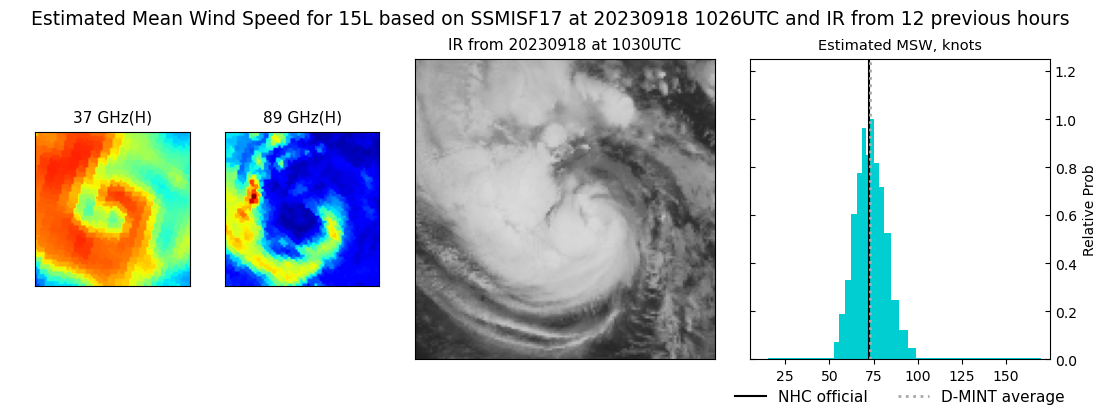 |
| 20230918 | 0911 UTC | GMI | 984 hPa | 72 kts | 67 kts | 78 kts | 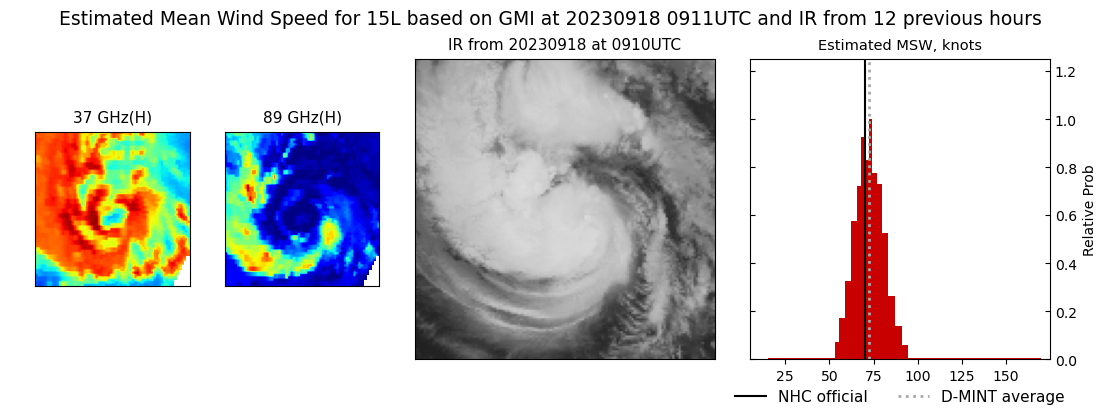 |
| 20230918 | 0705 UTC | SSMISF18 | 985 hPa | 72 kts | 66 kts | 79 kts | 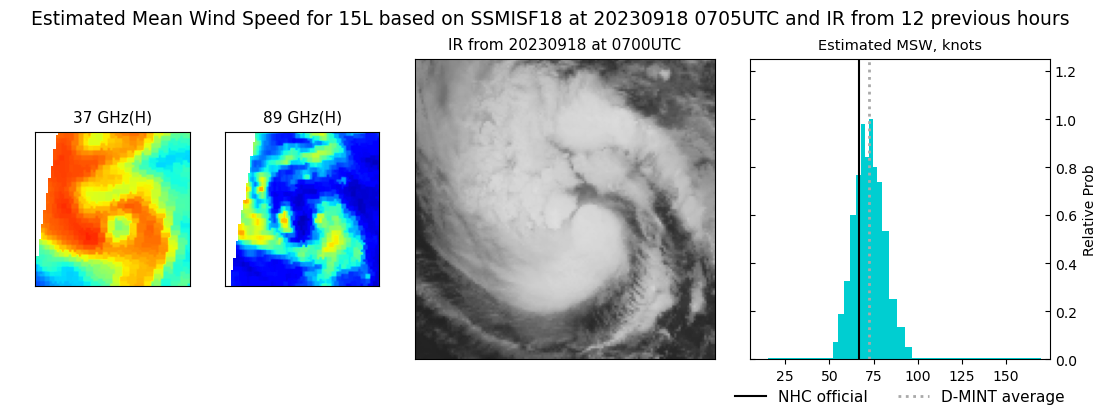 |
| 20230918 | 0447 UTC | AMSR2 | 995 hPa | 65 kts | 60 kts | 72 kts | 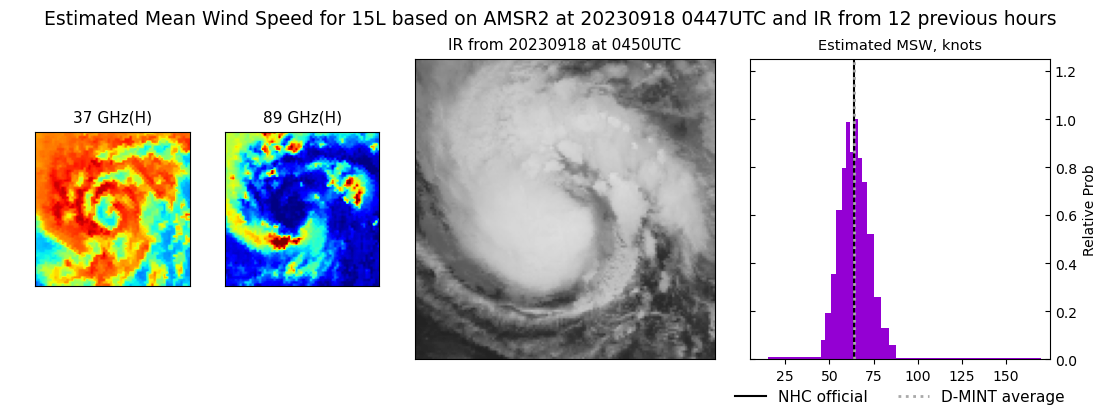 |
| 20230917 | 1835 UTC | SSMISF18 | 1003 hPa | 51 kts | 47 kts | 56 kts | 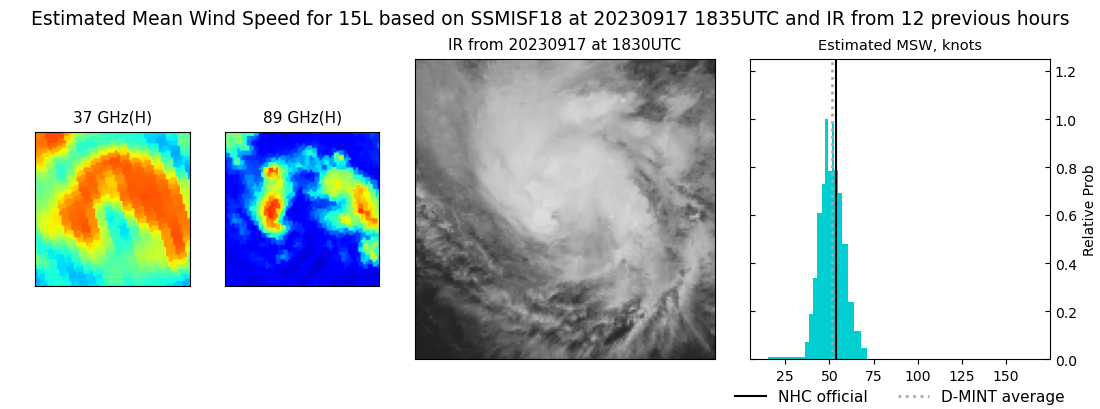 |
| 20230917 | 1638 UTC | AMSR2 | 1003 hPa | 48 kts | 44 kts | 52 kts | 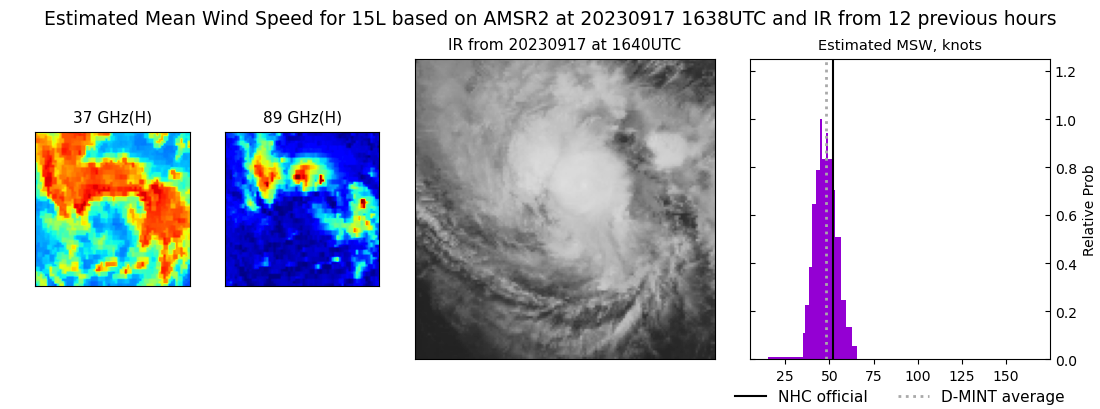 |
| 20230917 | 0718 UTC | SSMISF18 | 1001 hPa | 50 kts | 45 kts | 55 kts | 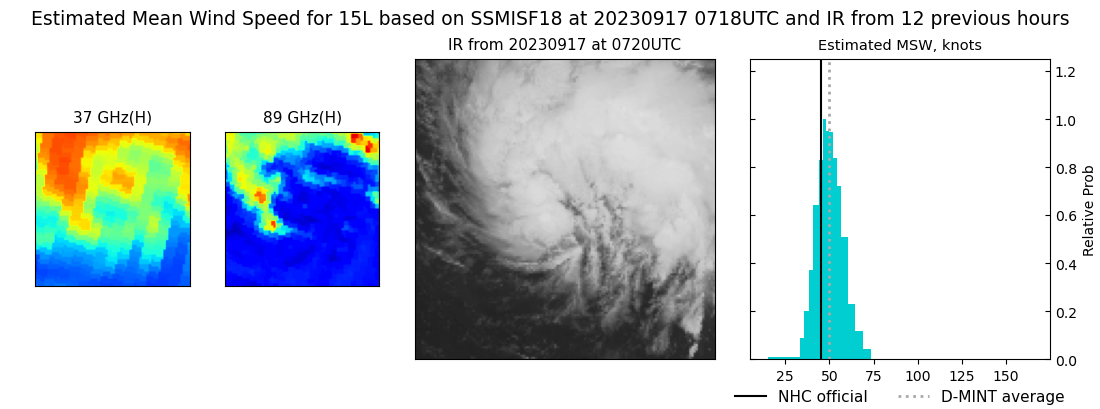 |
| 20230916 | 0915 UTC | SSMISF17 | 1007 hPa | 33 kts | 30 kts | 37 kts | 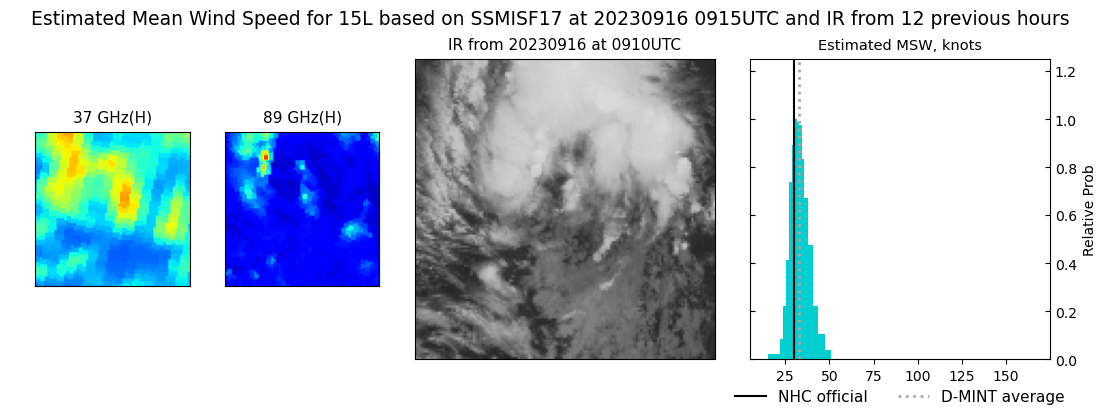 |
| 20230916 | 0733 UTC | SSMISF18 | 1007 hPa | 32 kts | 28 kts | 36 kts | 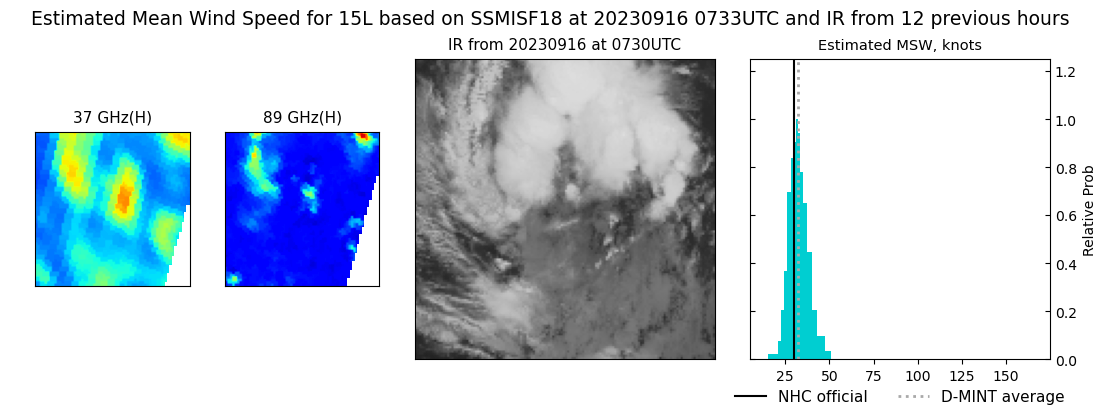 |
| 20230916 | 0501 UTC | AMSR2 | 1006 hPa | 31 kts | 28 kts | 34 kts | 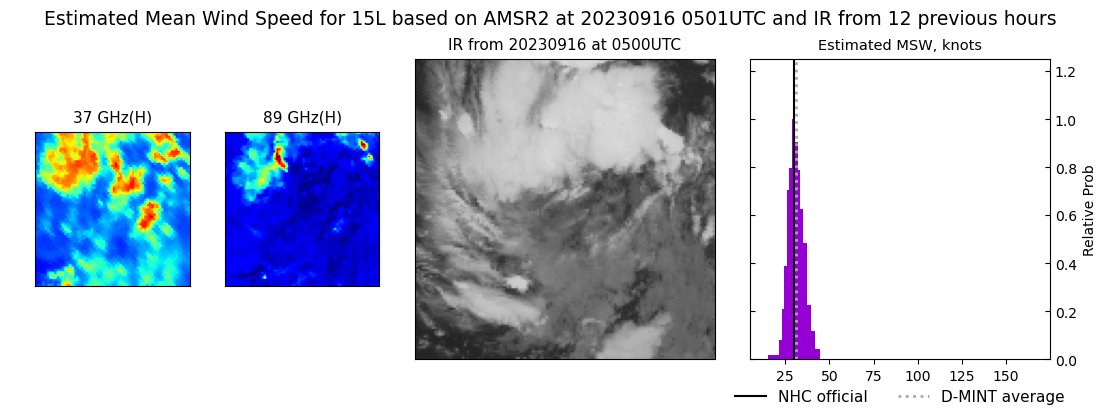 |
| 20230915 | 2041 UTC | SSMISF17 | 1005 hPa | 33 kts | 29 kts | 37 kts | 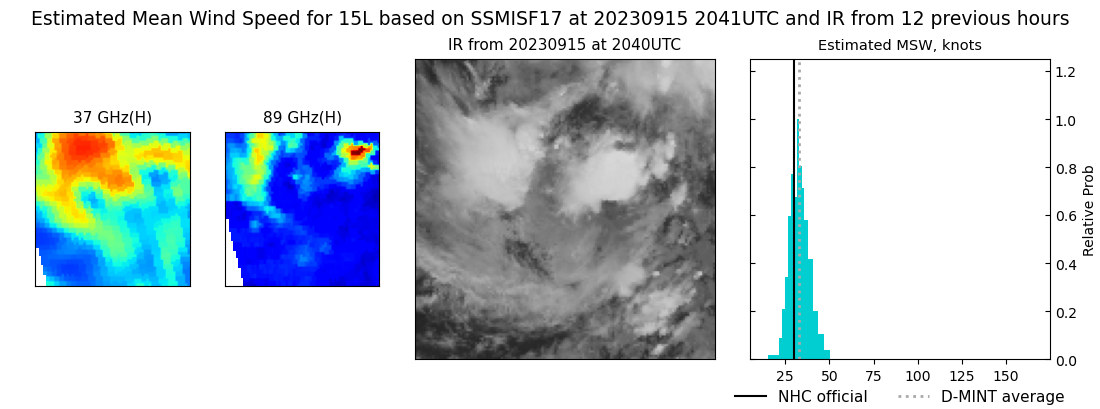 |
| 20230915 | 2006 UTC | GMI | 1005 hPa | 33 kts | 30 kts | 37 kts | 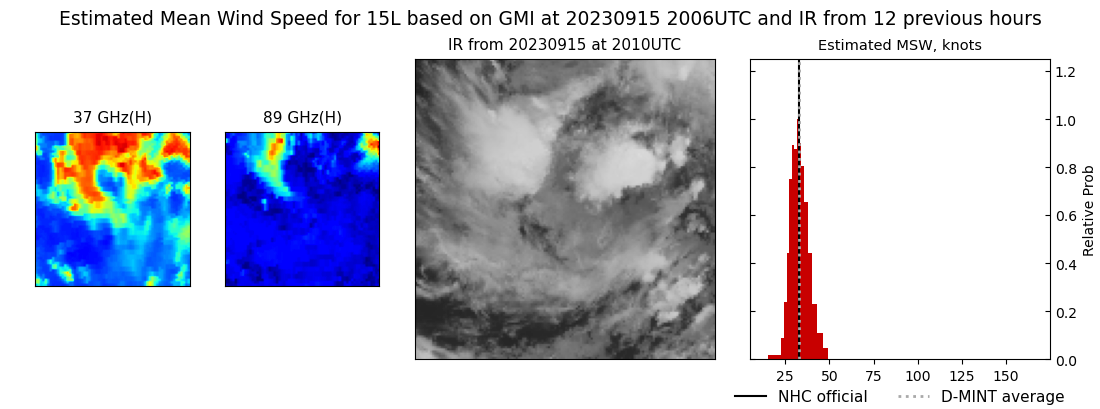 |
| 20230915 | 1857 UTC | SSMISF18 | 1006 hPa | 30 kts | 27 kts | 33 kts | 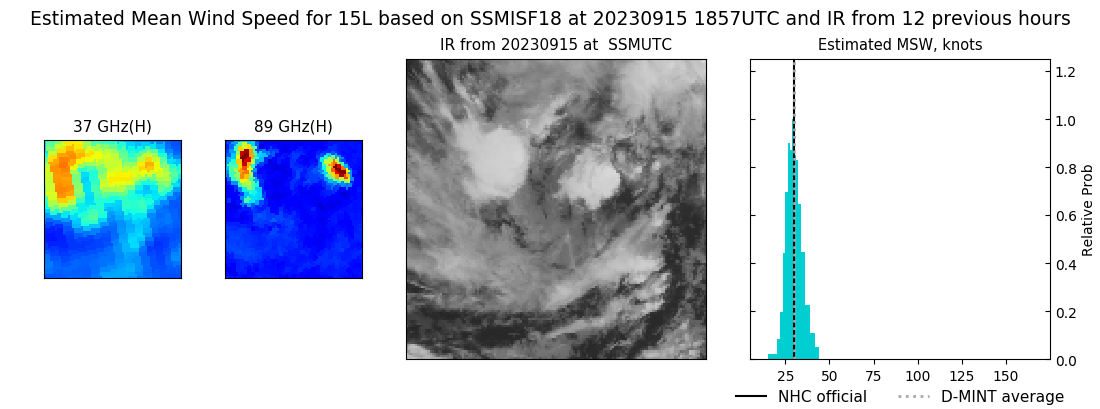 |
|
