|
||
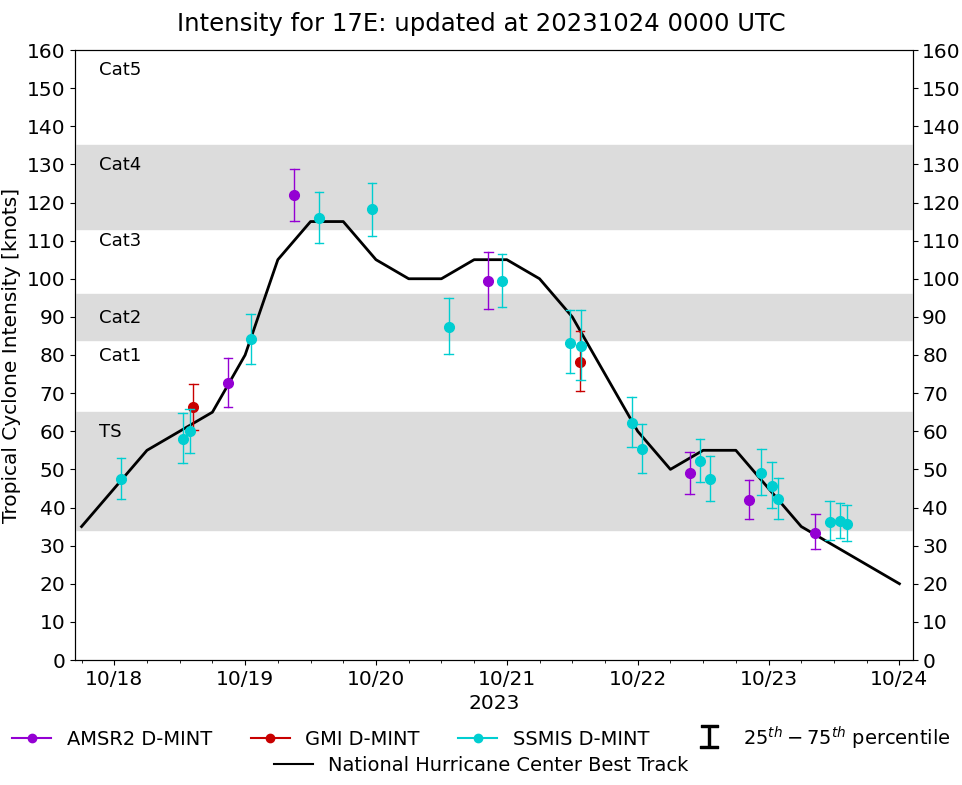 |
D-MINT HISTORY FILE for 2023_17E
| Date | Time | MW Sensor | MSLP | Vmax (30th-70th percentile average) | Vmax 25th percentile | Vmax 75th percentile | Image |
| 20231023 | 1419 UTC | SSMISF17 | 1001 hPa | 36 kts | 31 kts | 41 kts |  |
| 20231023 | 1303 UTC | SSMISF16 | 1003 hPa | 36 kts | 32 kts | 41 kts |  |
| 20231023 | 1111 UTC | SSMISF18 | 1002 hPa | 36 kts | 32 kts | 42 kts |  |
| 20231023 | 0836 UTC | AMSR2 | 1002 hPa | 33 kts | 29 kts | 38 kts |  |
| 20231023 | 0149 UTC | SSMISF17 | 1000 hPa | 42 kts | 37 kts | 48 kts |  |
| 20231023 | 0034 UTC | SSMISF16 | 998 hPa | 46 kts | 40 kts | 52 kts |  |
| 20231022 | 2241 UTC | SSMISF18 | 995 hPa | 49 kts | 43 kts | 55 kts |  |
| 20231022 | 2027 UTC | AMSR2 | 997 hPa | 42 kts | 37 kts | 47 kts |  |
| 20231022 | 1316 UTC | SSMISF16 | 994 hPa | 48 kts | 42 kts | 54 kts |  |
| 20231022 | 1124 UTC | SSMISF18 | 992 hPa | 52 kts | 47 kts | 58 kts |  |
| 20231022 | 0931 UTC | AMSR2 | 993 hPa | 49 kts | 44 kts | 55 kts |  |
| 20231022 | 0046 UTC | SSMISF16 | 987 hPa | 55 kts | 49 kts | 62 kts |  |
| 20231021 | 2253 UTC | SSMISF18 | 981 hPa | 62 kts | 56 kts | 69 kts |  |
| 20231021 | 1331 UTC | SSMISF16 | 964 hPa | 82 kts | 74 kts | 92 kts |  |
| 20231021 | 1322 UTC | GMI | 970 hPa | 78 kts | 70 kts | 86 kts |  |
| 20231021 | 1138 UTC | SSMISF18 | 977 hPa | 83 kts | 75 kts | 92 kts |  |
| 20231020 | 2306 UTC | SSMISF18 | 958 hPa | 99 kts | 93 kts | 107 kts |  |
| 20231020 | 2038 UTC | AMSR2 | 957 hPa | 99 kts | 92 kts | 107 kts |  |
| 20231020 | 1320 UTC | SSMISF17 | 966 hPa | 87 kts | 80 kts | 95 kts |  |
| 20231019 | 2319 UTC | SSMISF18 | 951 hPa | 118 kts | 111 kts | 125 kts |  |
| 20231019 | 1334 UTC | SSMISF17 | 943 hPa | 116 kts | 109 kts | 123 kts |  |
| 20231019 | 0902 UTC | AMSR2 | 940 hPa | 122 kts | 115 kts | 129 kts |  |
| 20231019 | 0100 UTC | SSMISF17 | 971 hPa | 84 kts | 78 kts | 91 kts |  |
| 20231018 | 2049 UTC | AMSR2 | 980 hPa | 73 kts | 66 kts | 79 kts |  |
| 20231018 | 1431 UTC | GMI | 992 hPa | 66 kts | 60 kts | 73 kts |  |
| 20231018 | 1348 UTC | SSMISF17 | 992 hPa | 60 kts | 54 kts | 66 kts |  |
| 20231018 | 1232 UTC | SSMISF16 | 994 hPa | 58 kts | 52 kts | 65 kts |  |
| 20231018 | 0112 UTC | SSMISF17 | 1001 hPa | 47 kts | 42 kts | 53 kts |  |