|
||
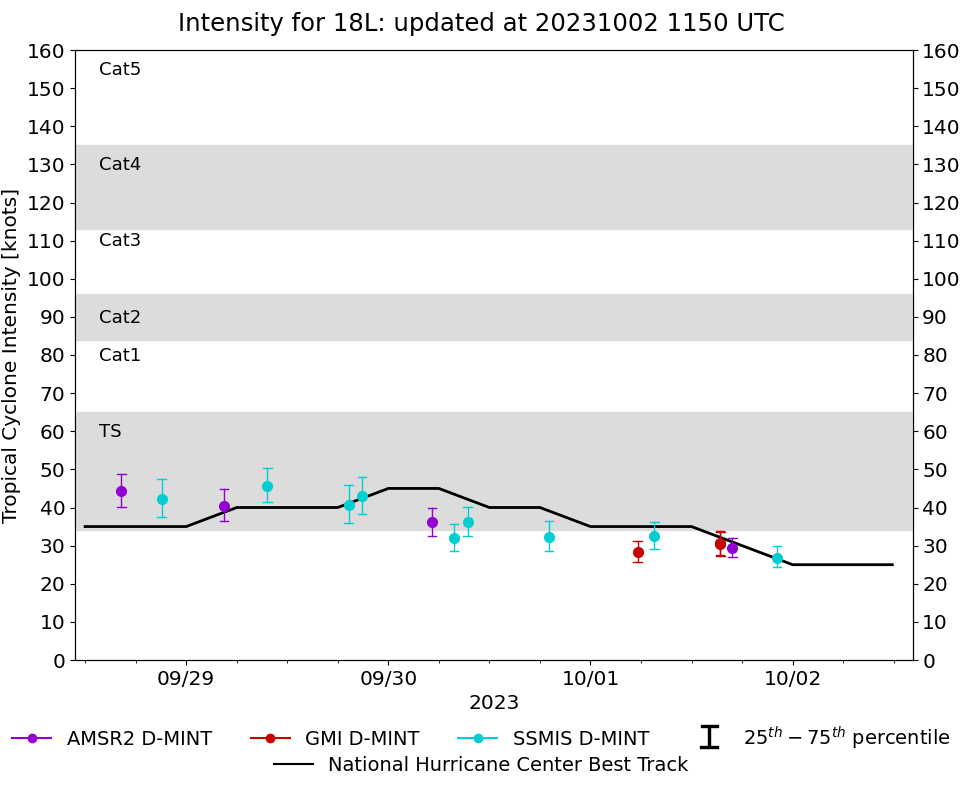 |
D-MINT HISTORY FILE for 2023_18L
| Date | Time | MW Sensor | MSLP | Vmax (30th-70th percentile average) | Vmax 25th percentile | Vmax 75th percentile | Image |
| 20231001 | 2209 UTC | SSMISF17 | 1009 hPa | 27 kts | 24 kts | 30 kts | 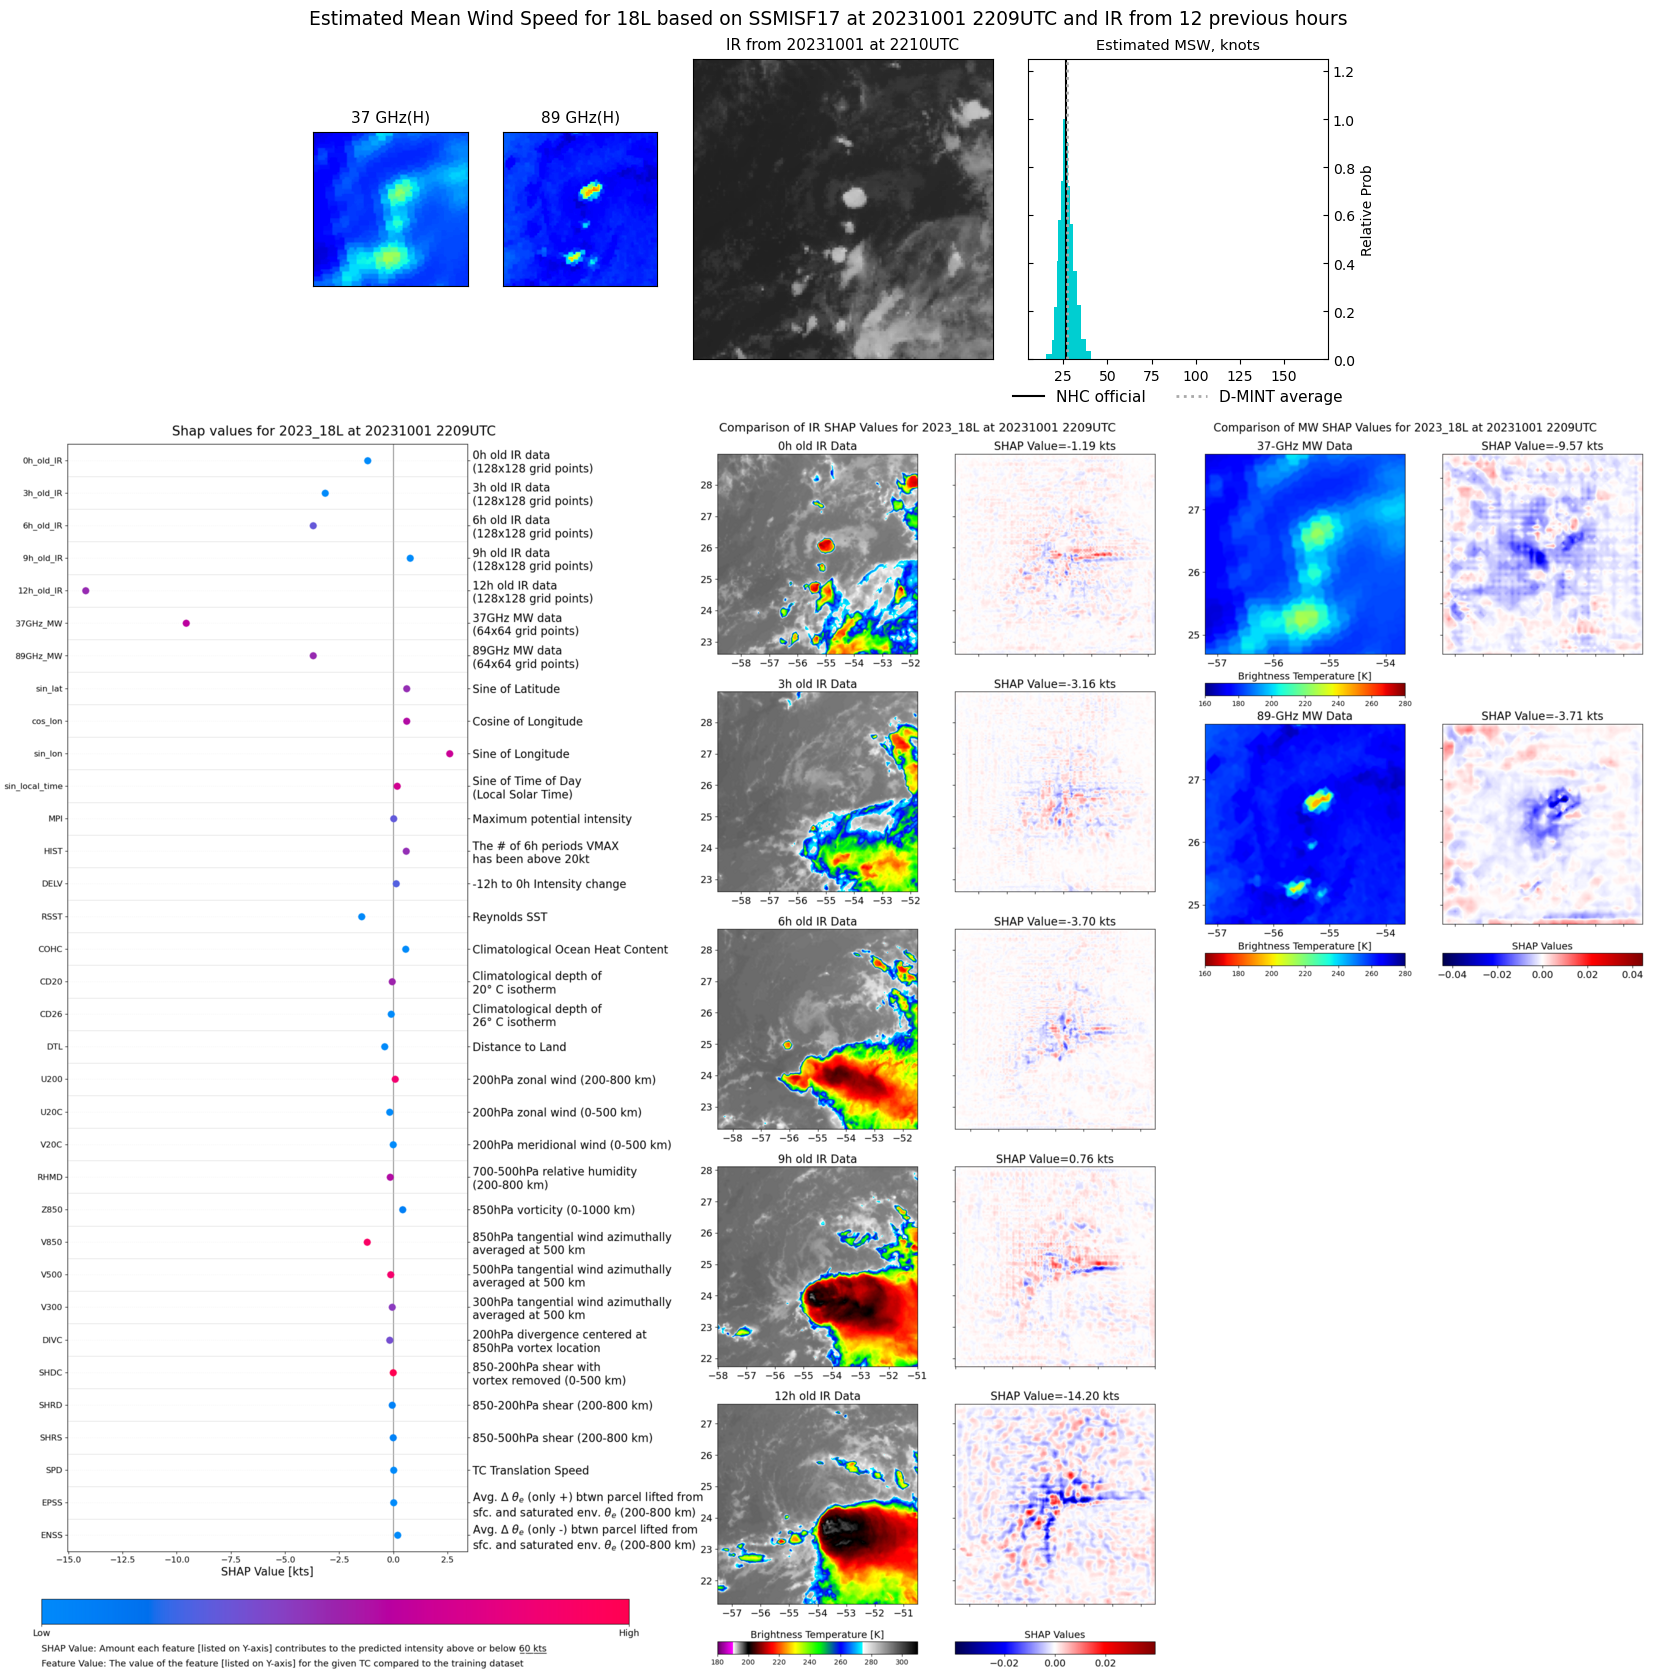 |
| 20231001 | 1651 UTC | AMSR2 | 1007 hPa | 29 kts | 27 kts | 32 kts | 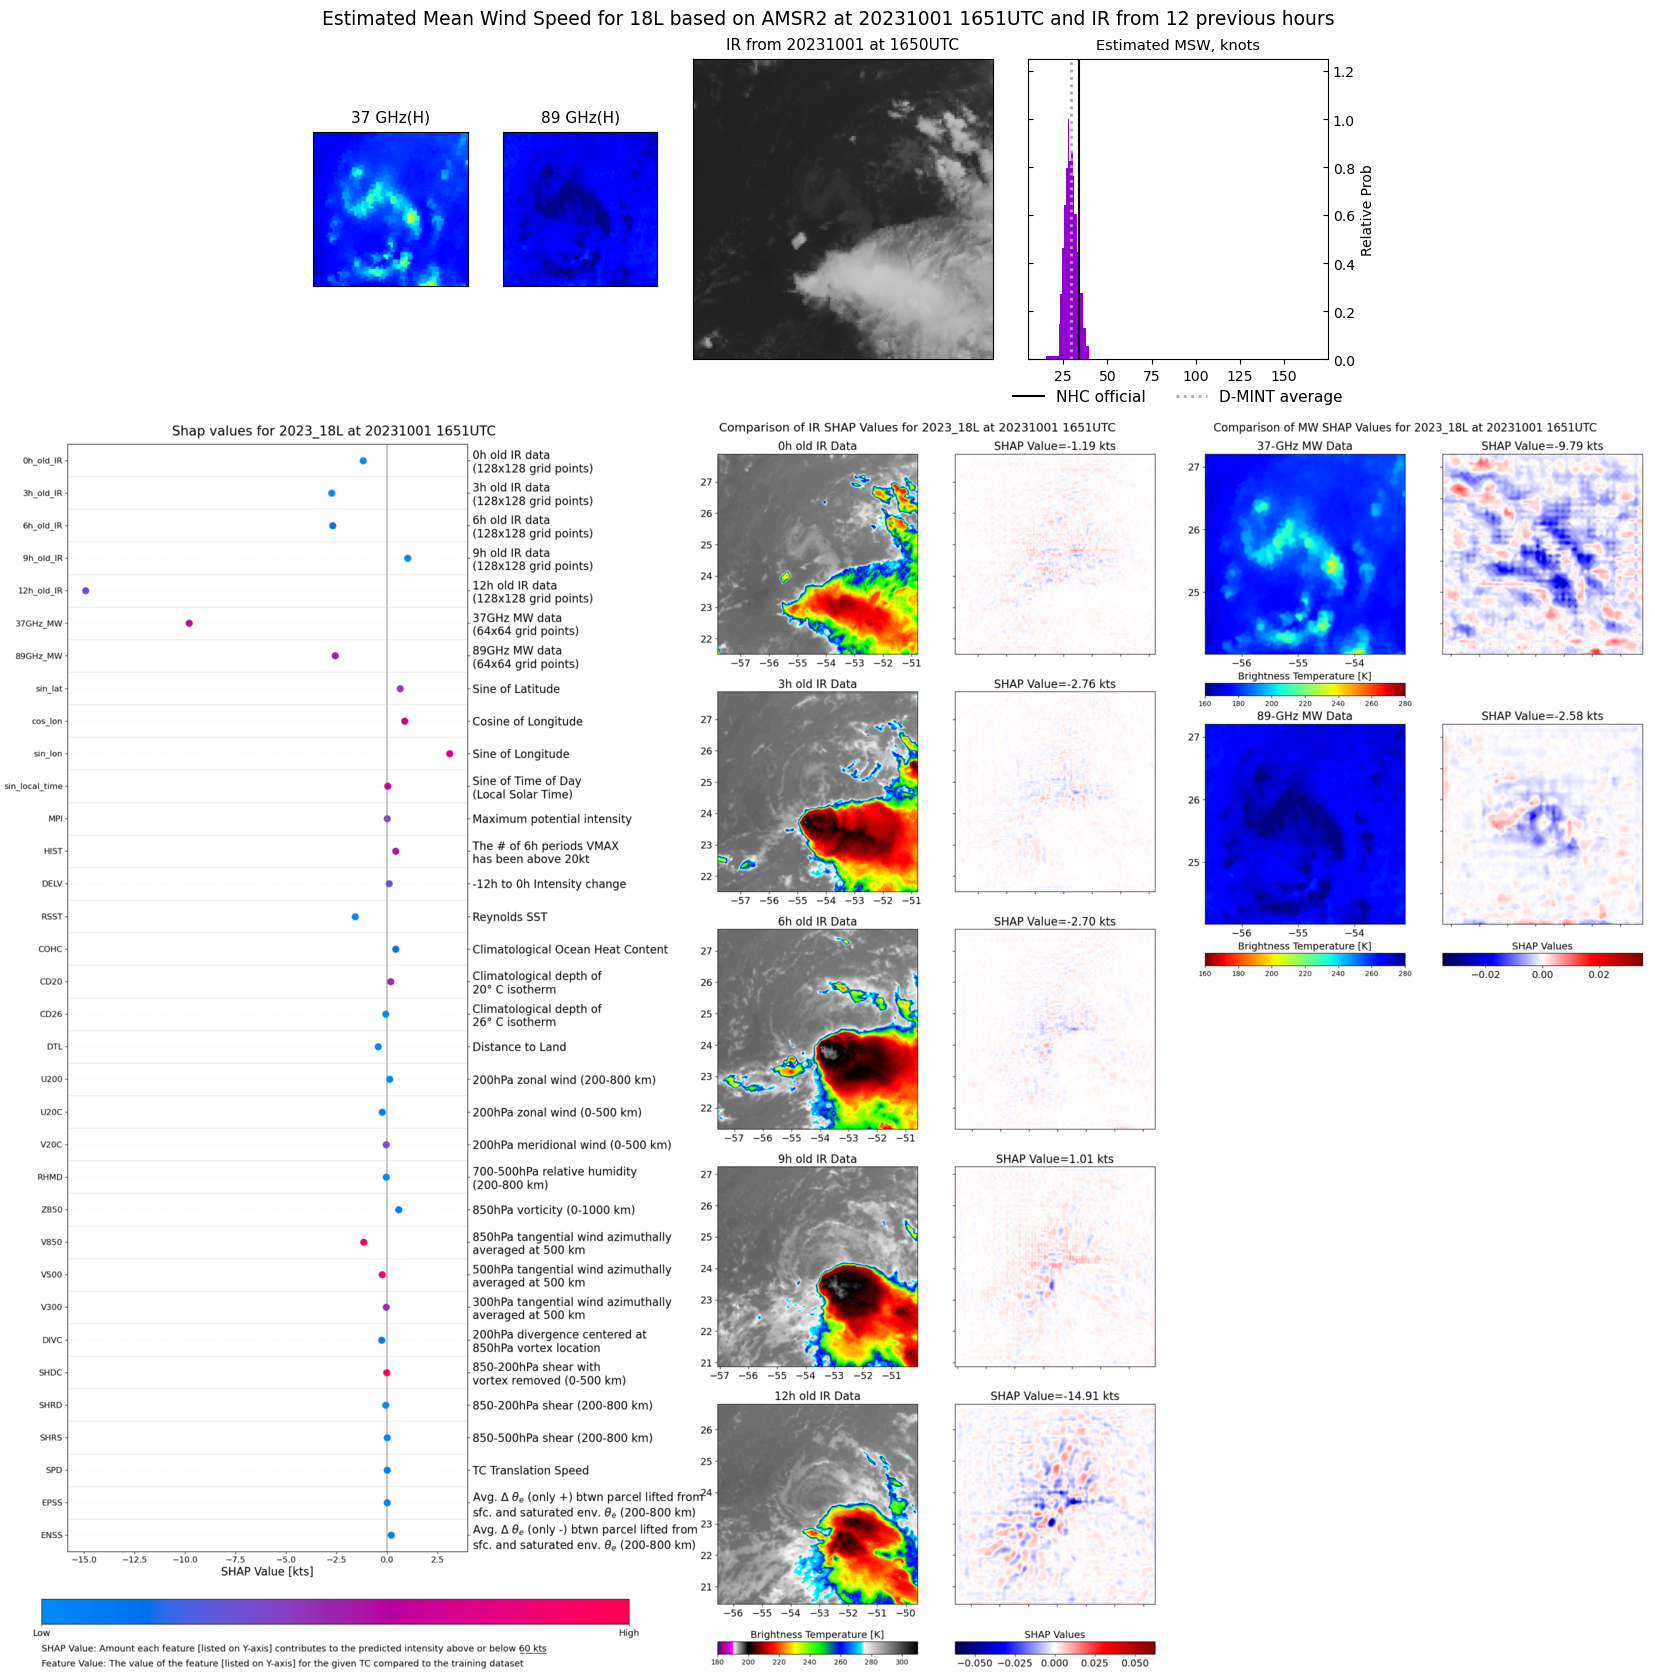 |
| 20231001 | 1525 UTC | GMI | 1007 hPa | 30 kts | 27 kts | 33 kts | 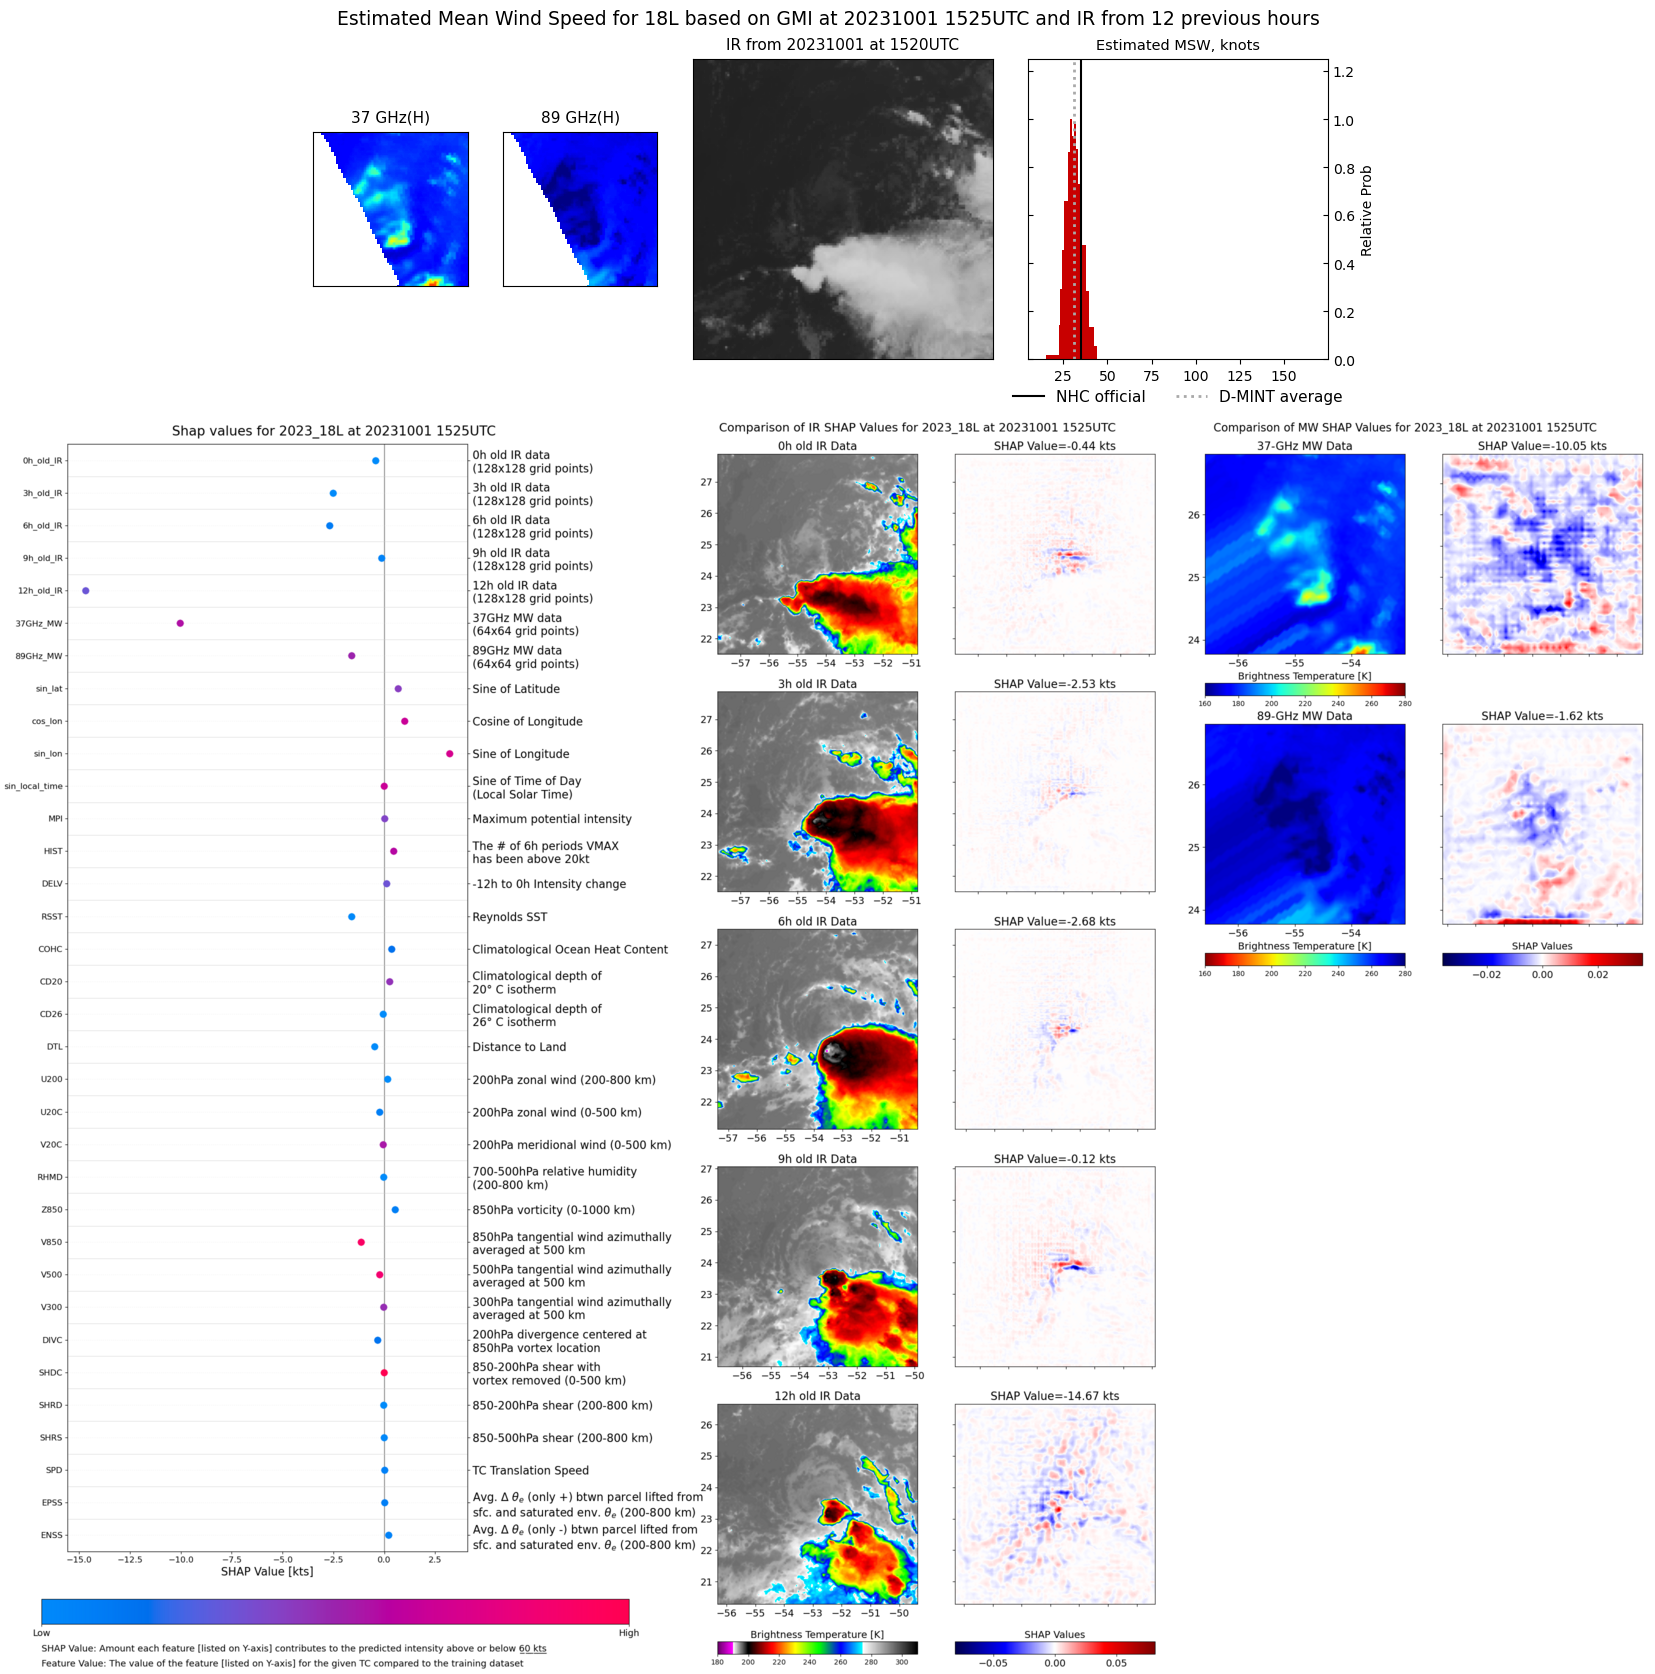 |
| 20231001 | 1521 UTC | GMI | 1007 hPa | 31 kts | 28 kts | 34 kts |  |
| 20231001 | 0735 UTC | SSMISF18 | 1006 hPa | 33 kts | 29 kts | 36 kts | 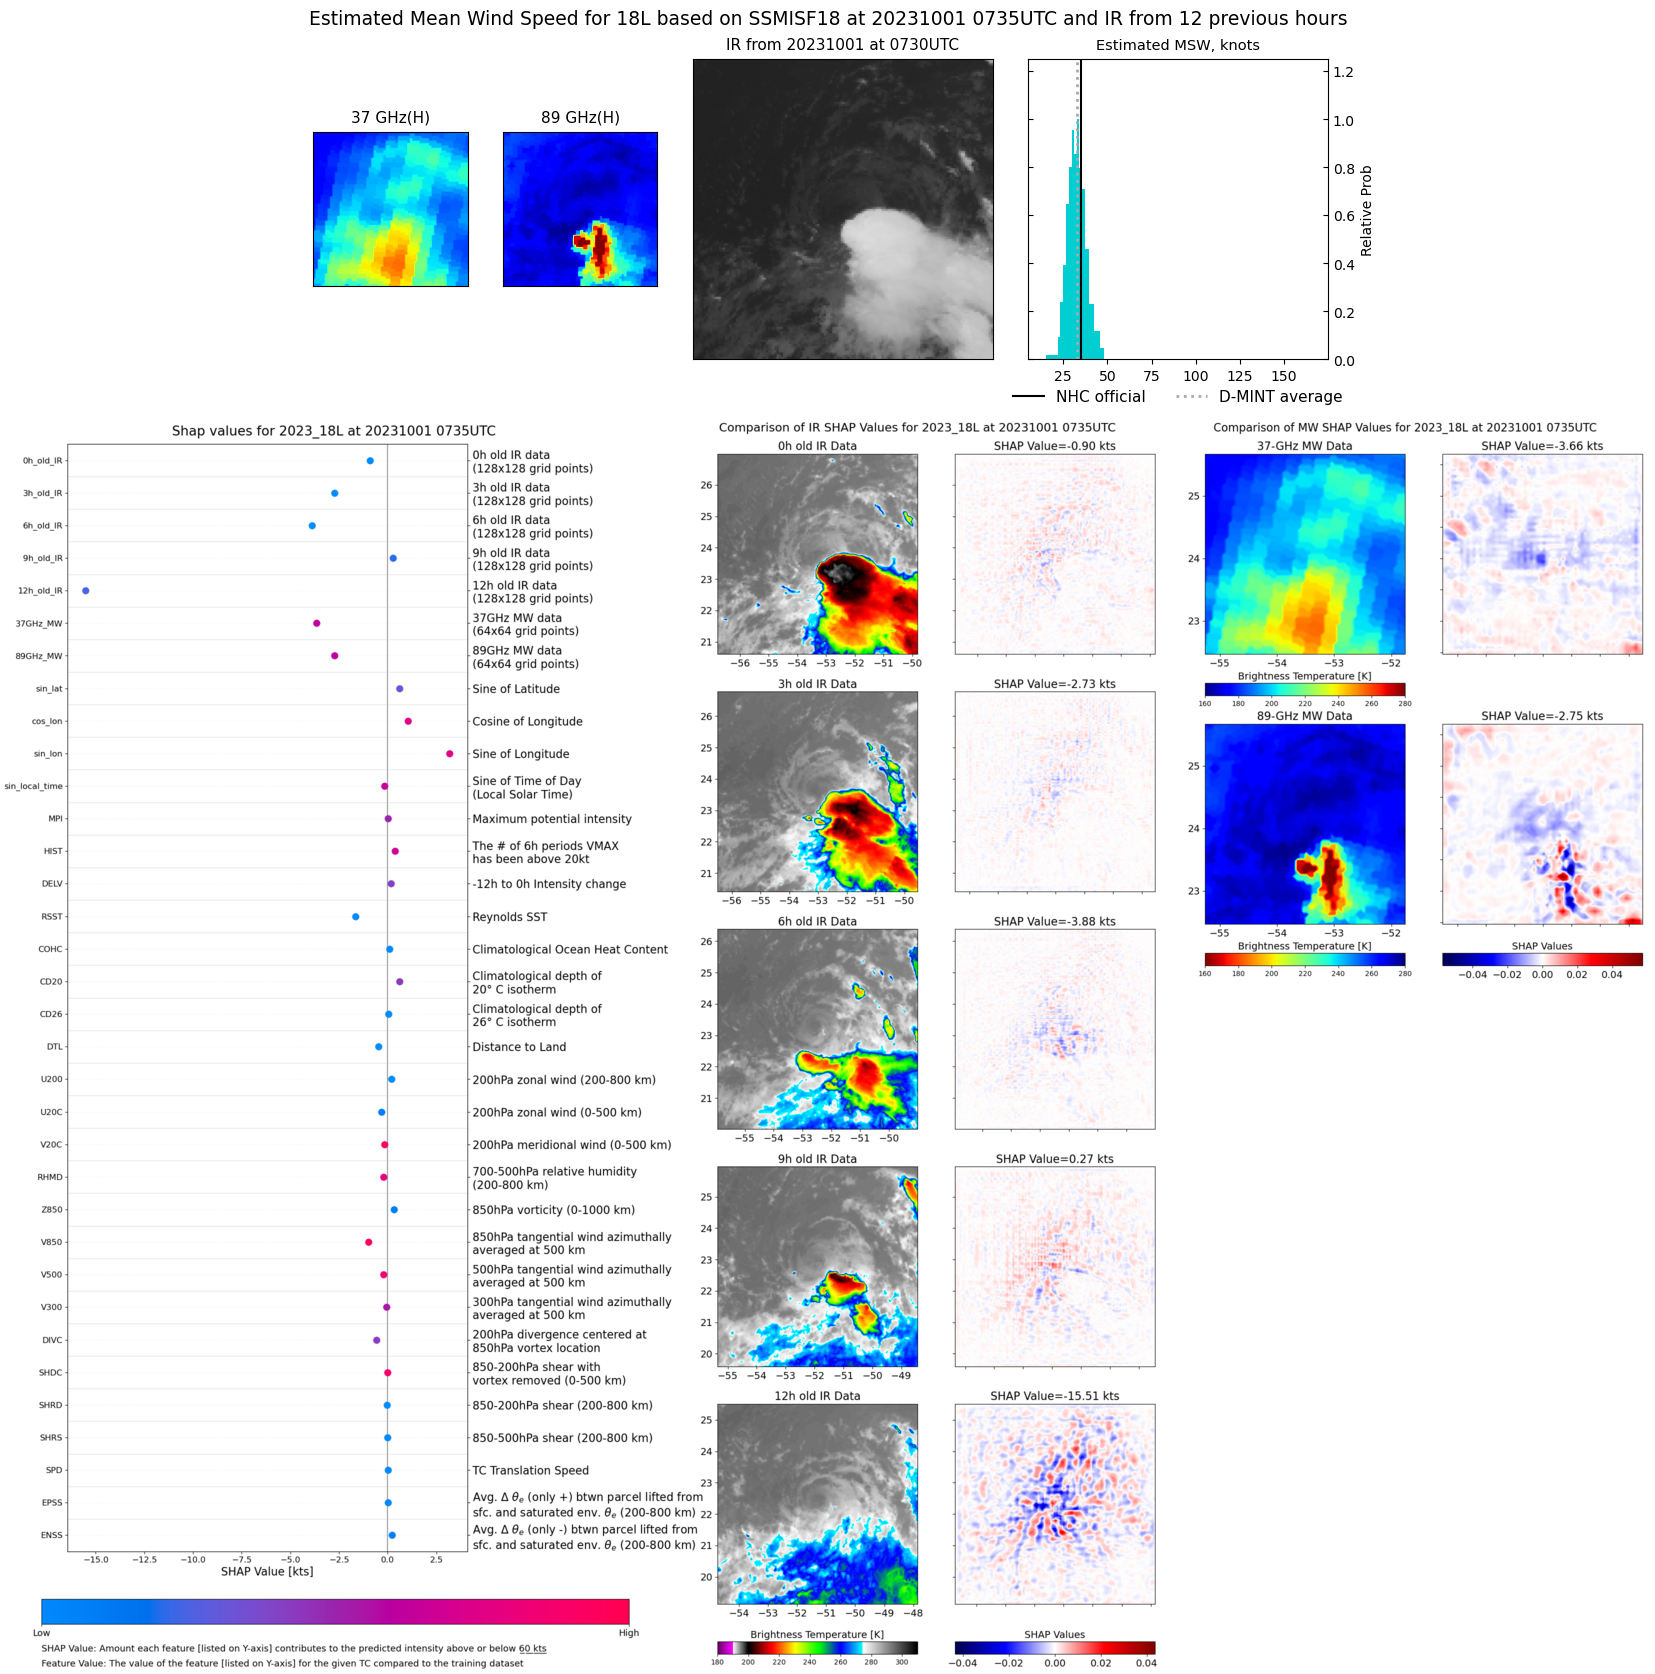 |
| 20231001 | 0536 UTC | GMI | 1008 hPa | 28 kts | 26 kts | 31 kts | 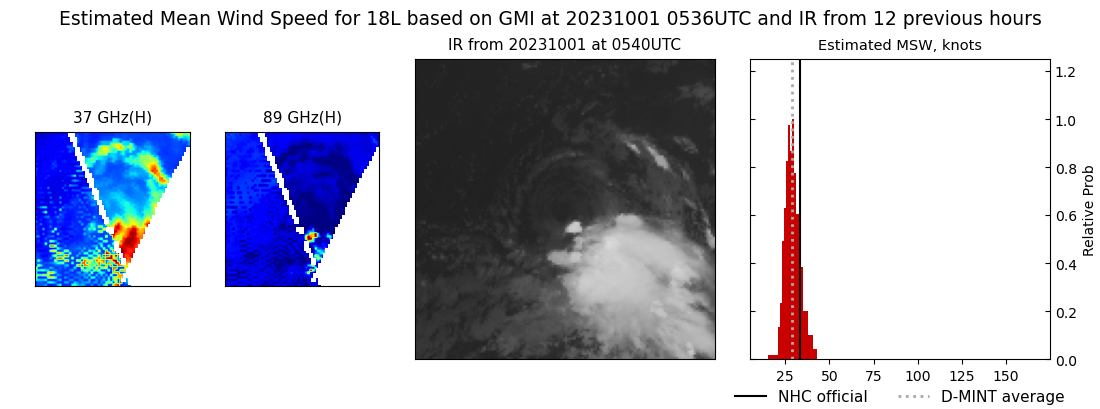 |
| 20230930 | 1903 UTC | SSMISF18 | 1005 hPa | 32 kts | 29 kts | 36 kts | 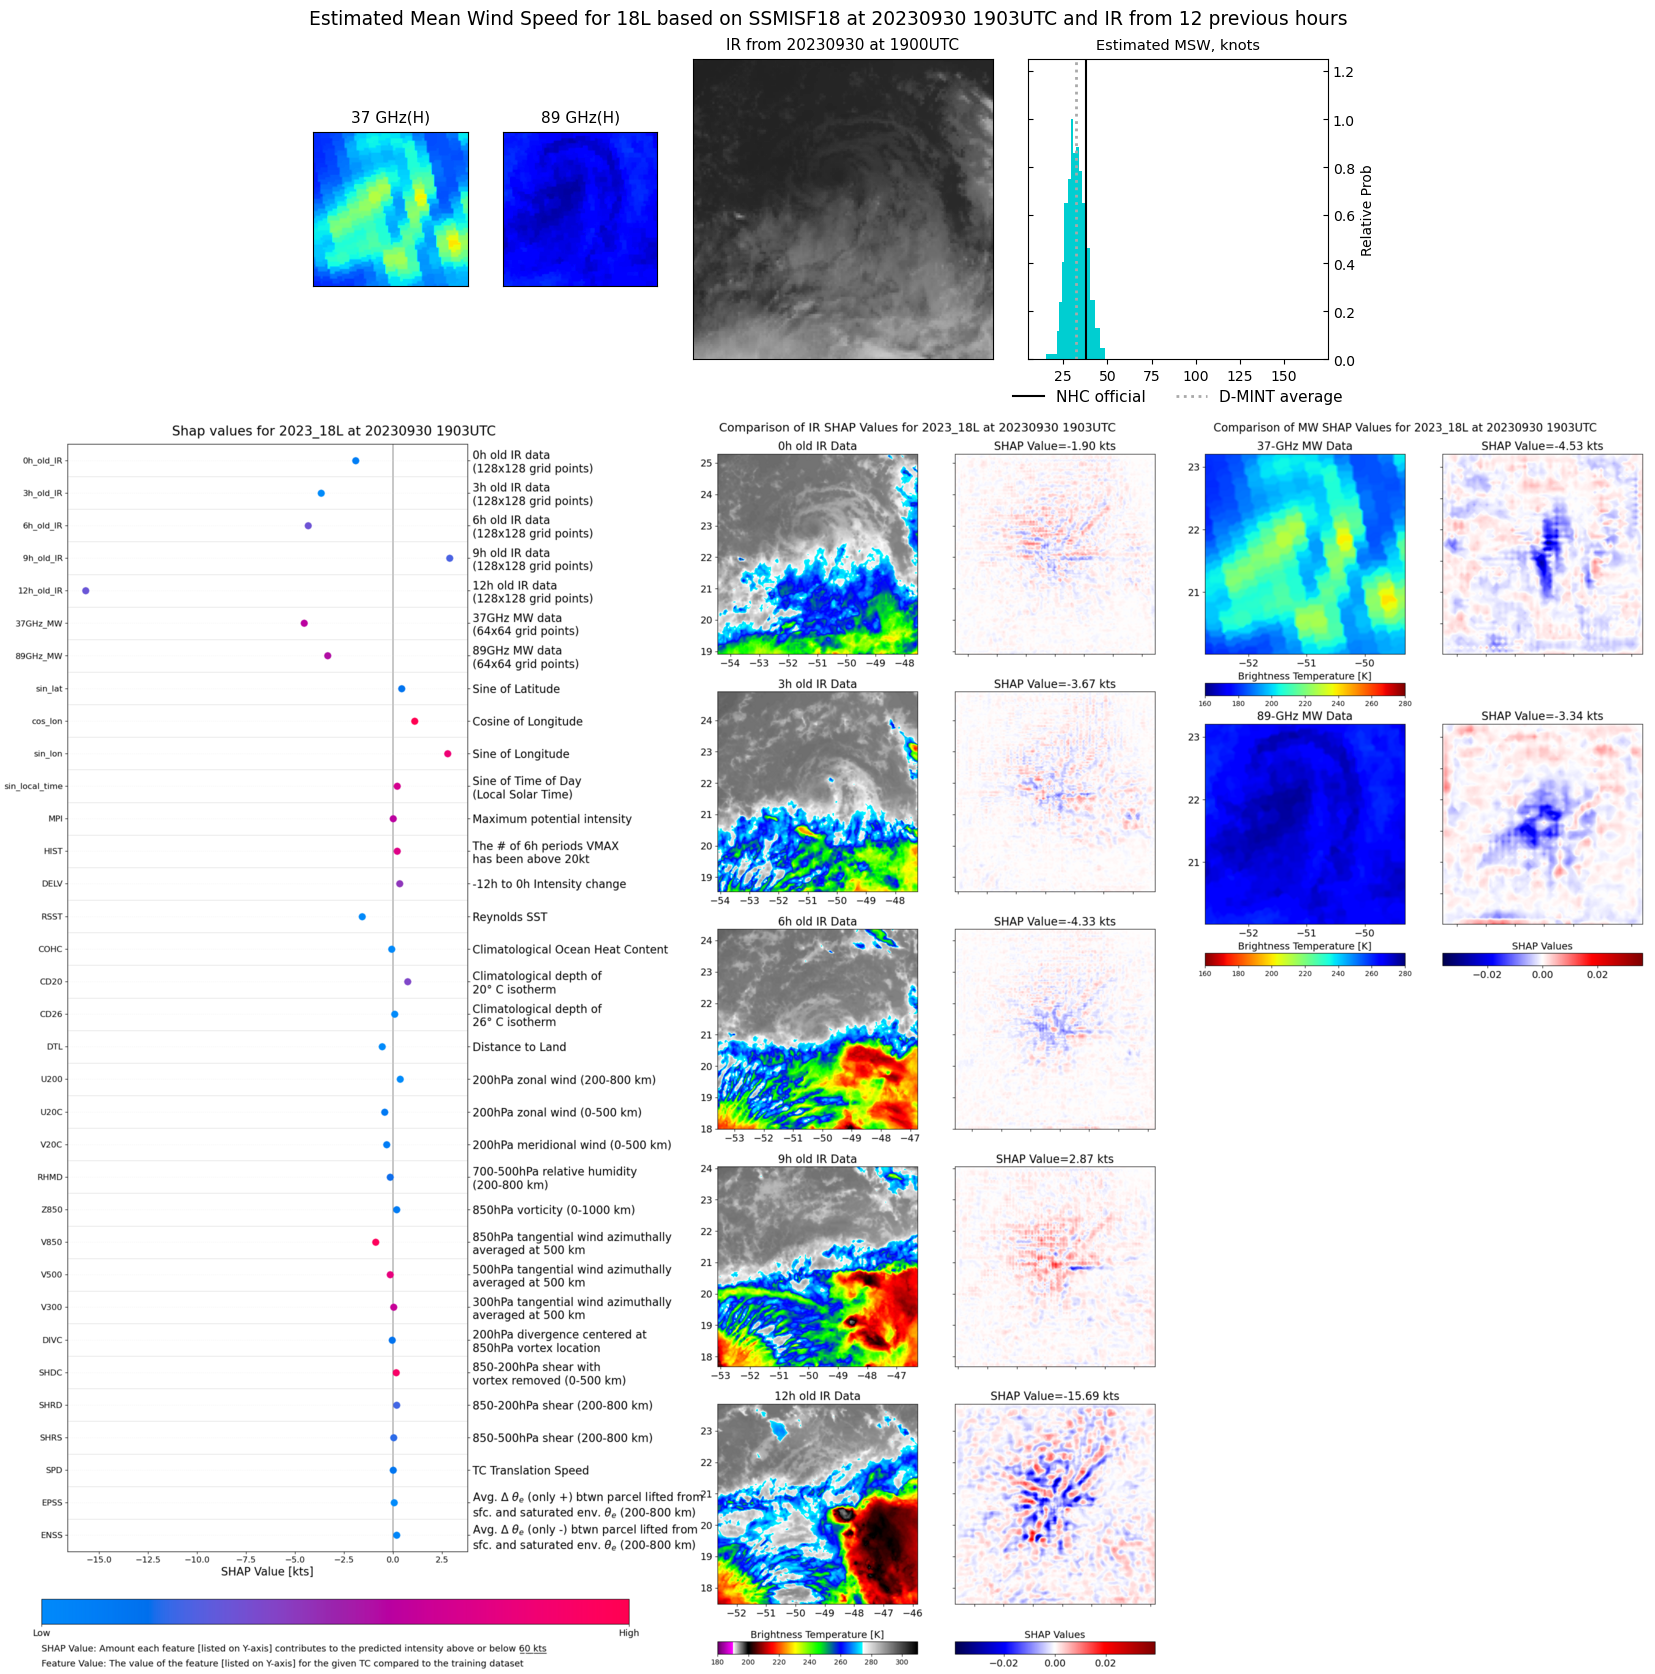 |
| 20230930 | 0925 UTC | SSMISF17 | 1007 hPa | 36 kts | 33 kts | 40 kts | 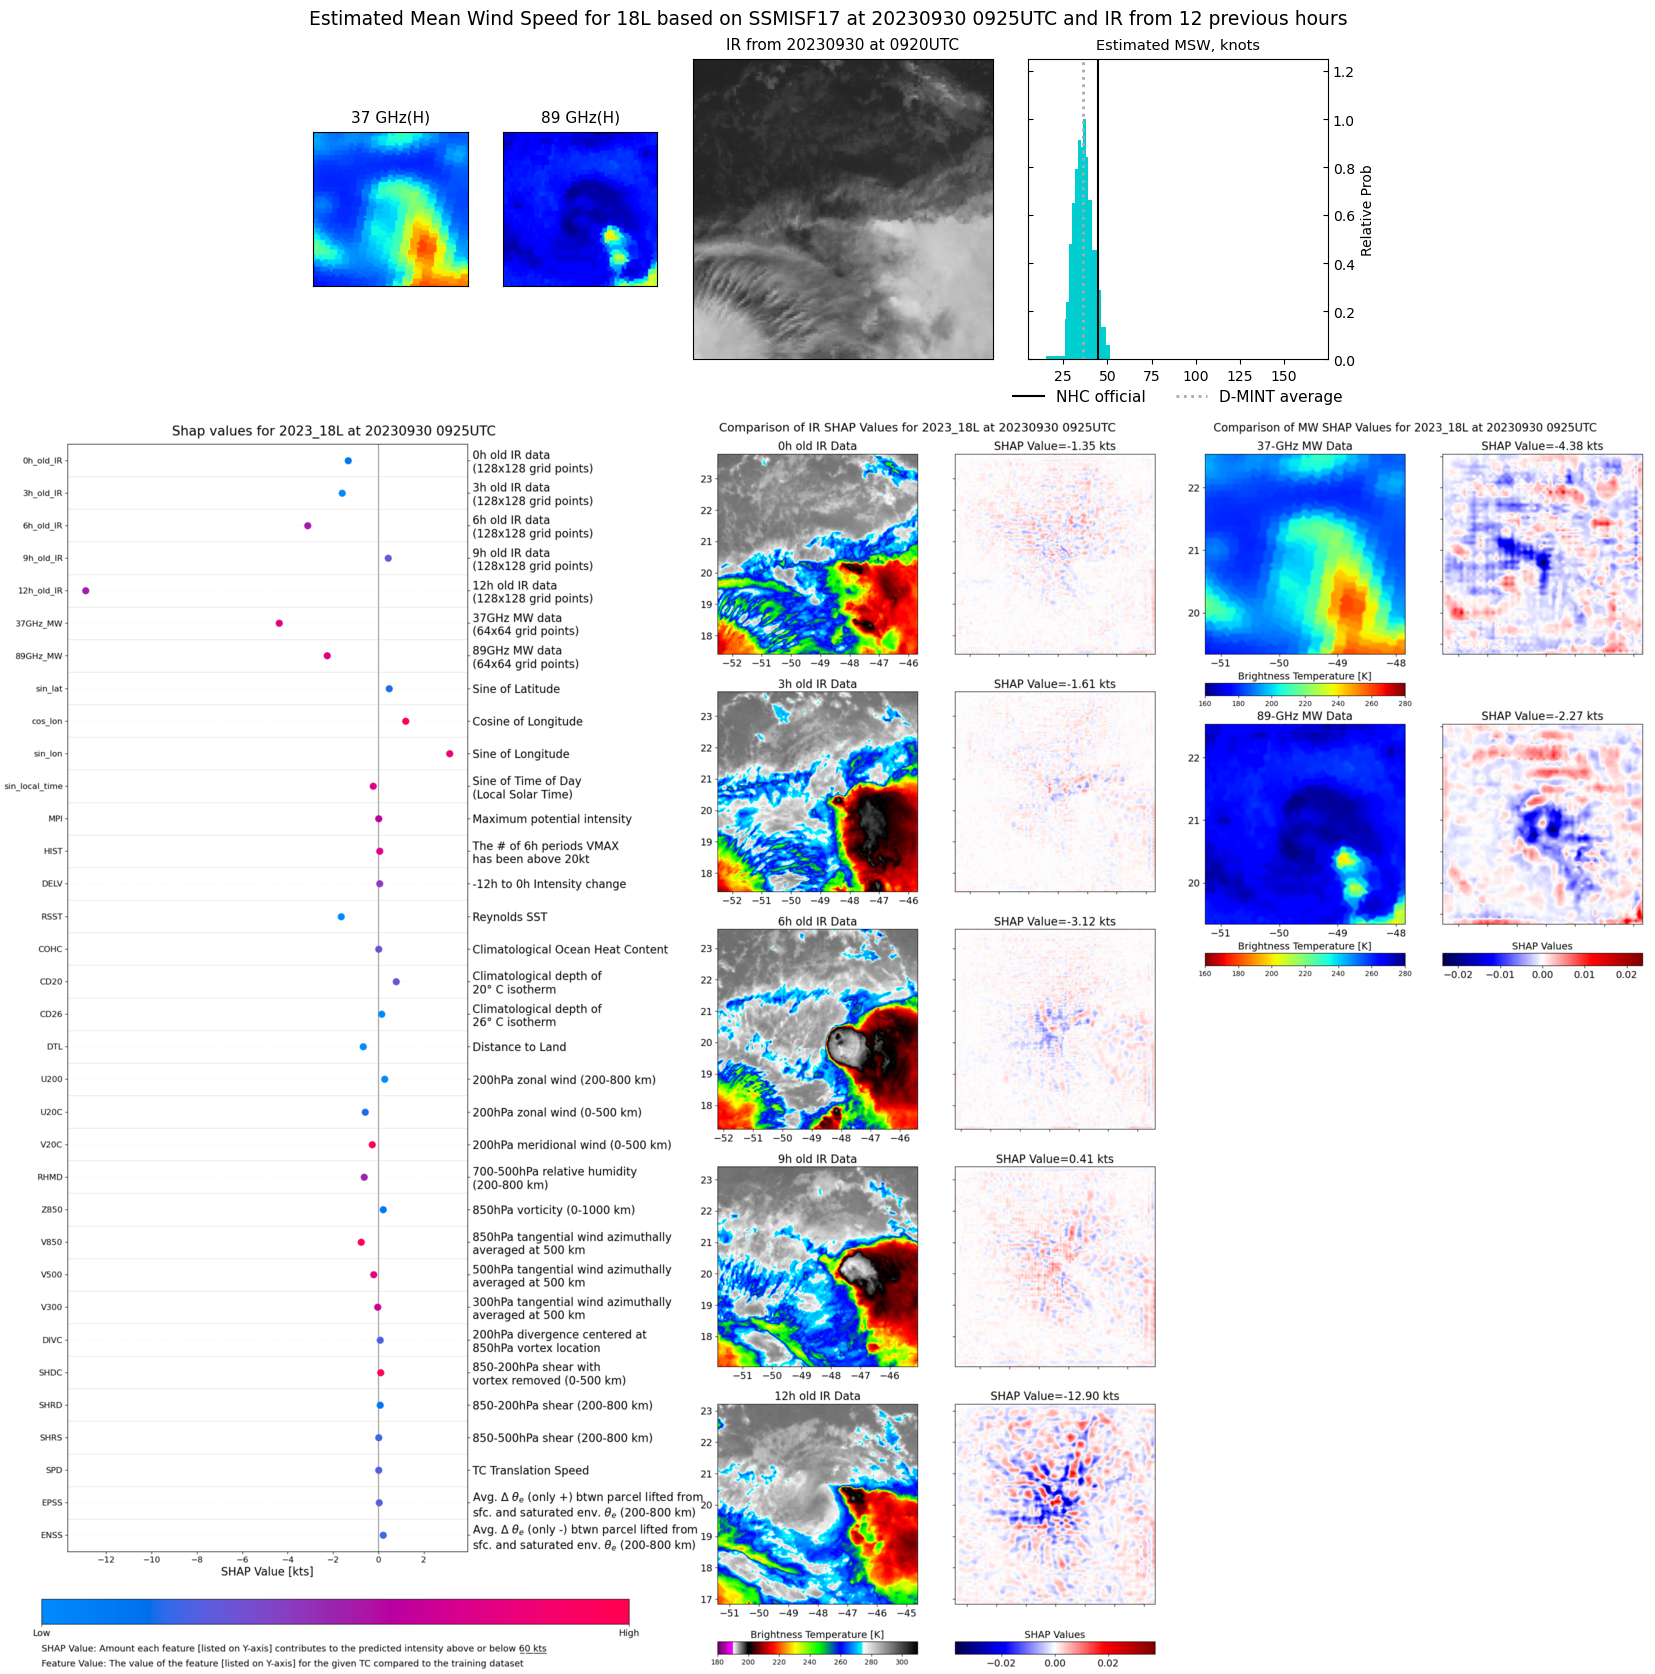 |
| 20230930 | 0749 UTC | SSMISF18 | 1007 hPa | 32 kts | 29 kts | 36 kts | 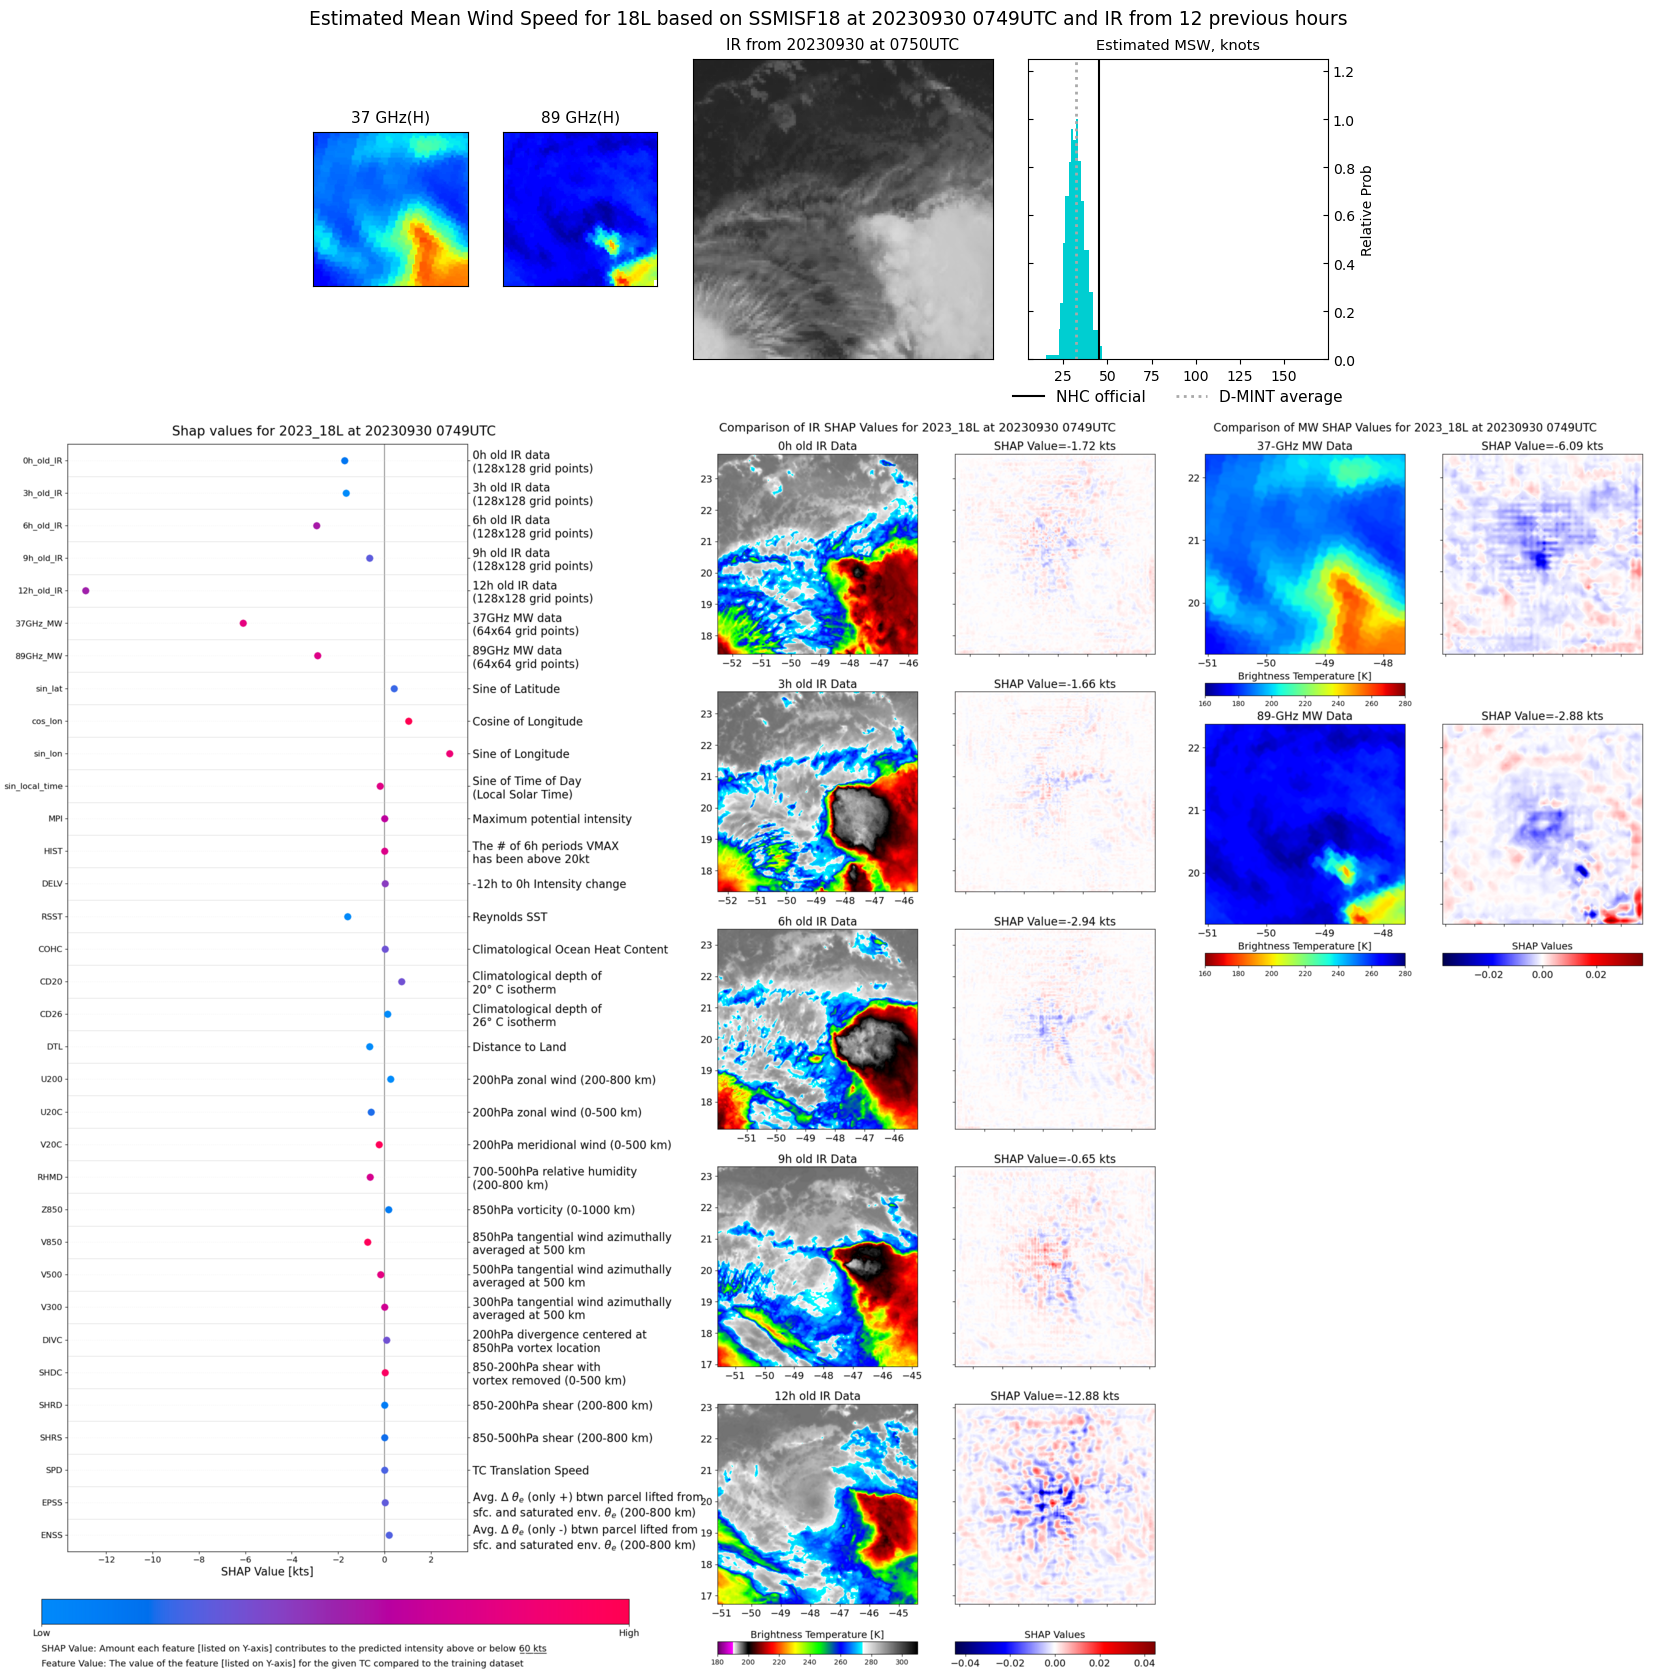 |
| 20230930 | 0512 UTC | AMSR2 | 1007 hPa | 36 kts | 32 kts | 40 kts | 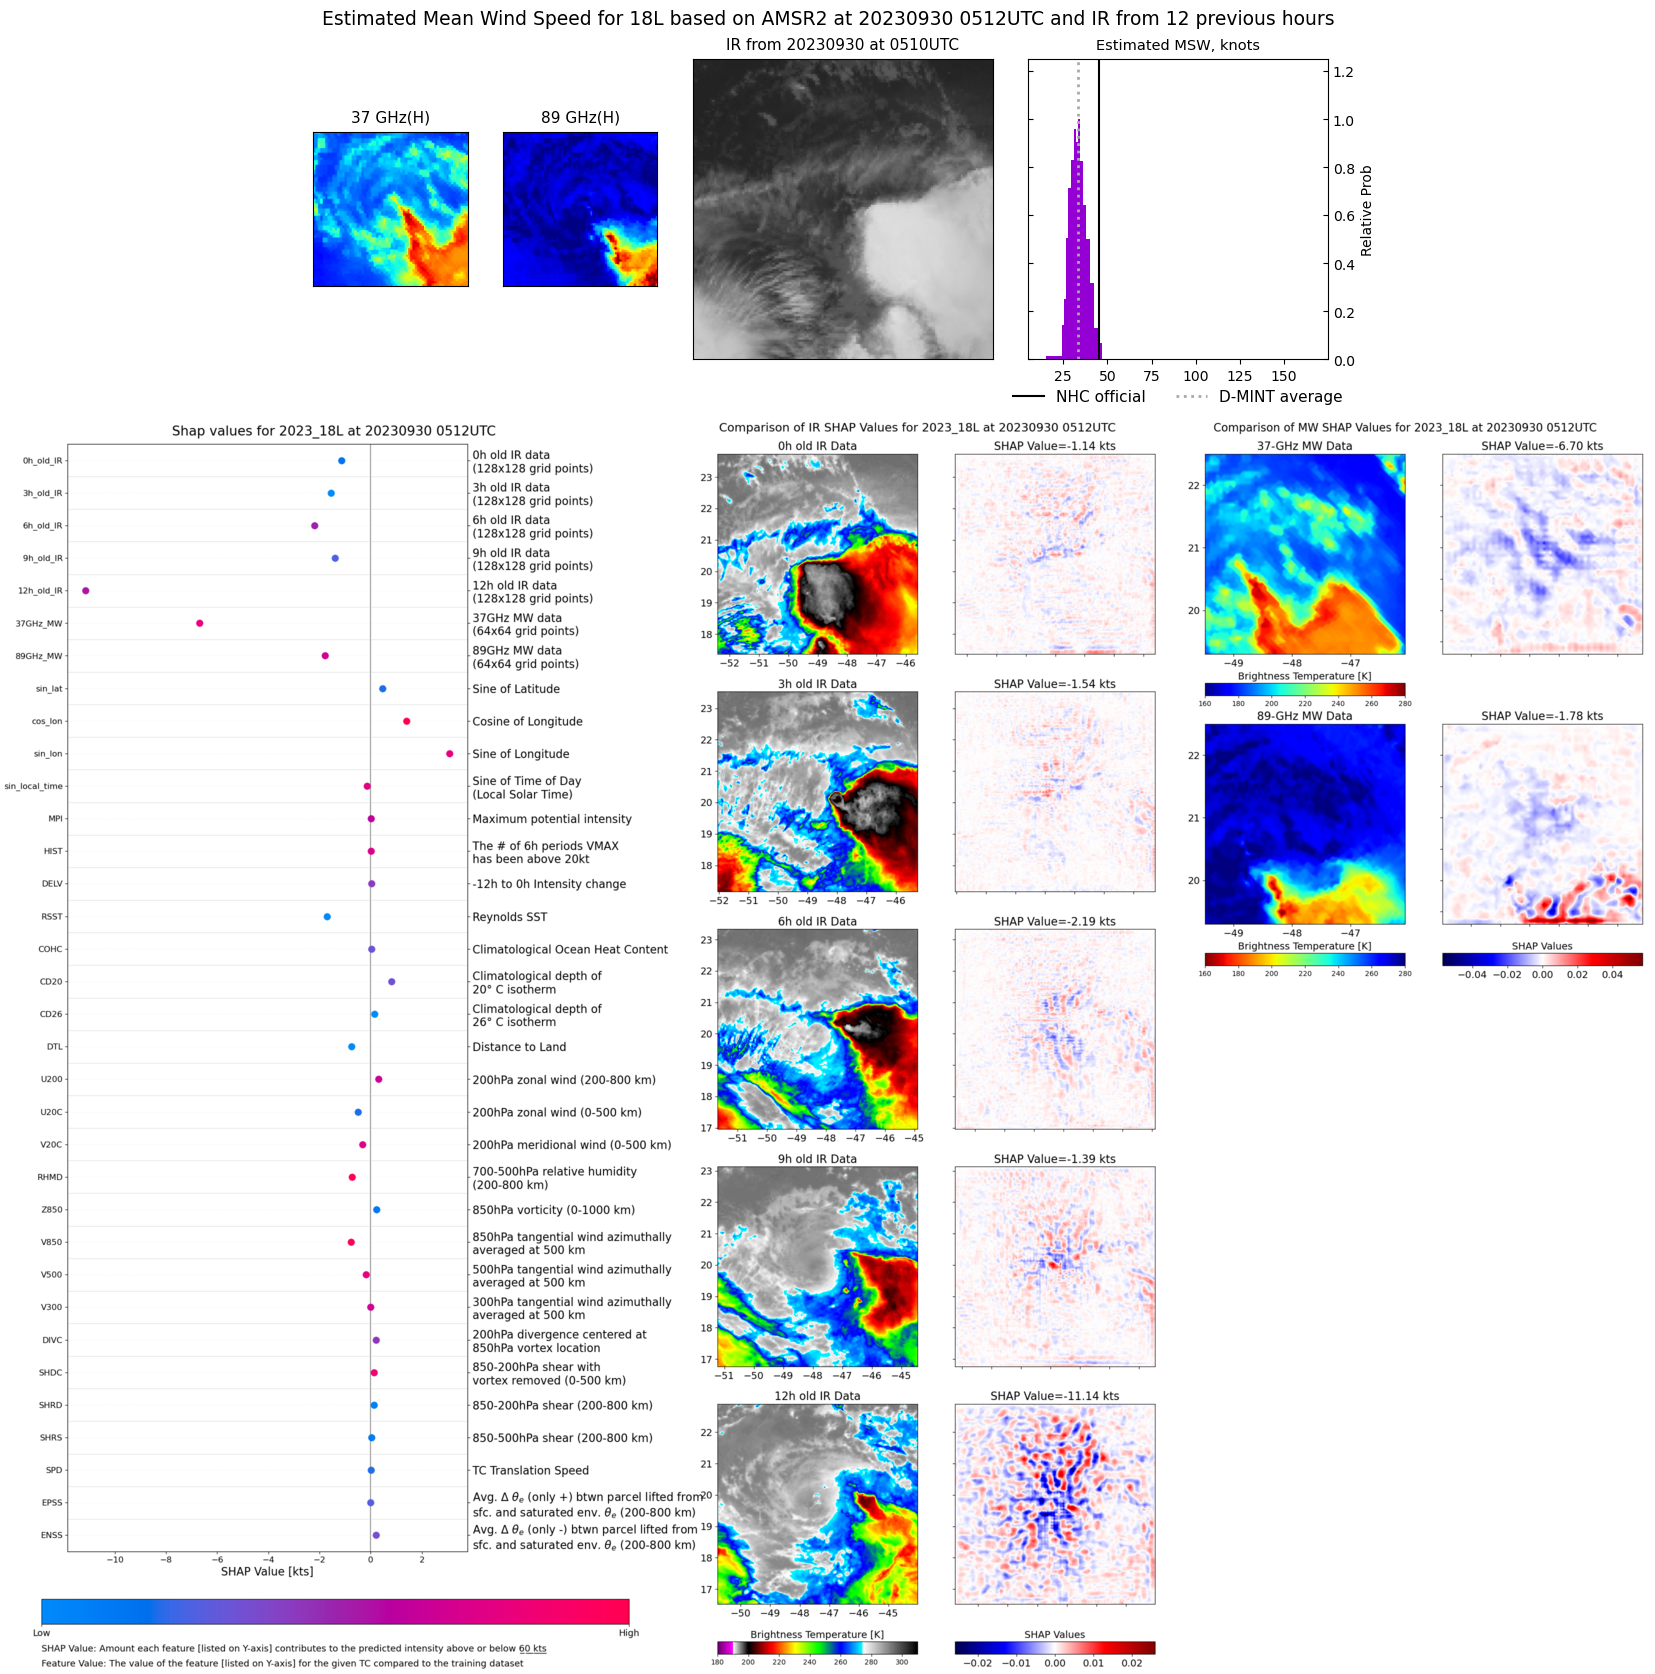 |
| 20230929 | 2054 UTC | SSMISF17 | 1001 hPa | 43 kts | 38 kts | 48 kts | 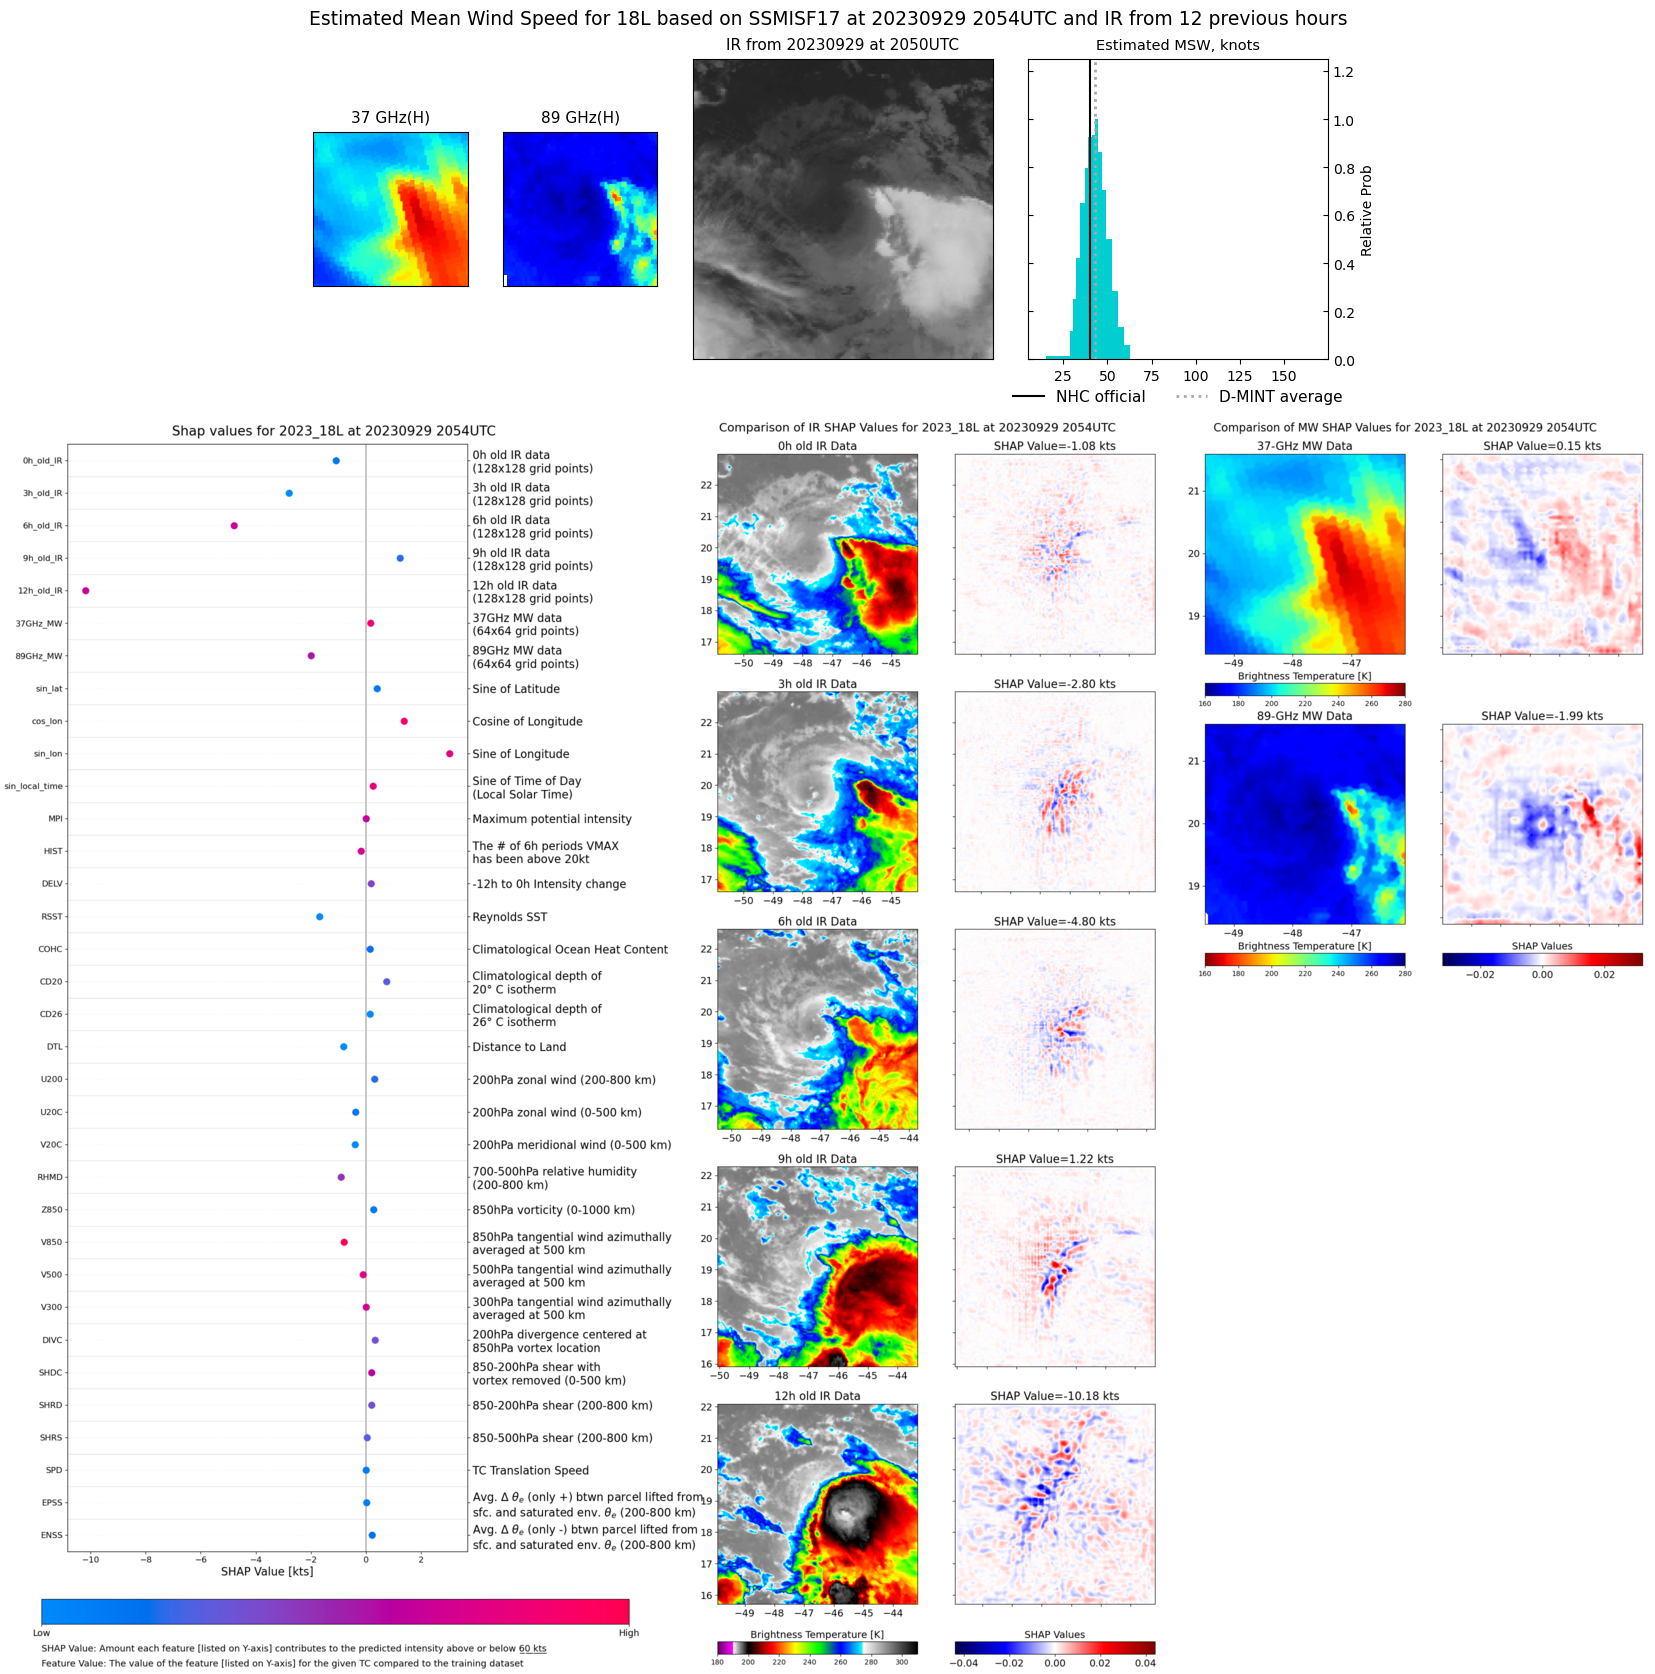 |
| 20230929 | 1917 UTC | SSMISF18 | 1002 hPa | 41 kts | 36 kts | 46 kts | 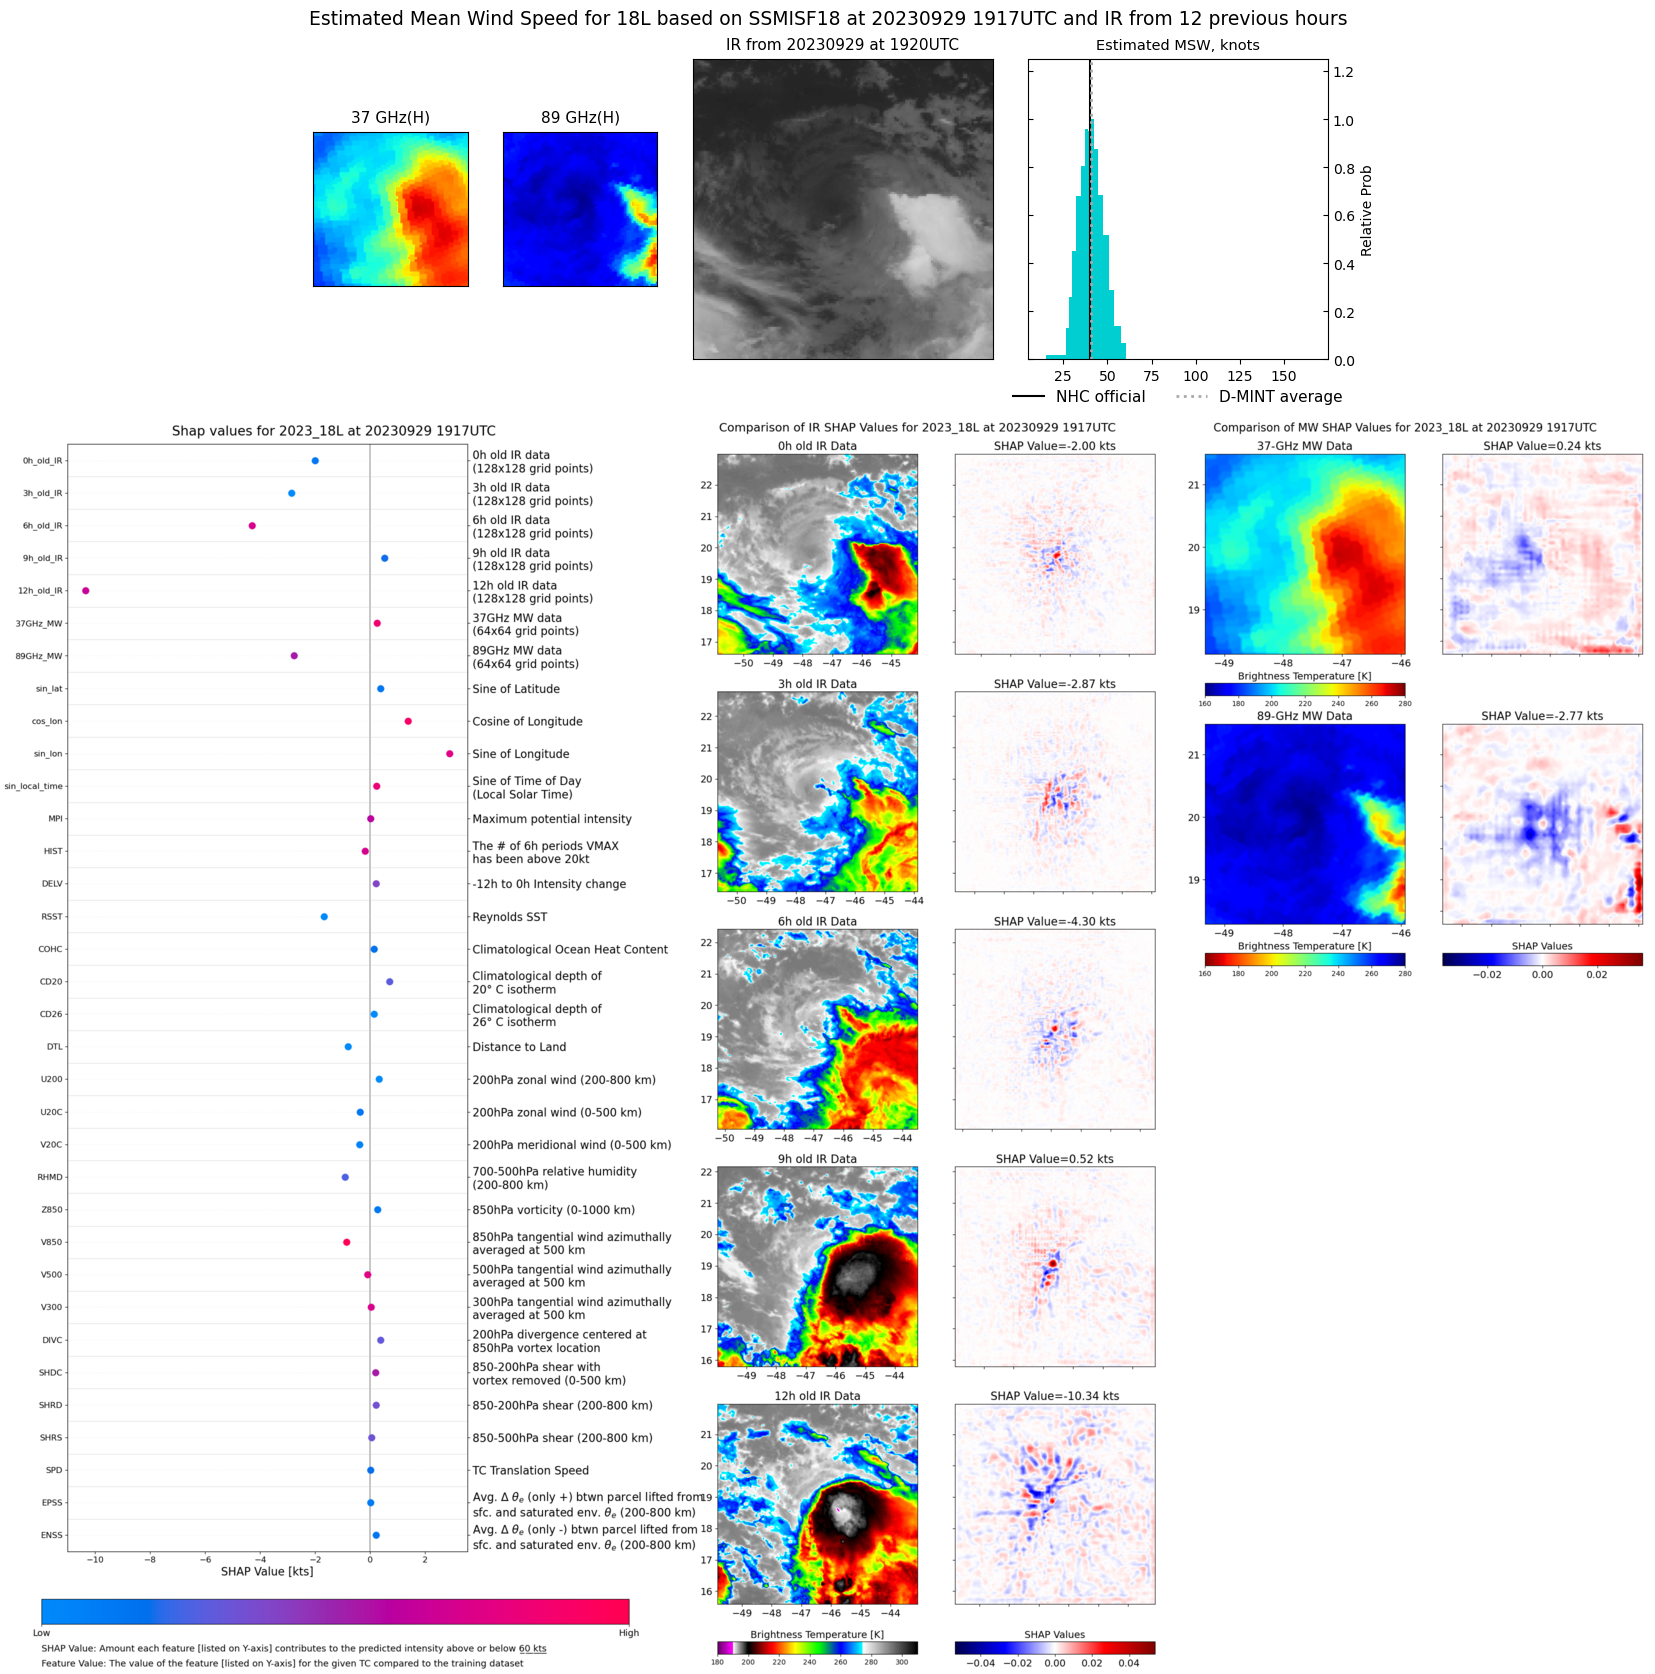 |
| 20230929 | 0939 UTC | SSMISF17 | 1000 hPa | 46 kts | 41 kts | 50 kts | 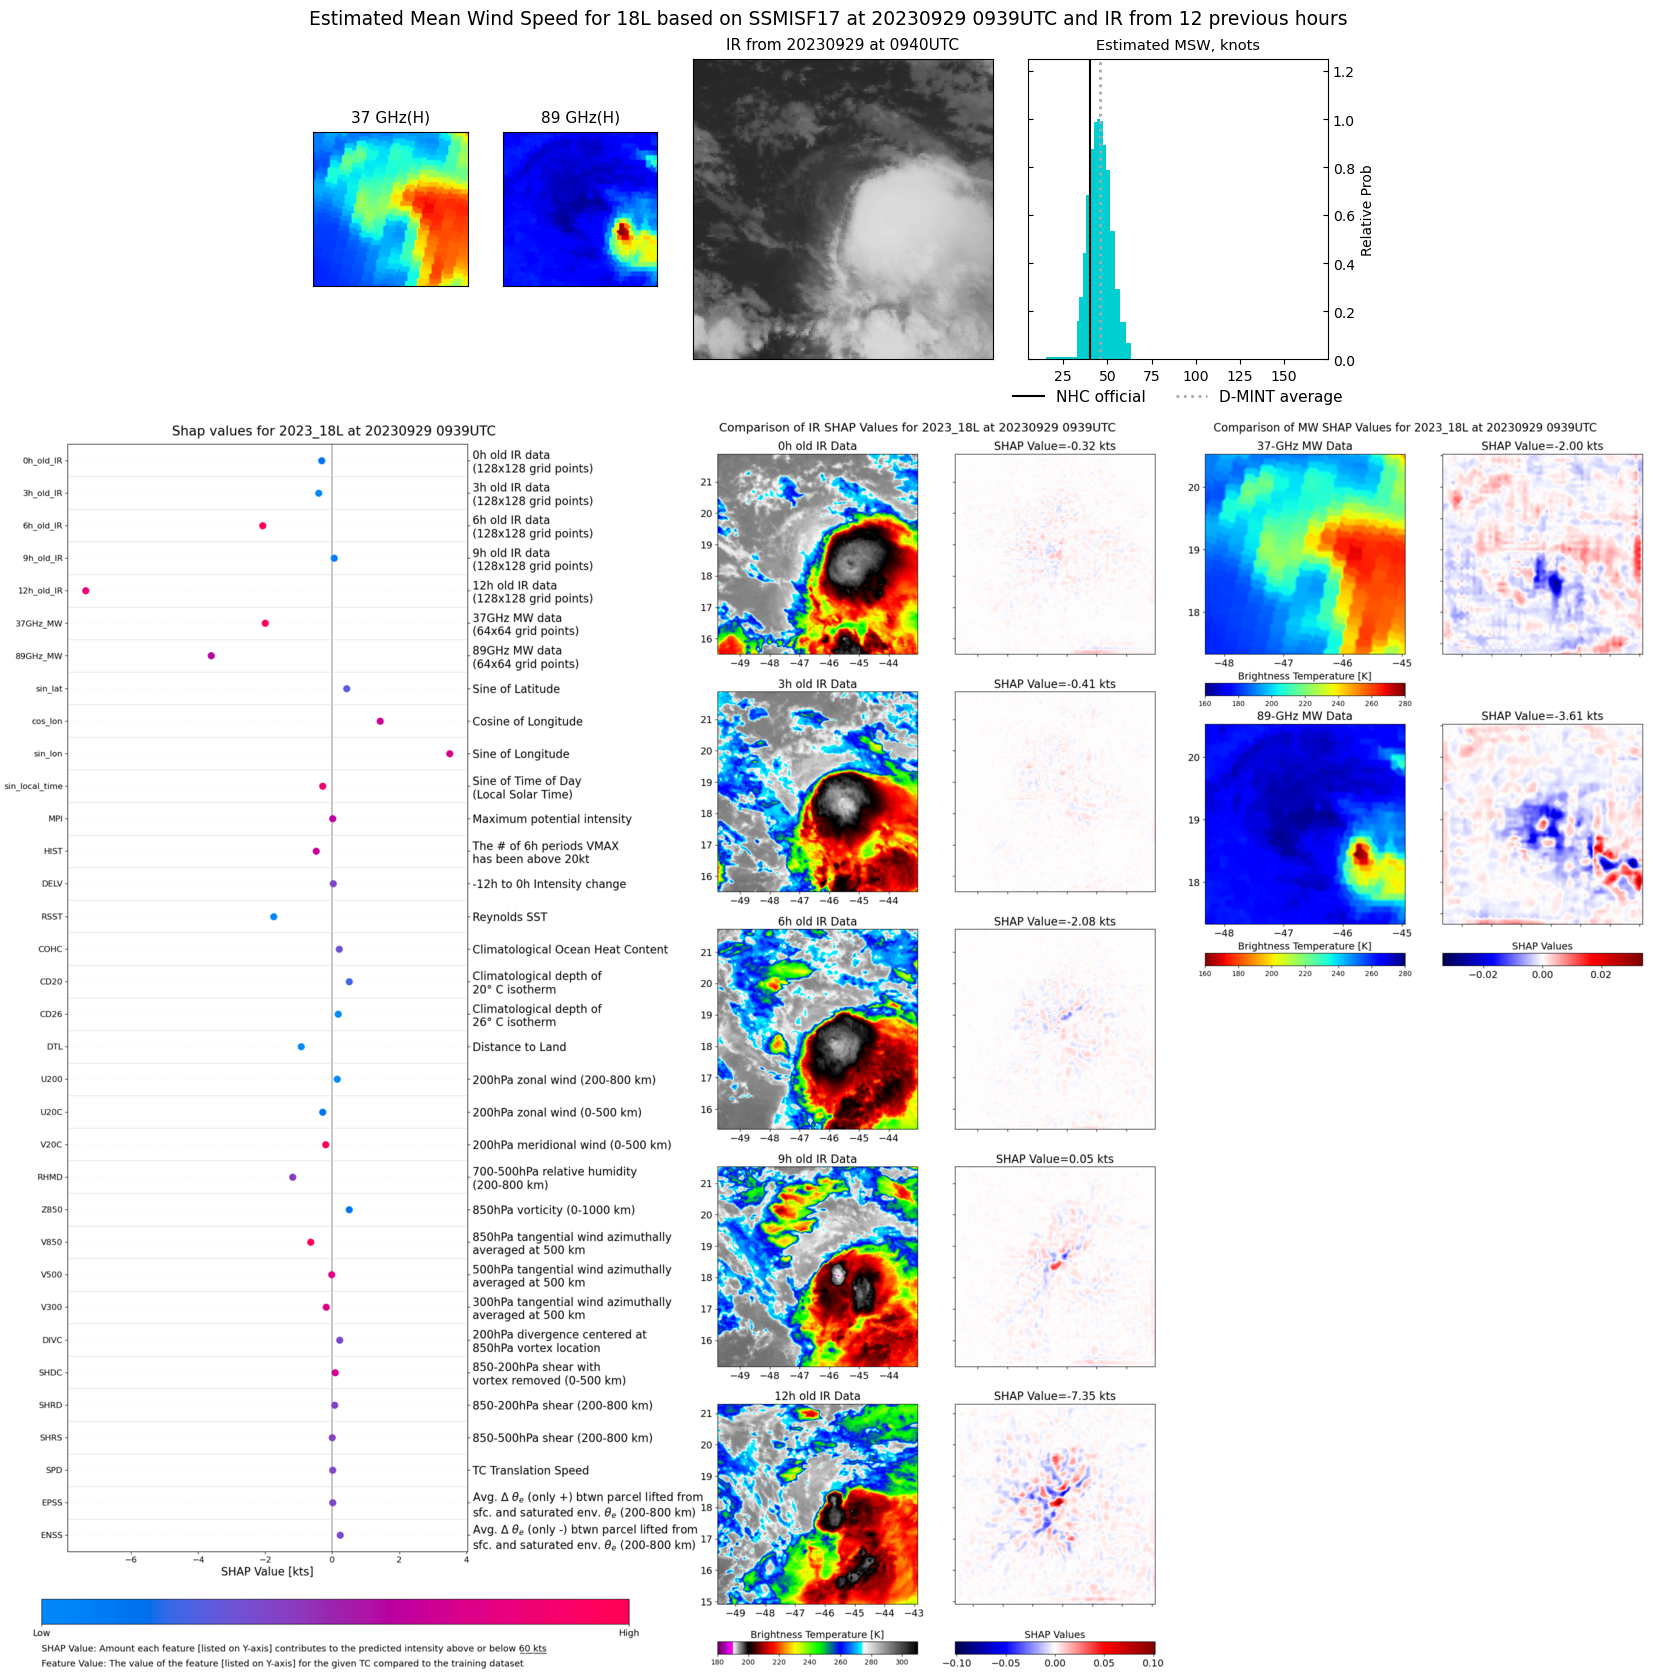 |
| 20230929 | 0430 UTC | AMSR2 | 1002 hPa | 40 kts | 36 kts | 45 kts | 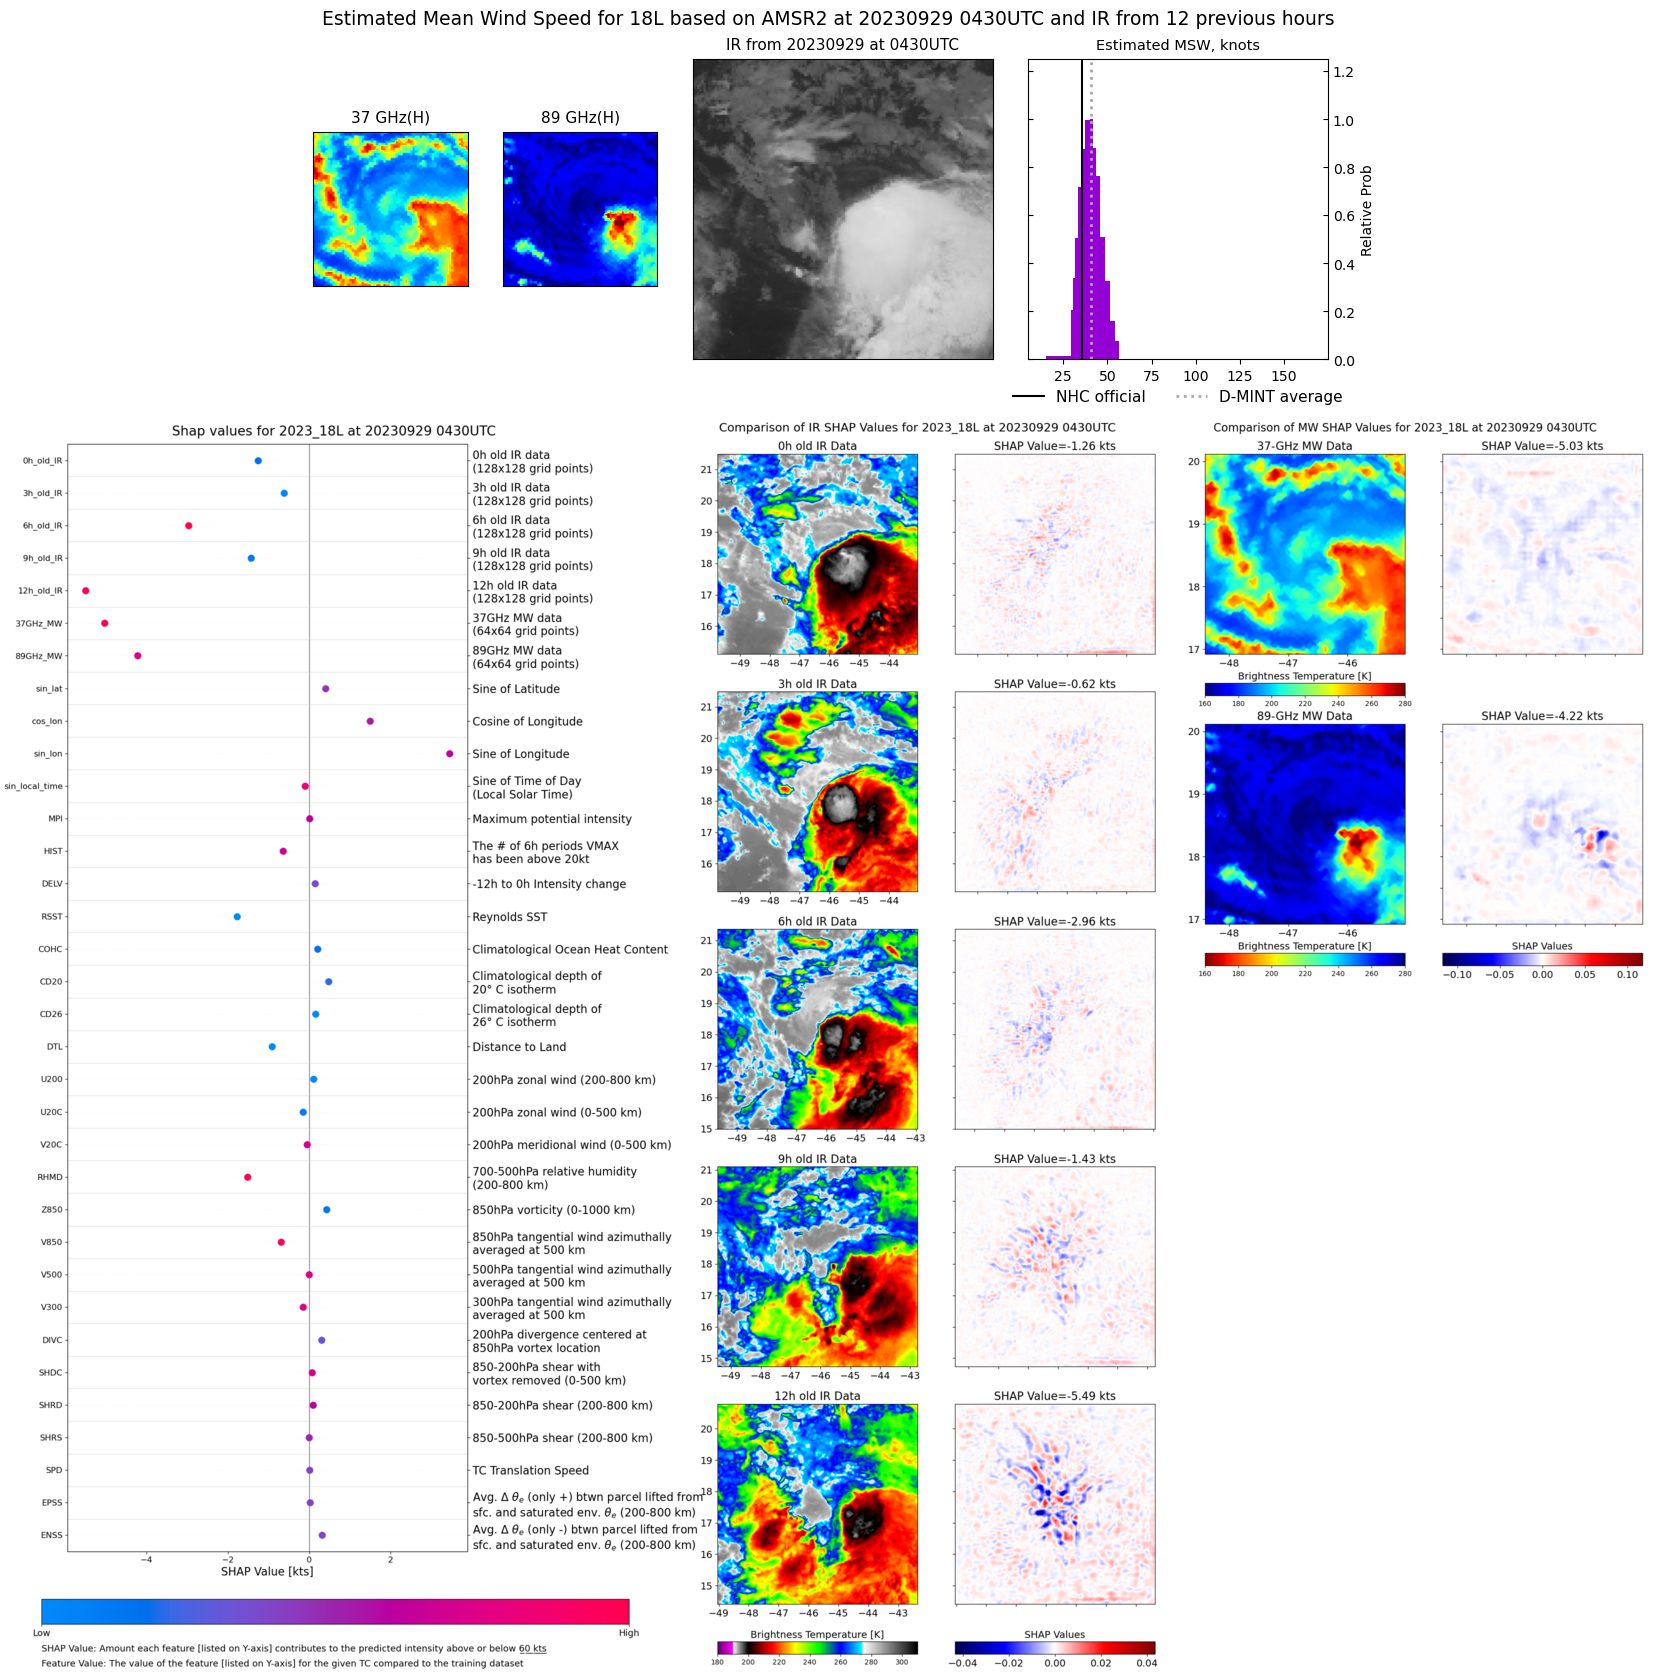 |
| 20230928 | 2105 UTC | SSMISF17 | 1000 hPa | 42 kts | 37 kts | 47 kts | 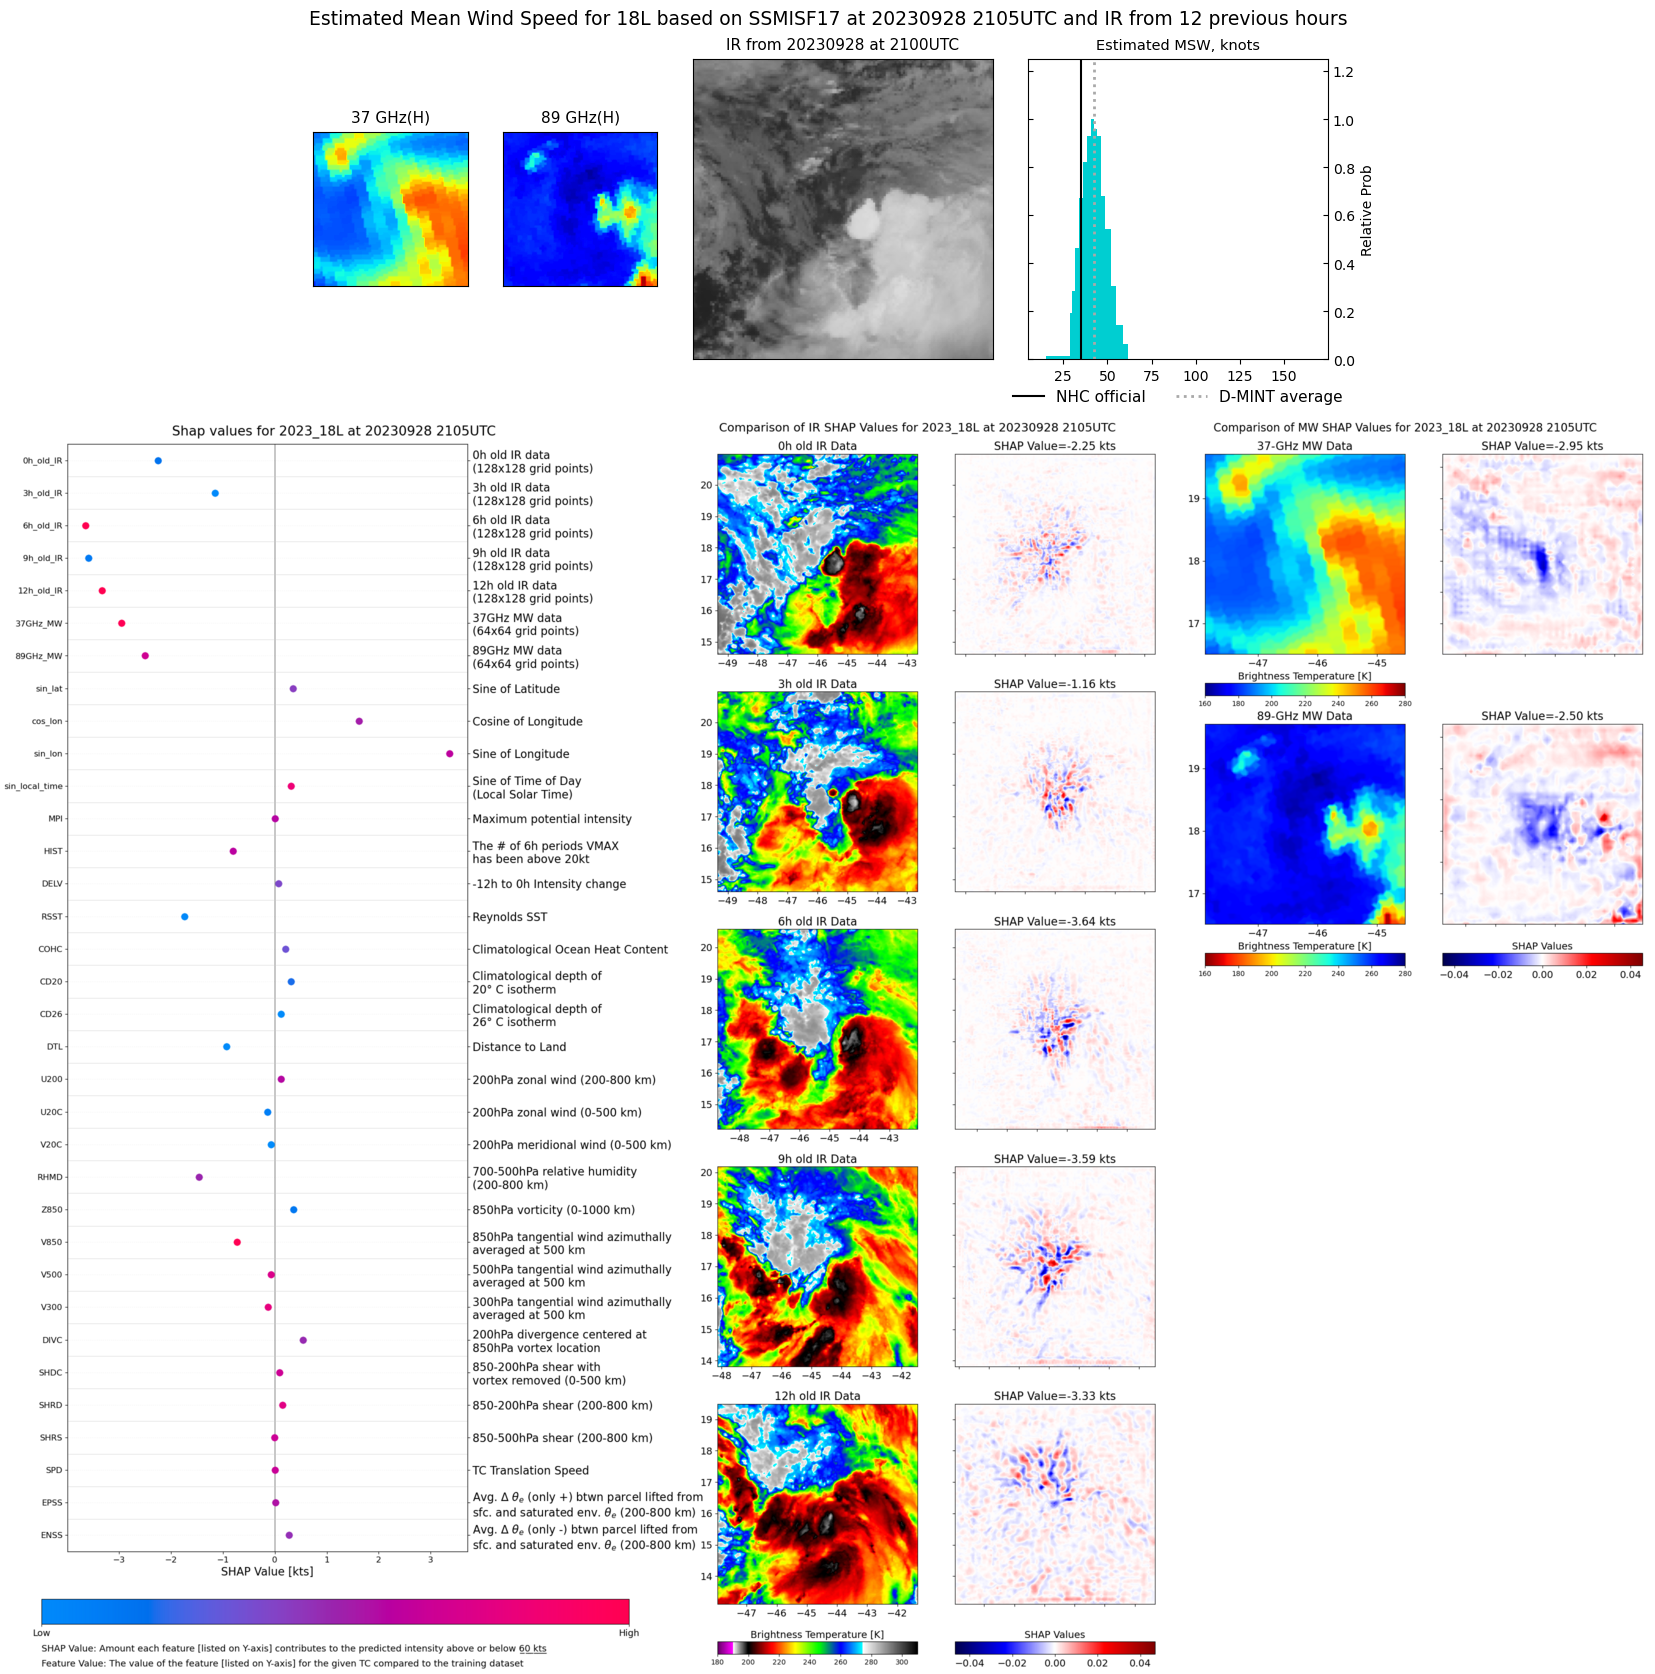 |
| 20230928 | 1618 UTC | AMSR2 | 1003 hPa | 44 kts | 40 kts | 49 kts | 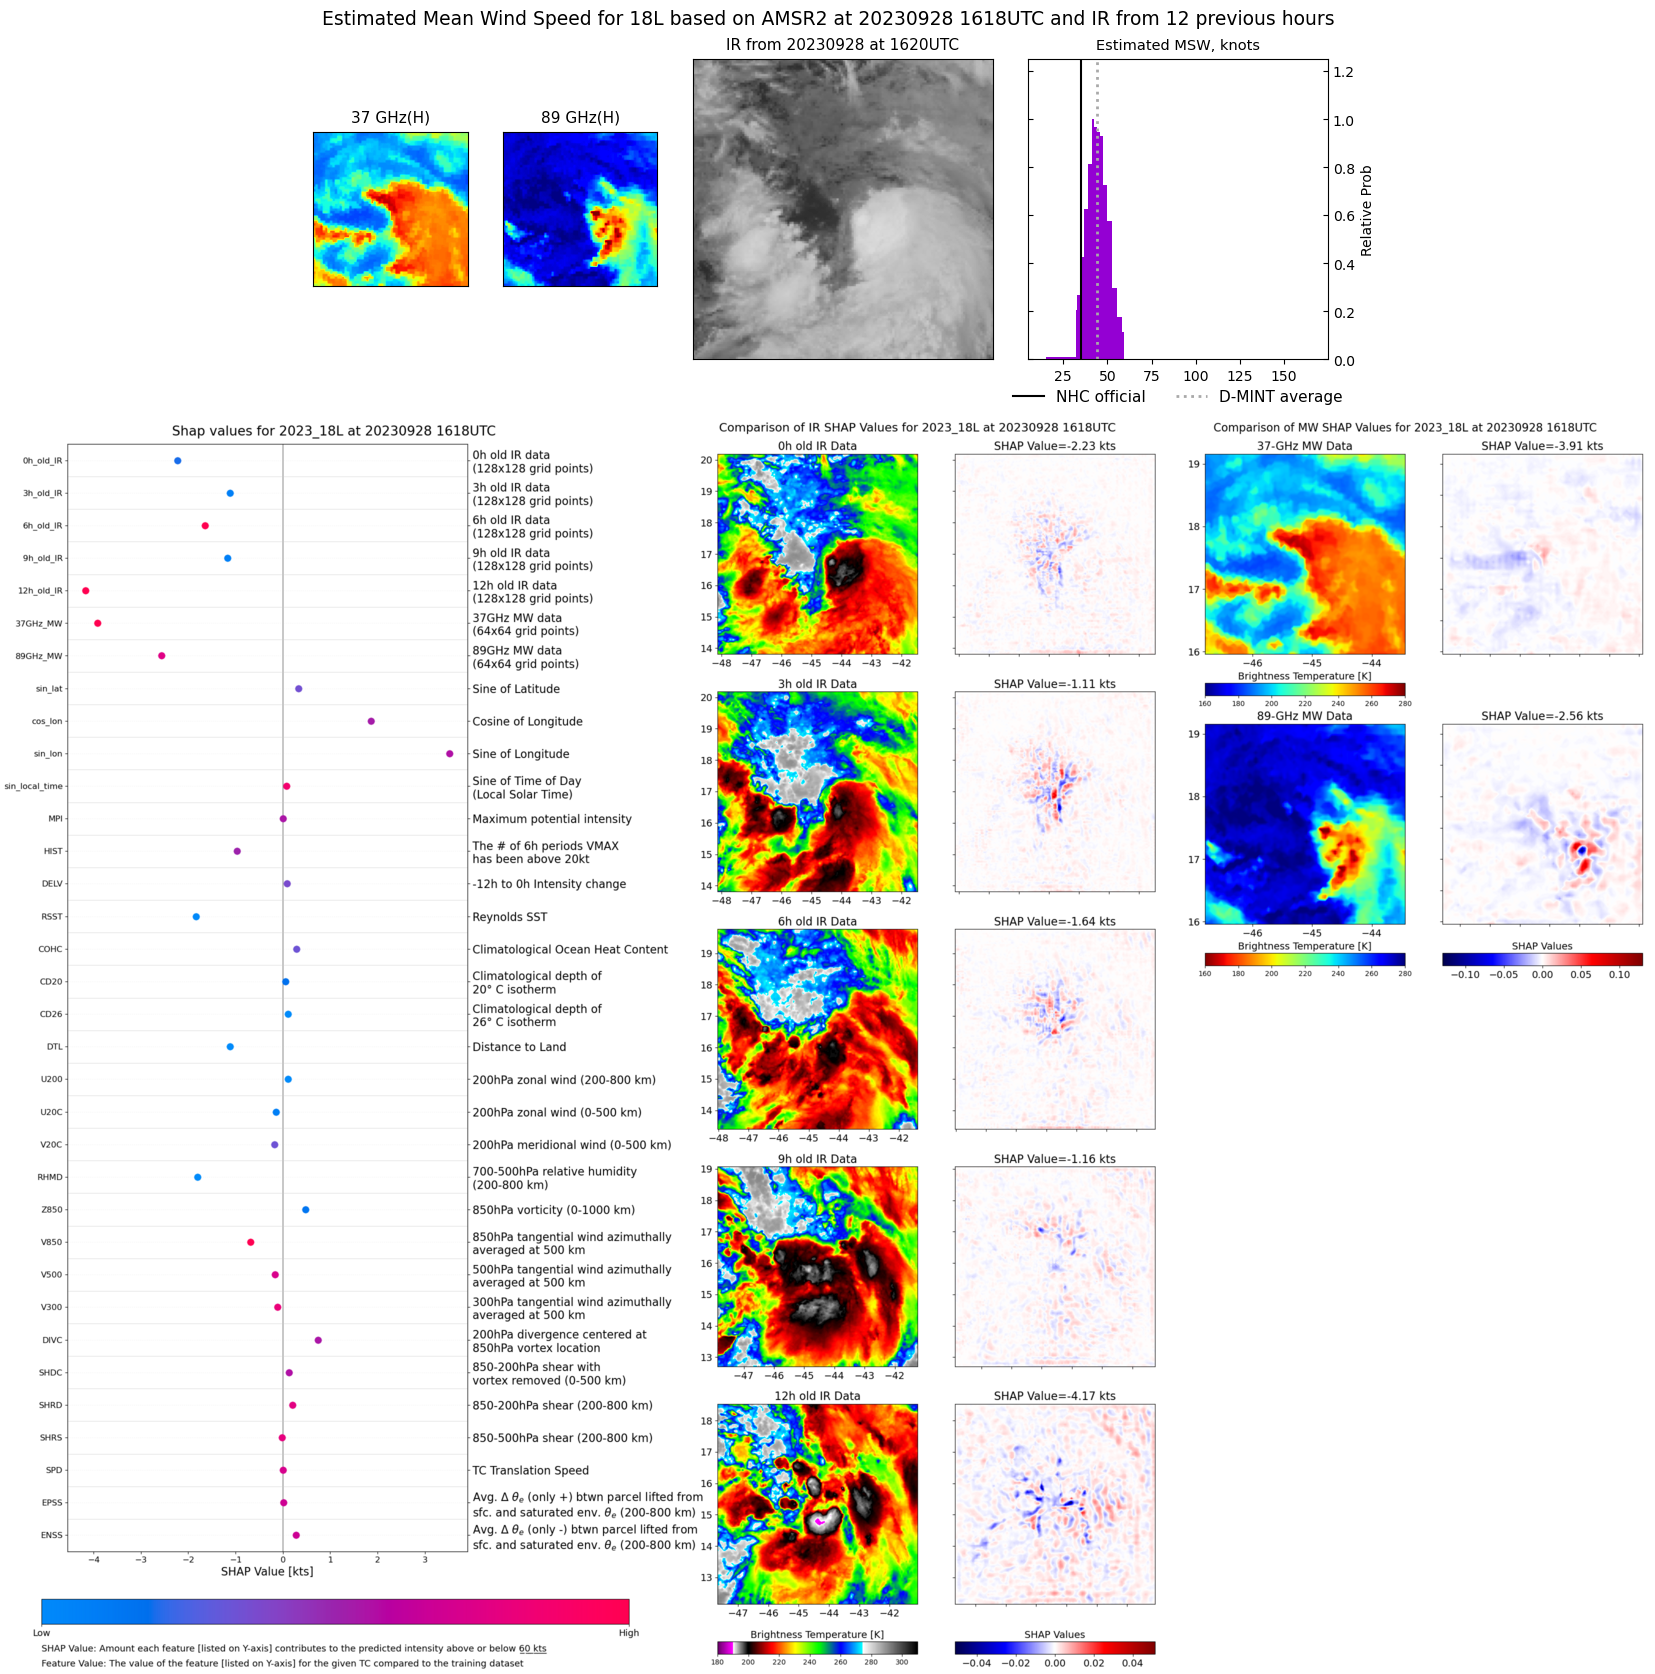 |