|
Storm: 18S
D-MINT HISTORY FILE for 2023_18S
| Date | Time | MW Sensor | MSLP | Vmax
(30th-70th percentile average) | Vmax
25th percentile | Vmax
75th percentile | Image |
| 20230413 | 2005 UTC | SSMISF18 | NaN hPa | 128 kts | 121 kts | 135 kts | 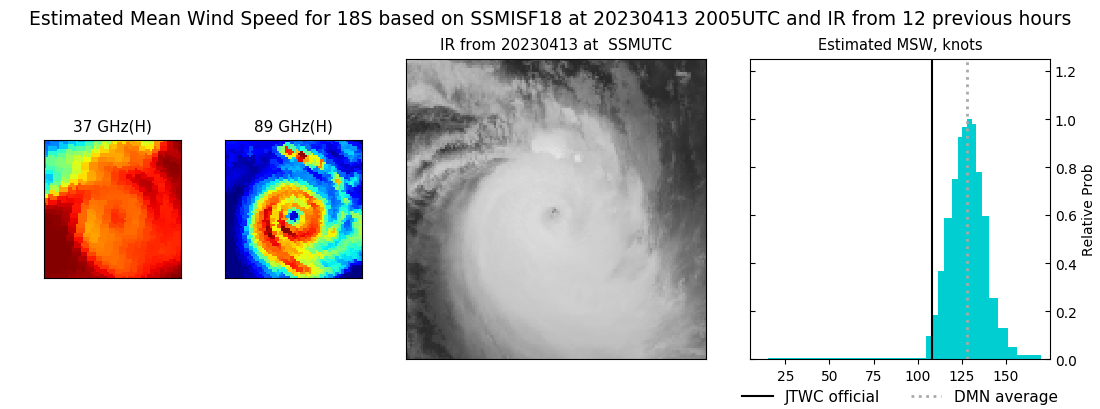 |
| 20230413 | 1812 UTC | GMI | NaN hPa | 120 kts | 112 kts | 127 kts | 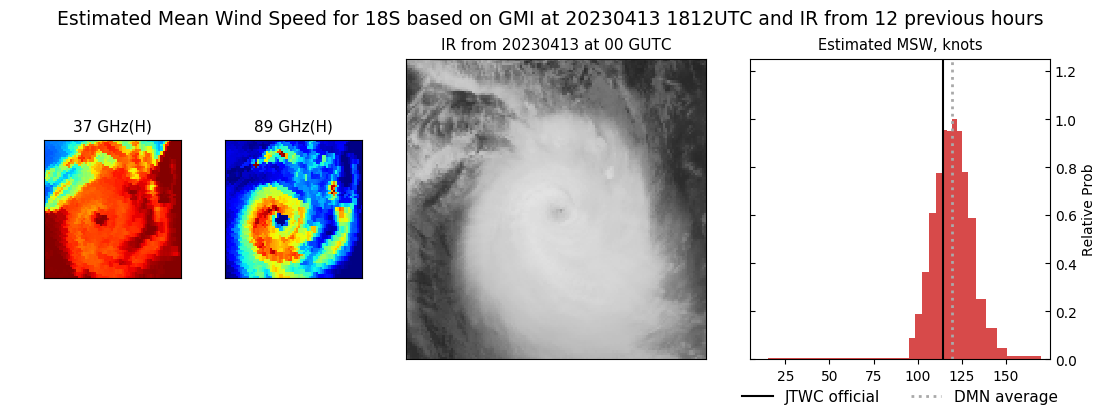 |
| 20230413 | 0527 UTC | AMSR2 | NaN hPa | 113 kts | 105 kts | 122 kts | 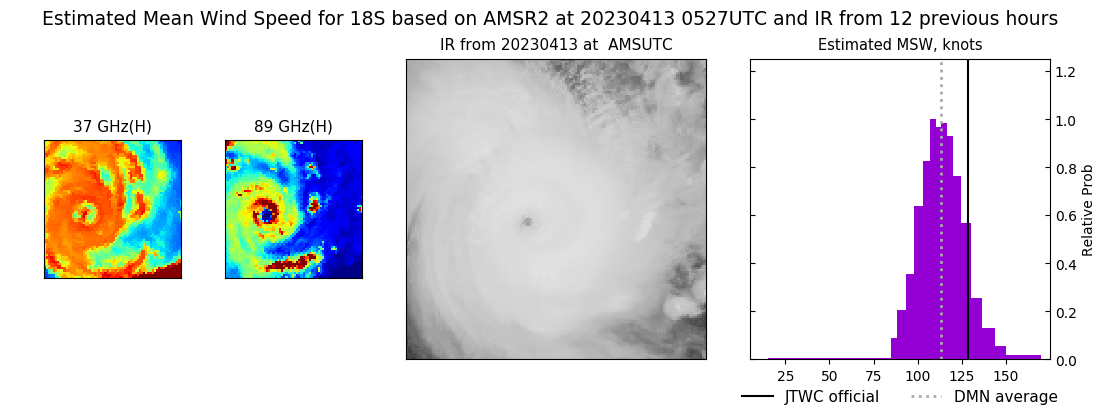 |
| 20230412 | 2018 UTC | SSMISF18 | NaN hPa | 104 kts | 95 kts | 112 kts | 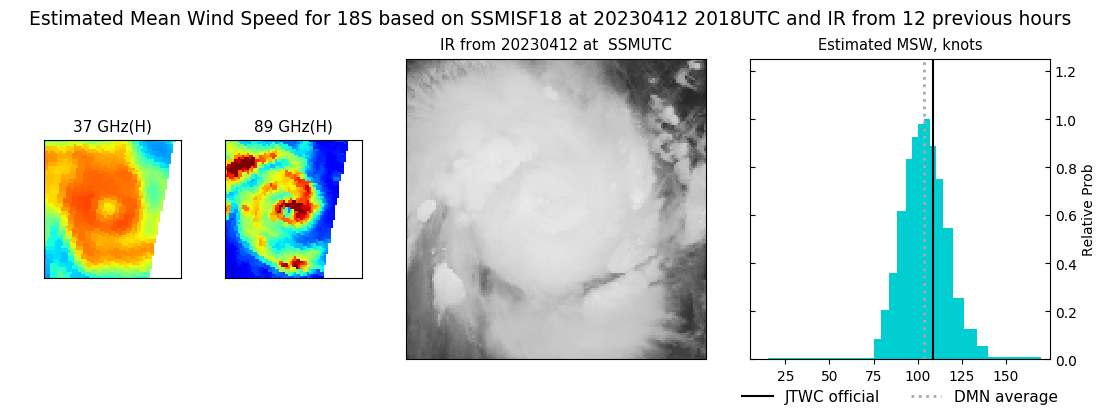 |
| 20230412 | 1715 UTC | AMSR2 | NaN hPa | 84 kts | 76 kts | 92 kts | 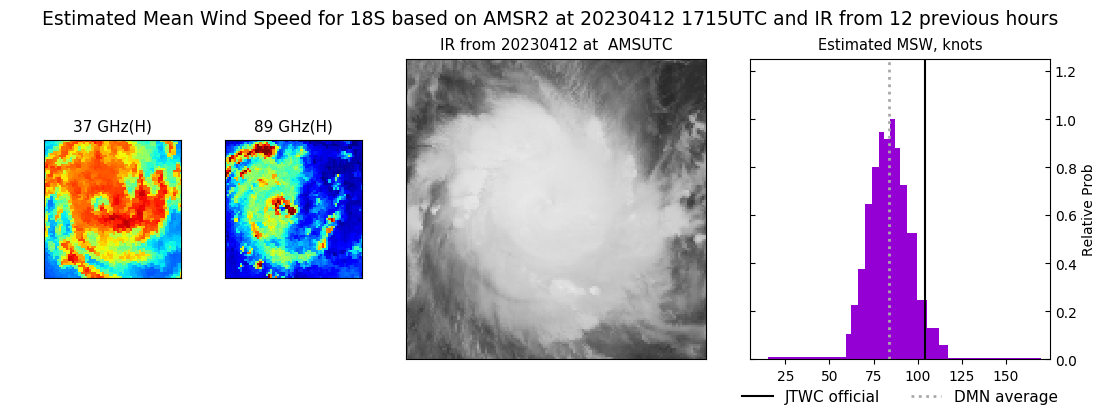 |
| 20230412 | 1022 UTC | SSMISF17 | NaN hPa | 86 kts | 78 kts | 94 kts | 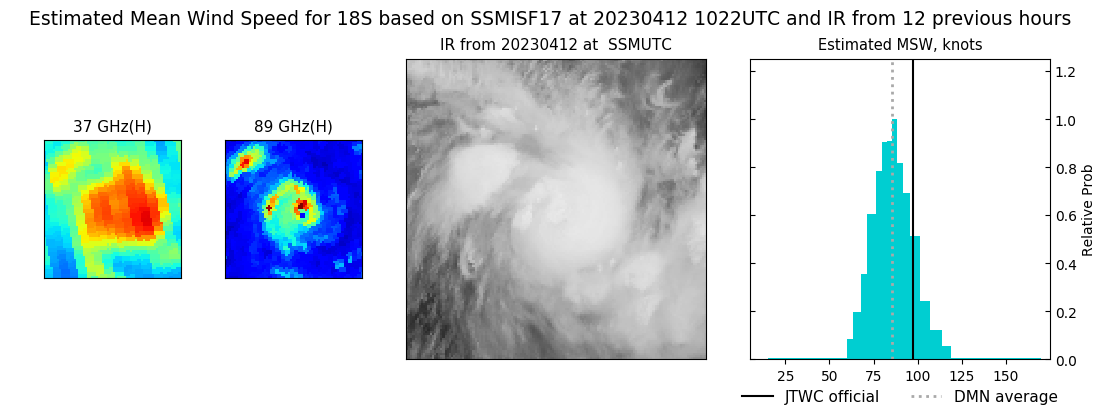 |
| 20230412 | 0745 UTC | GMI | NaN hPa | 87 kts | 80 kts | 95 kts | 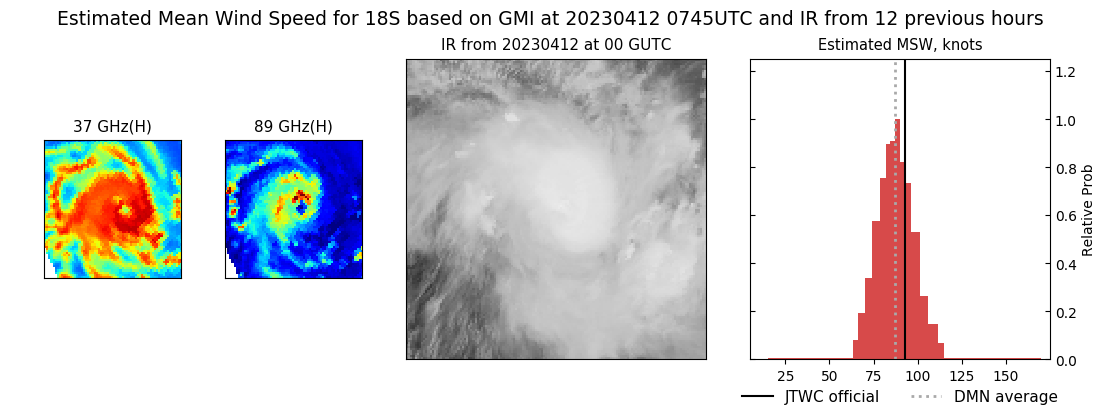 |
| 20230412 | 0742 UTC | GMI | NaN hPa | 88 kts | 80 kts | 95 kts | 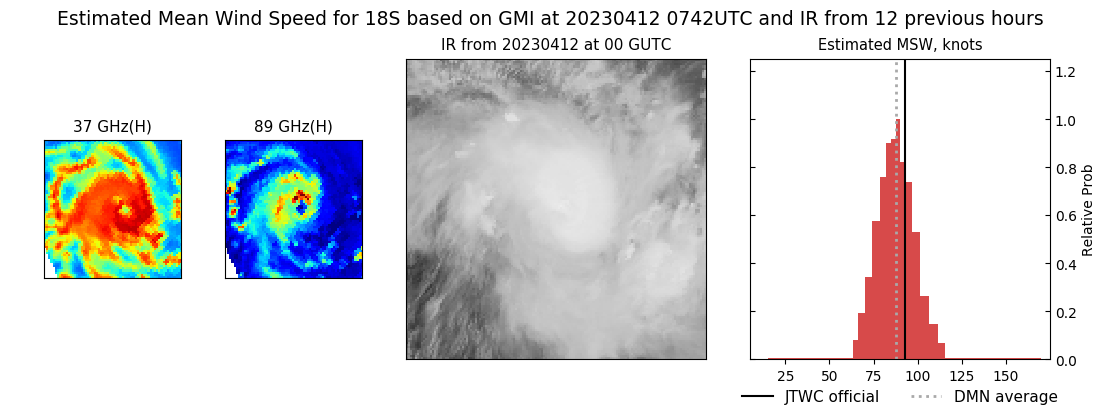 |
| 20230411 | 2147 UTC | SSMISF17 | NaN hPa | 62 kts | 56 kts | 69 kts | 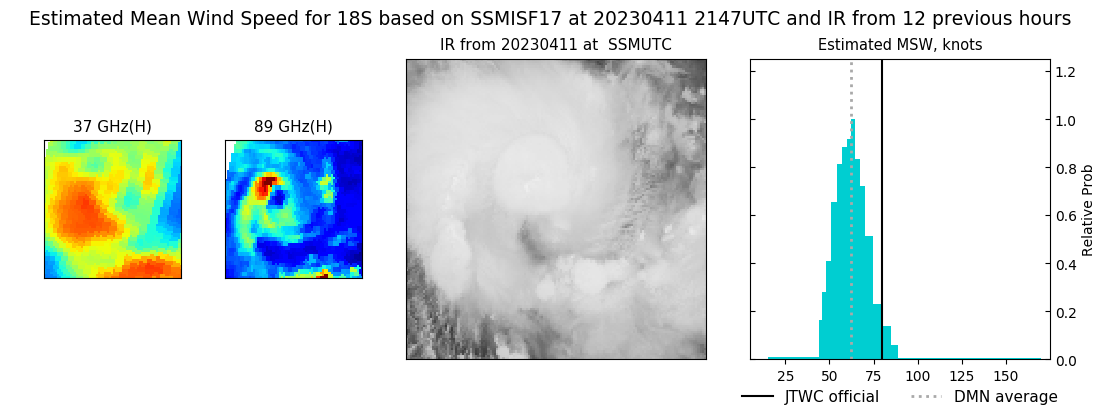 |
| 20230411 | 1035 UTC | SSMISF17 | NaN hPa | 34 kts | 30 kts | 38 kts | 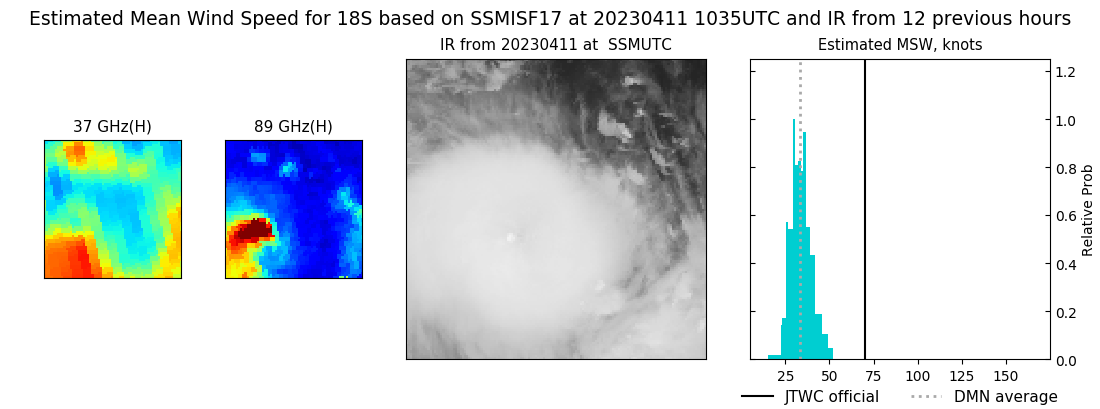 |
| 20230411 | 0738 UTC | SSMISF18 | NaN hPa | 36 kts | 33 kts | 40 kts | 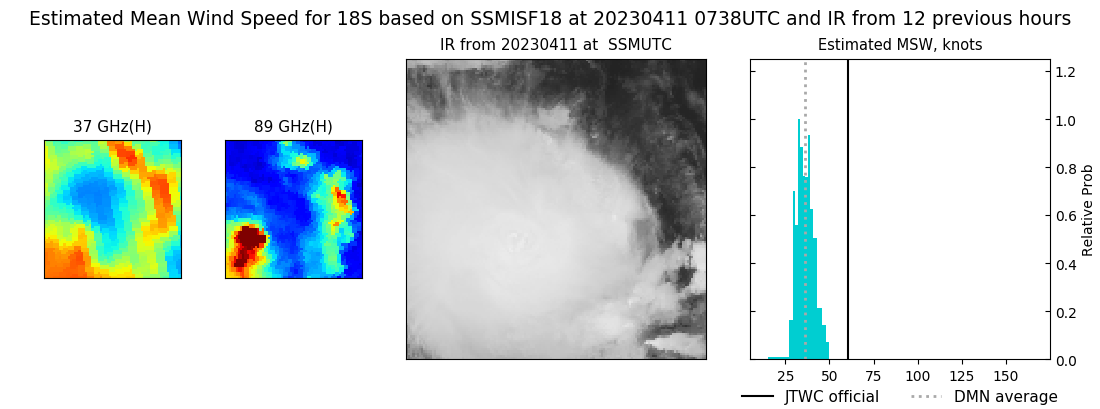 |
| 20230411 | 0540 UTC | AMSR2 | NaN hPa | 37 kts | 32 kts | 43 kts |  |
| 20230410 | 2159 UTC | SSMISF17 | NaN hPa | 35 kts | 32 kts | 39 kts | 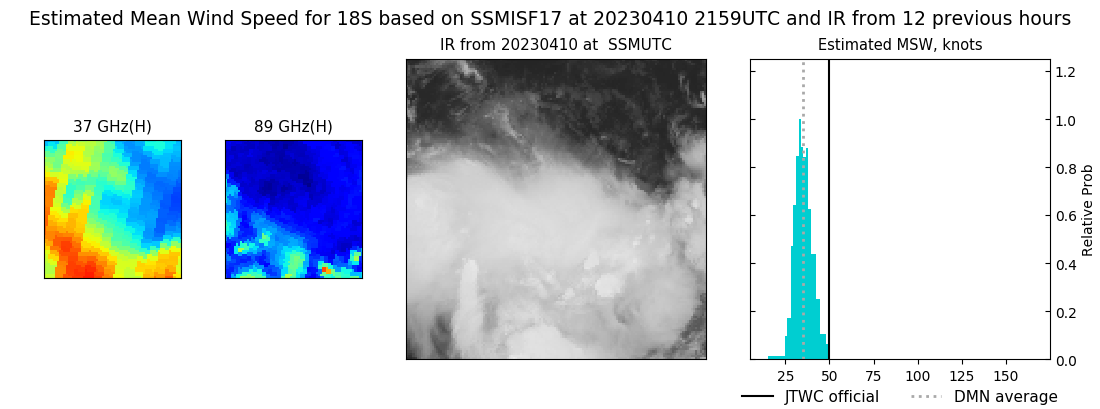 |
| 20230410 | 1917 UTC | GMI | NaN hPa | 35 kts | 31 kts | 39 kts | 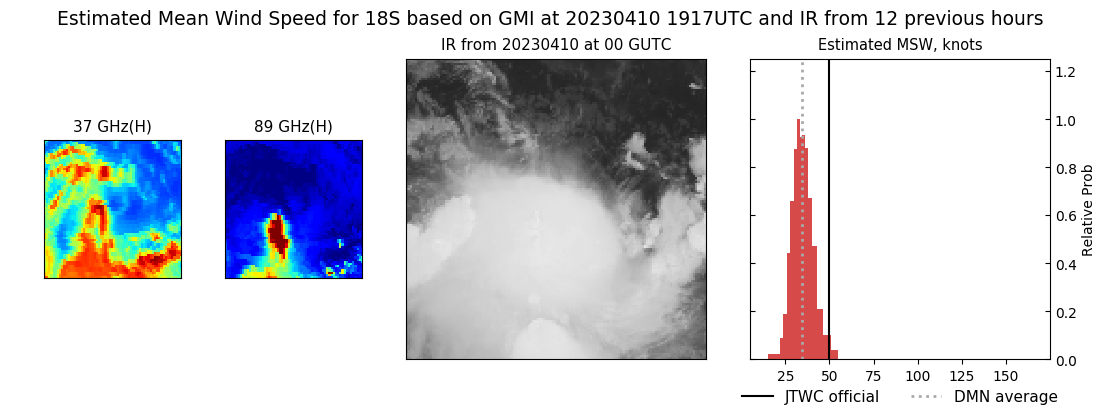 |
| 20230410 | 1726 UTC | AMSR2 | NaN hPa | 39 kts | 36 kts | 44 kts | 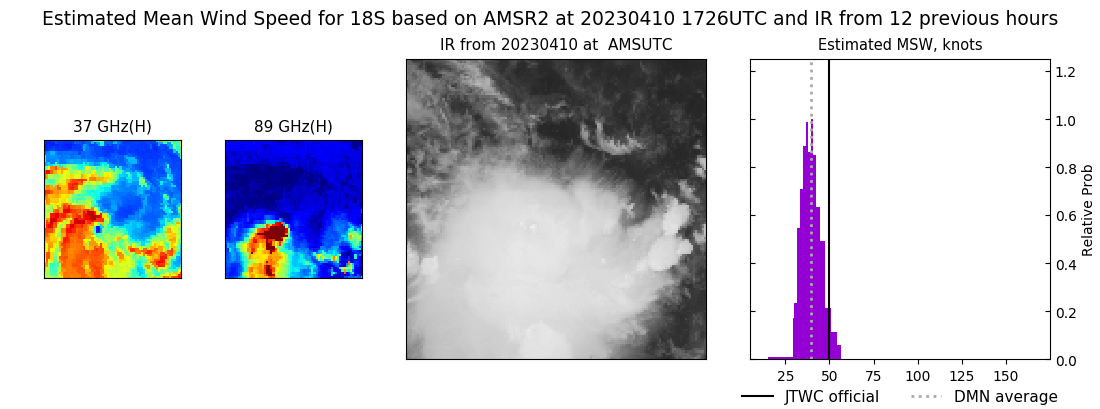 |
| 20230410 | 1050 UTC | SSMISF17 | NaN hPa | 31 kts | 27 kts | 35 kts | 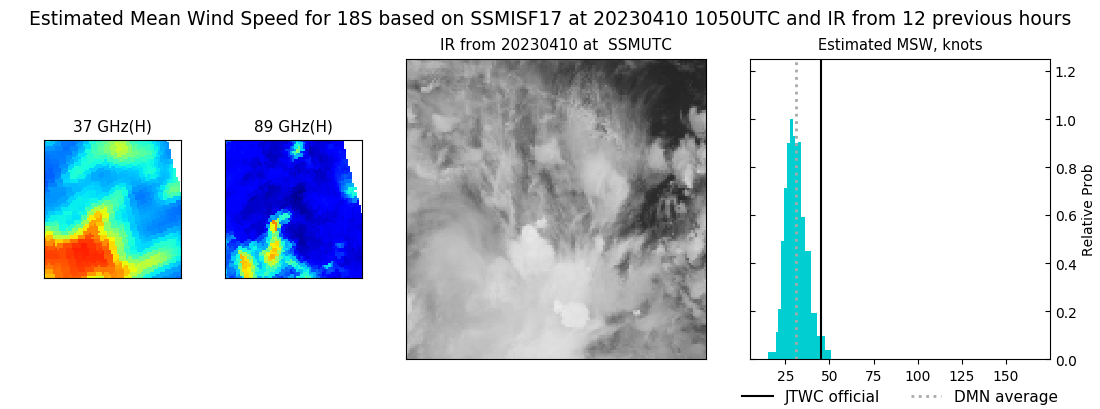 |
| 20230410 | 0751 UTC | SSMISF18 | NaN hPa | 35 kts | 32 kts | 39 kts | 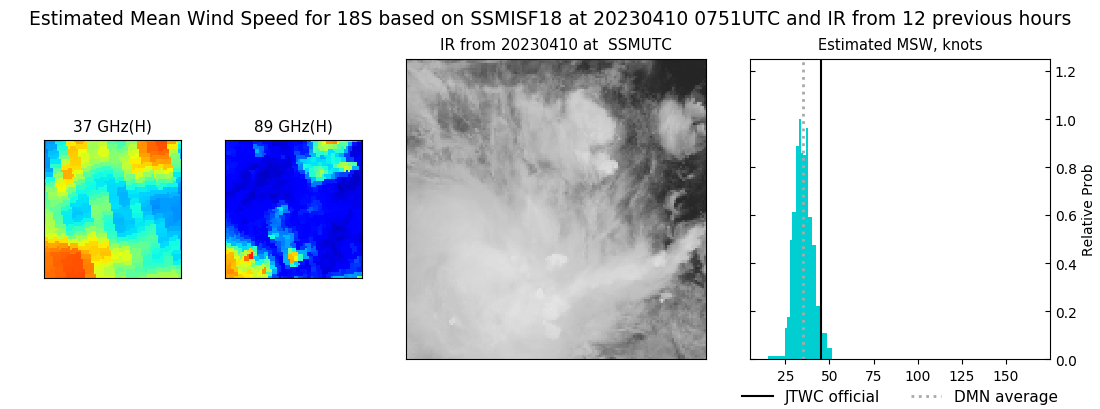 |
| 20230409 | 1644 UTC | AMSR2 | NaN hPa | 31 kts | 28 kts | 34 kts | 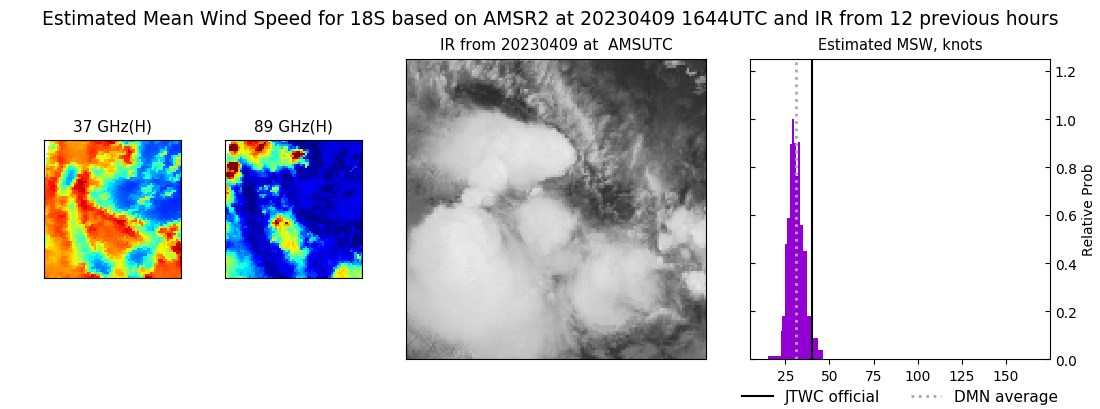 |
| 20230408 | 1932 UTC | GMI | NaN hPa | 33 kts | 30 kts | 36 kts | 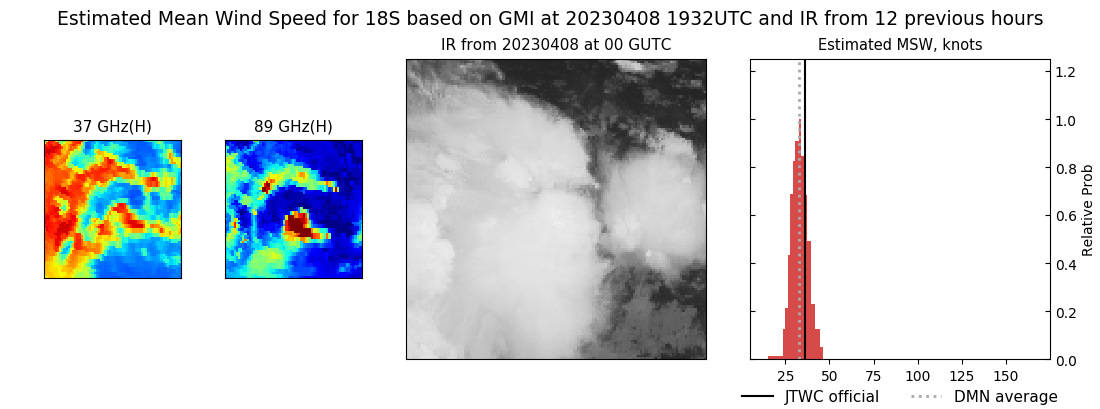 |
|
