|
||
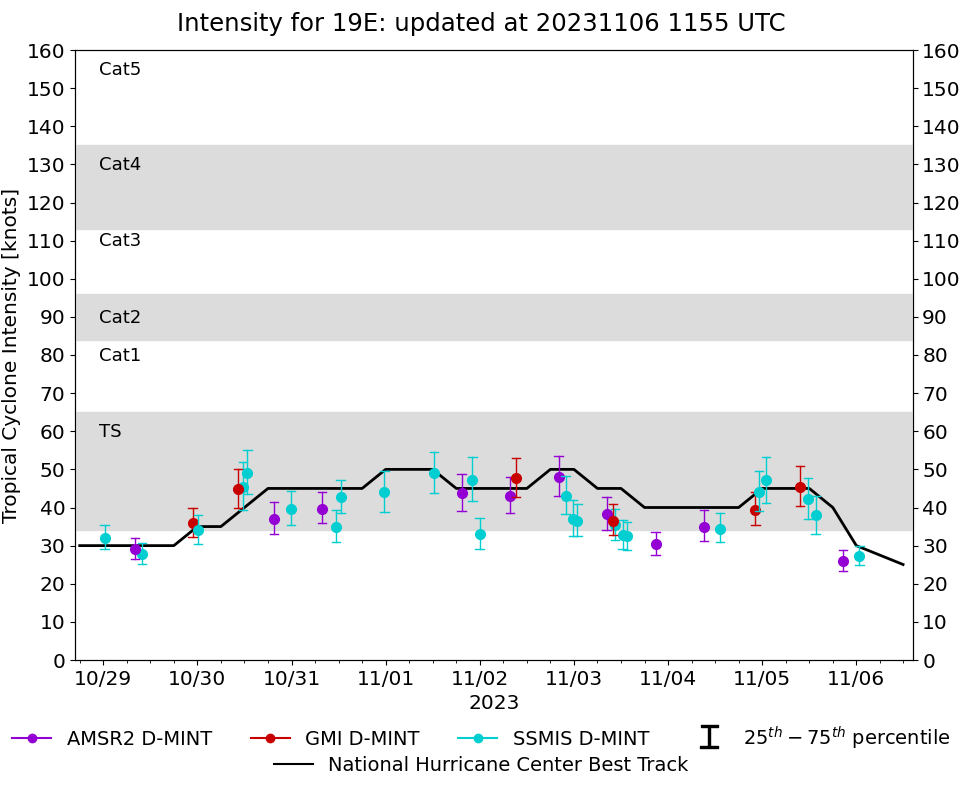 |
D-MINT HISTORY FILE for 2023_19E
| Date | Time | MW Sensor | MSLP | Vmax (30th-70th percentile average) | Vmax 25th percentile | Vmax 75th percentile | Image |
| 20231106 | 0047 UTC | SSMISF16 | 1004 hPa | 27 kts | 25 kts | 30 kts |  |
| 20231105 | 2038 UTC | AMSR2 | 1007 hPa | 26 kts | 23 kts | 29 kts |  |
| 20231105 | 1338 UTC | SSMISF16 | 1003 hPa | 38 kts | 33 kts | 43 kts |  |
| 20231105 | 1145 UTC | SSMISF18 | 999 hPa | 42 kts | 37 kts | 48 kts |  |
| 20231105 | 0942 UTC | GMI | 1002 hPa | 45 kts | 40 kts | 51 kts |  |
| 20231105 | 0100 UTC | SSMISF16 | 995 hPa | 47 kts | 41 kts | 53 kts |  |
| 20231104 | 2307 UTC | SSMISF18 | 999 hPa | 44 kts | 39 kts | 50 kts |  |
| 20231104 | 2216 UTC | GMI | 1000 hPa | 39 kts | 35 kts | 44 kts |  |
| 20231104 | 1319 UTC | SSMISF17 | 1002 hPa | 34 kts | 31 kts | 38 kts |  |
| 20231104 | 0905 UTC | AMSR2 | 1004 hPa | 35 kts | 31 kts | 39 kts |  |
| 20231103 | 2049 UTC | AMSR2 | 1004 hPa | 30 kts | 28 kts | 33 kts |  |
| 20231103 | 1333 UTC | SSMISF17 | 1003 hPa | 32 kts | 29 kts | 36 kts |  |
| 20231103 | 1223 UTC | SSMISF16 | 1004 hPa | 33 kts | 29 kts | 37 kts |  |
| 20231103 | 1030 UTC | SSMISF18 | 1002 hPa | 35 kts | 32 kts | 40 kts |  |
| 20231103 | 0956 UTC | GMI | 1003 hPa | 37 kts | 33 kts | 41 kts |  |
| 20231103 | 0821 UTC | AMSR2 | 1003 hPa | 38 kts | 34 kts | 43 kts |  |
| 20231103 | 0054 UTC | SSMISF17 | 1001 hPa | 37 kts | 33 kts | 41 kts |  |
| 20231102 | 2345 UTC | SSMISF16 | 1001 hPa | 37 kts | 32 kts | 42 kts |  |
| 20231102 | 2153 UTC | SSMISF18 | 1000 hPa | 43 kts | 38 kts | 48 kts |  |
| 20231102 | 2006 UTC | AMSR2 | 1001 hPa | 48 kts | 43 kts | 54 kts |  |
| 20231102 | 0911 UTC | GMI | 998 hPa | 48 kts | 43 kts | 53 kts |  |
| 20231102 | 0738 UTC | AMSR2 | 1001 hPa | 43 kts | 38 kts | 48 kts |  |
| 20231101 | 2358 UTC | SSMISF16 | 1001 hPa | 33 kts | 29 kts | 37 kts |  |
| 20231101 | 2206 UTC | SSMISF18 | 998 hPa | 47 kts | 42 kts | 53 kts |  |
| 20231101 | 1923 UTC | AMSR2 | 998 hPa | 44 kts | 39 kts | 49 kts |  |
| 20231101 | 1218 UTC | SSMISF17 | 996 hPa | 49 kts | 44 kts | 55 kts |  |
| 20231031 | 2342 UTC | SSMISF17 | 998 hPa | 44 kts | 39 kts | 50 kts |  |
| 20231031 | 1232 UTC | SSMISF17 | 999 hPa | 43 kts | 38 kts | 47 kts |  |
| 20231031 | 1121 UTC | SSMISF16 | 1001 hPa | 35 kts | 31 kts | 39 kts |  |
| 20231031 | 0750 UTC | AMSR2 | 999 hPa | 40 kts | 36 kts | 44 kts |  |
| 20231030 | 2355 UTC | SSMISF17 | 1001 hPa | 40 kts | 35 kts | 44 kts |  |
| 20231030 | 1934 UTC | AMSR2 | 1001 hPa | 37 kts | 33 kts | 41 kts |  |
| 20231030 | 1245 UTC | SSMISF17 | 998 hPa | 49 kts | 44 kts | 55 kts |  |
| 20231030 | 1135 UTC | SSMISF16 | 997 hPa | 45 kts | 39 kts | 52 kts |  |
| 20231030 | 1017 UTC | GMI | 999 hPa | 45 kts | 40 kts | 50 kts |  |
| 20231030 | 0008 UTC | SSMISF17 | 1002 hPa | 34 kts | 30 kts | 38 kts |  |
| 20231029 | 2247 UTC | GMI | 1000 hPa | 36 kts | 32 kts | 40 kts |  |
| 20231029 | 0955 UTC | SSMISF18 | 1004 hPa | 28 kts | 25 kts | 31 kts |  |
| 20231029 | 0802 UTC | AMSR2 | 1004 hPa | 29 kts | 26 kts | 32 kts |  |
| 20231029 | 0022 UTC | SSMISF17 | 1003 hPa | 32 kts | 29 kts | 35 kts |  |