|
||

 |
D-MINT HISTORY FILE for 2024_02L
| Date | Time | MW Sensor | MSLP | Vmax (30th-70th percentile average) | Vmax 25th percentile | Vmax 75th percentile | Image |
| 20240710 | UTC | 20240710 | 1007 hPa | 32 kts | 28 kts | 37 kts | |
| 20240710 | 2302 UTC | SSMISF17 | 1004 hPa | 38 kts | 33 kts | 43 kts | 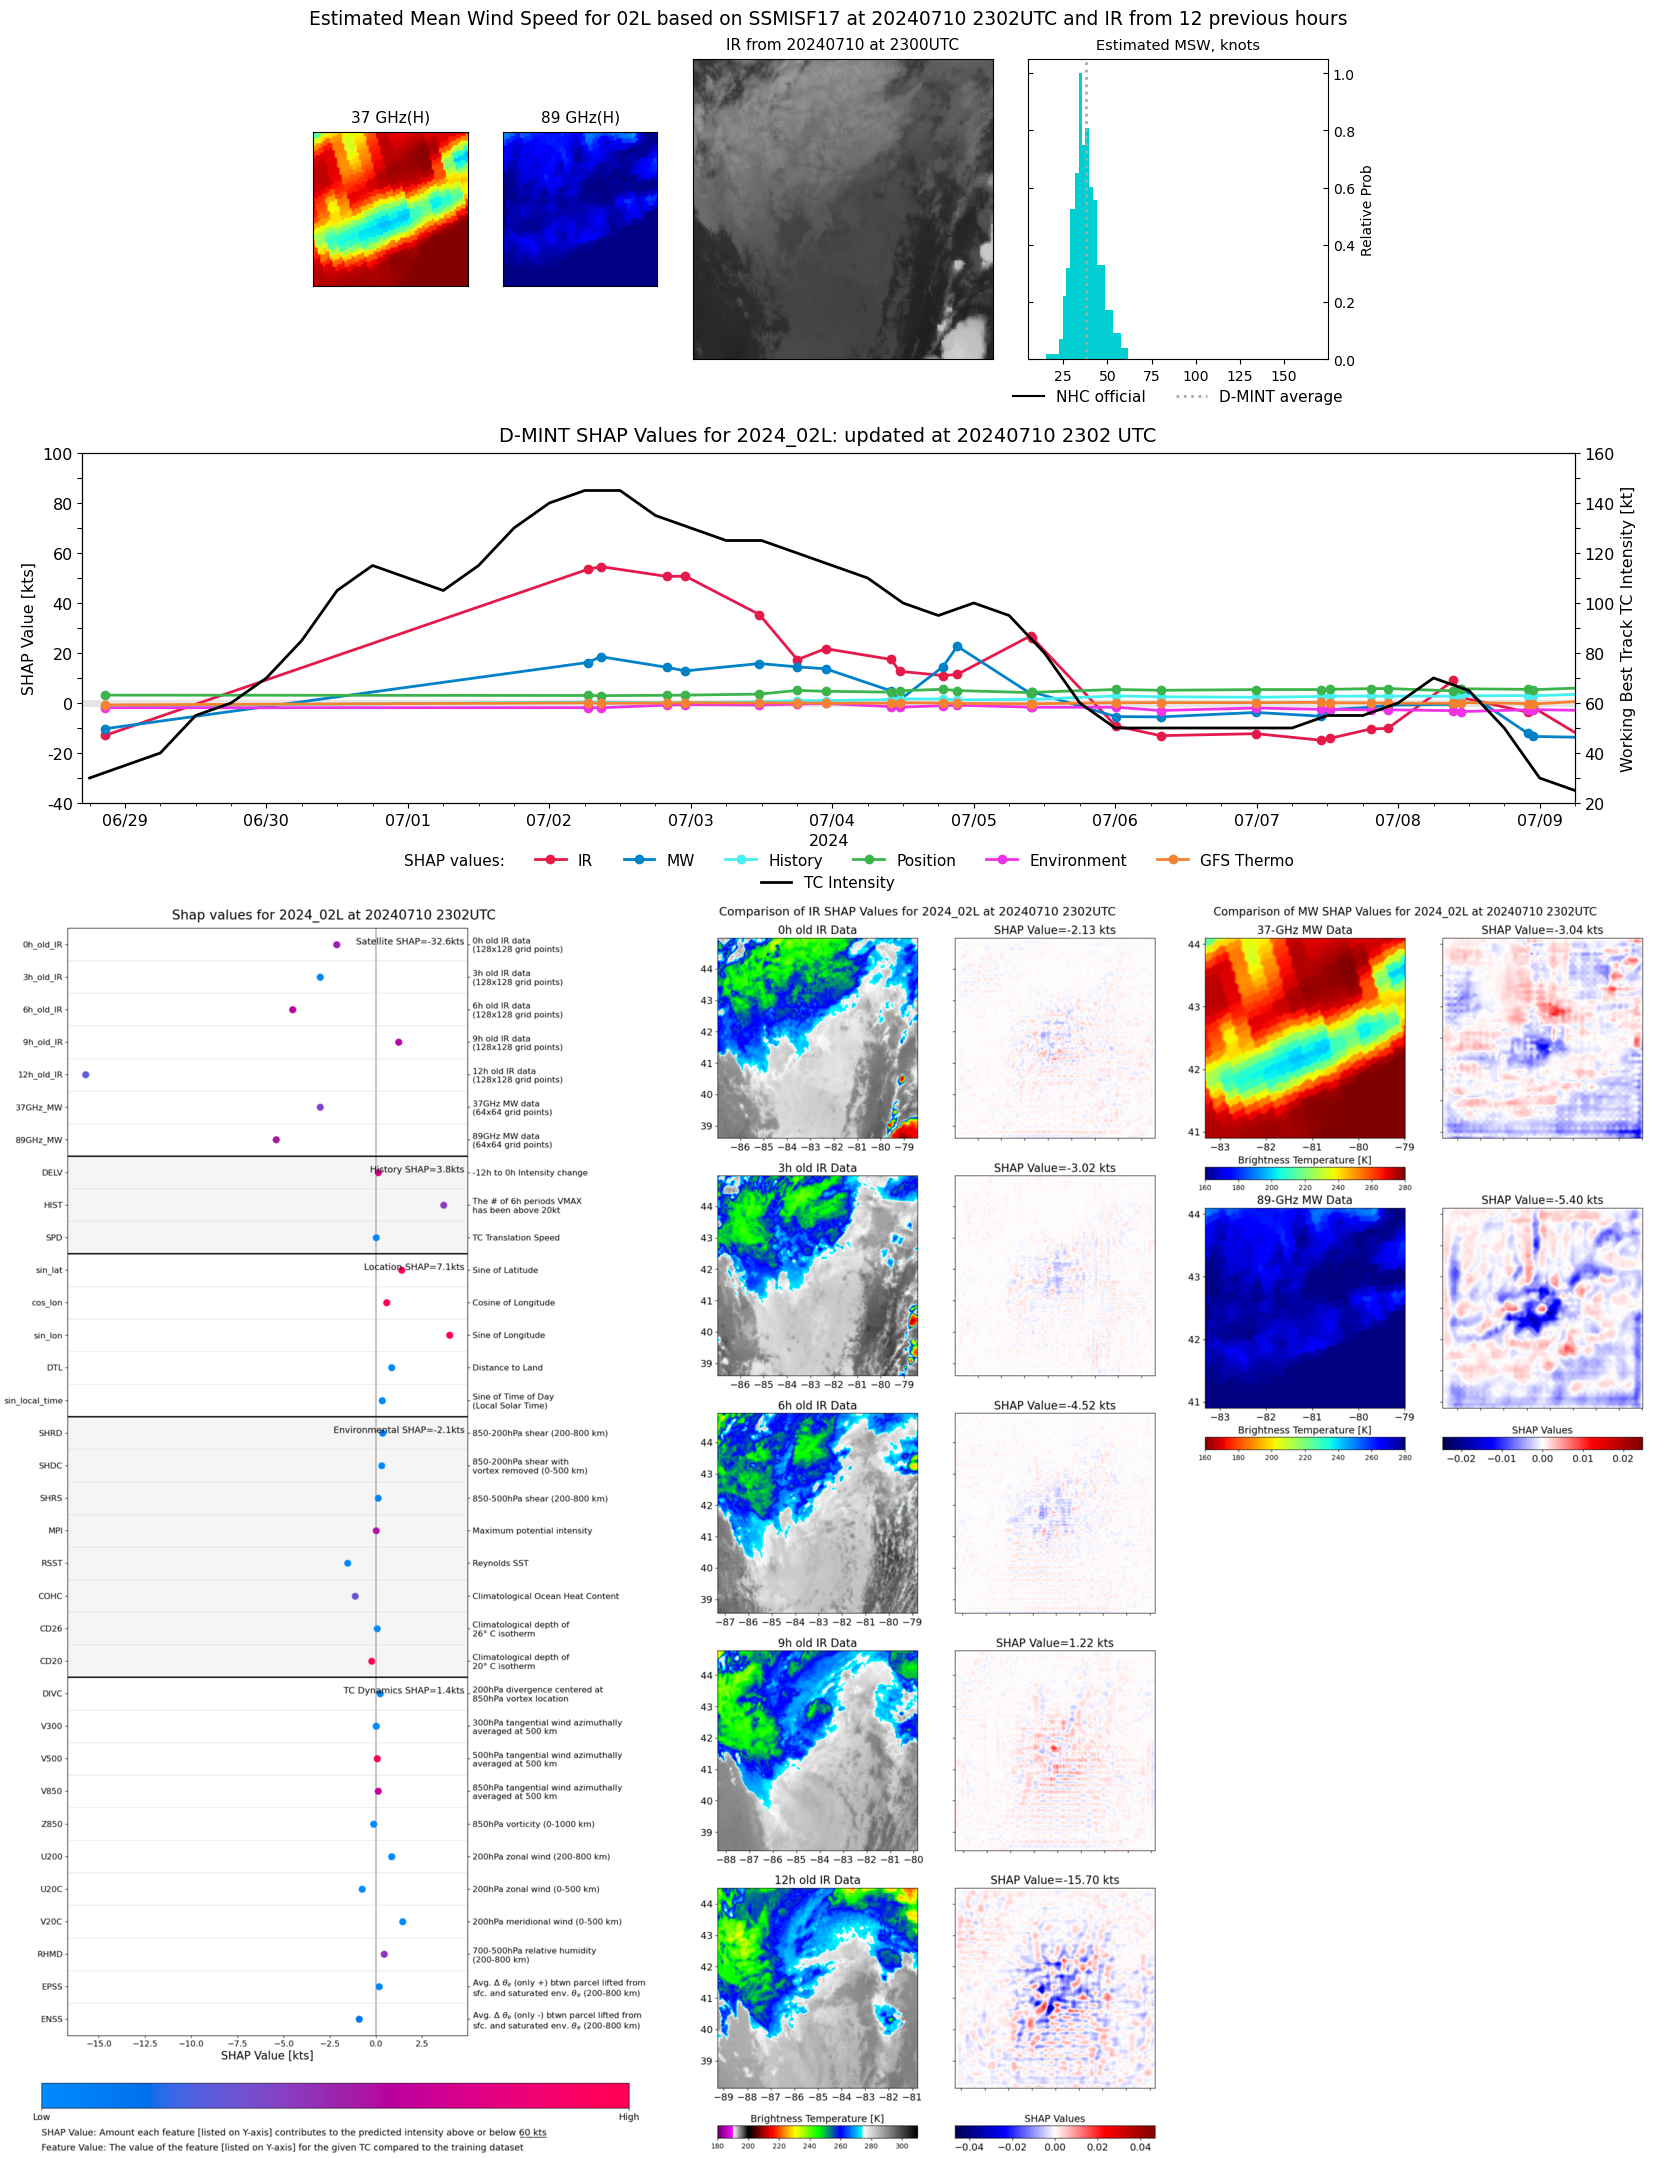 |
| 20240710 | UTC | 20240710 | 1007 hPa | 32 kts | 28 kts | 37 kts | |
| 20240710 | 1012 UTC | SSMISF18 | 1007 hPa | 32 kts | 28 kts | 37 kts | 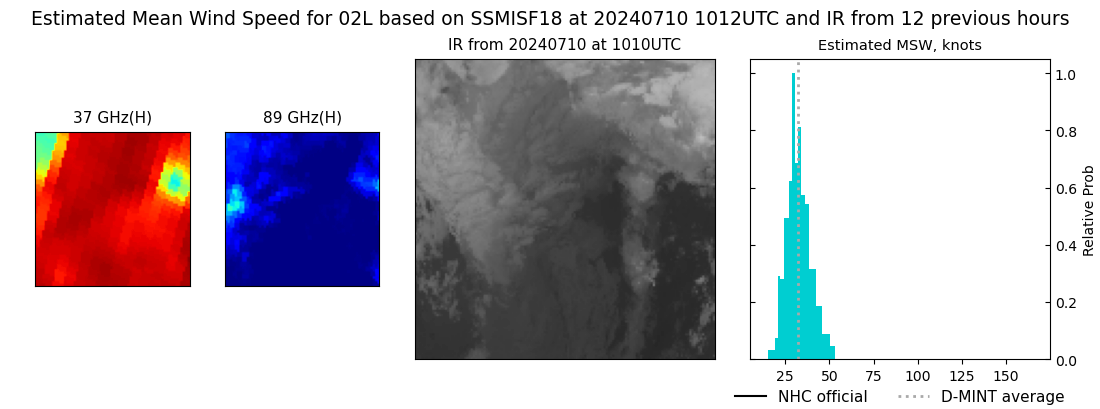 |
| 20240709 | UTC | 20240709 | 997 hPa | 37 kts | 33 kts | 42 kts | |
| 20240709 | 2316 UTC | SSMISF17 | 1004 hPa | 29 kts | 26 kts | 33 kts | 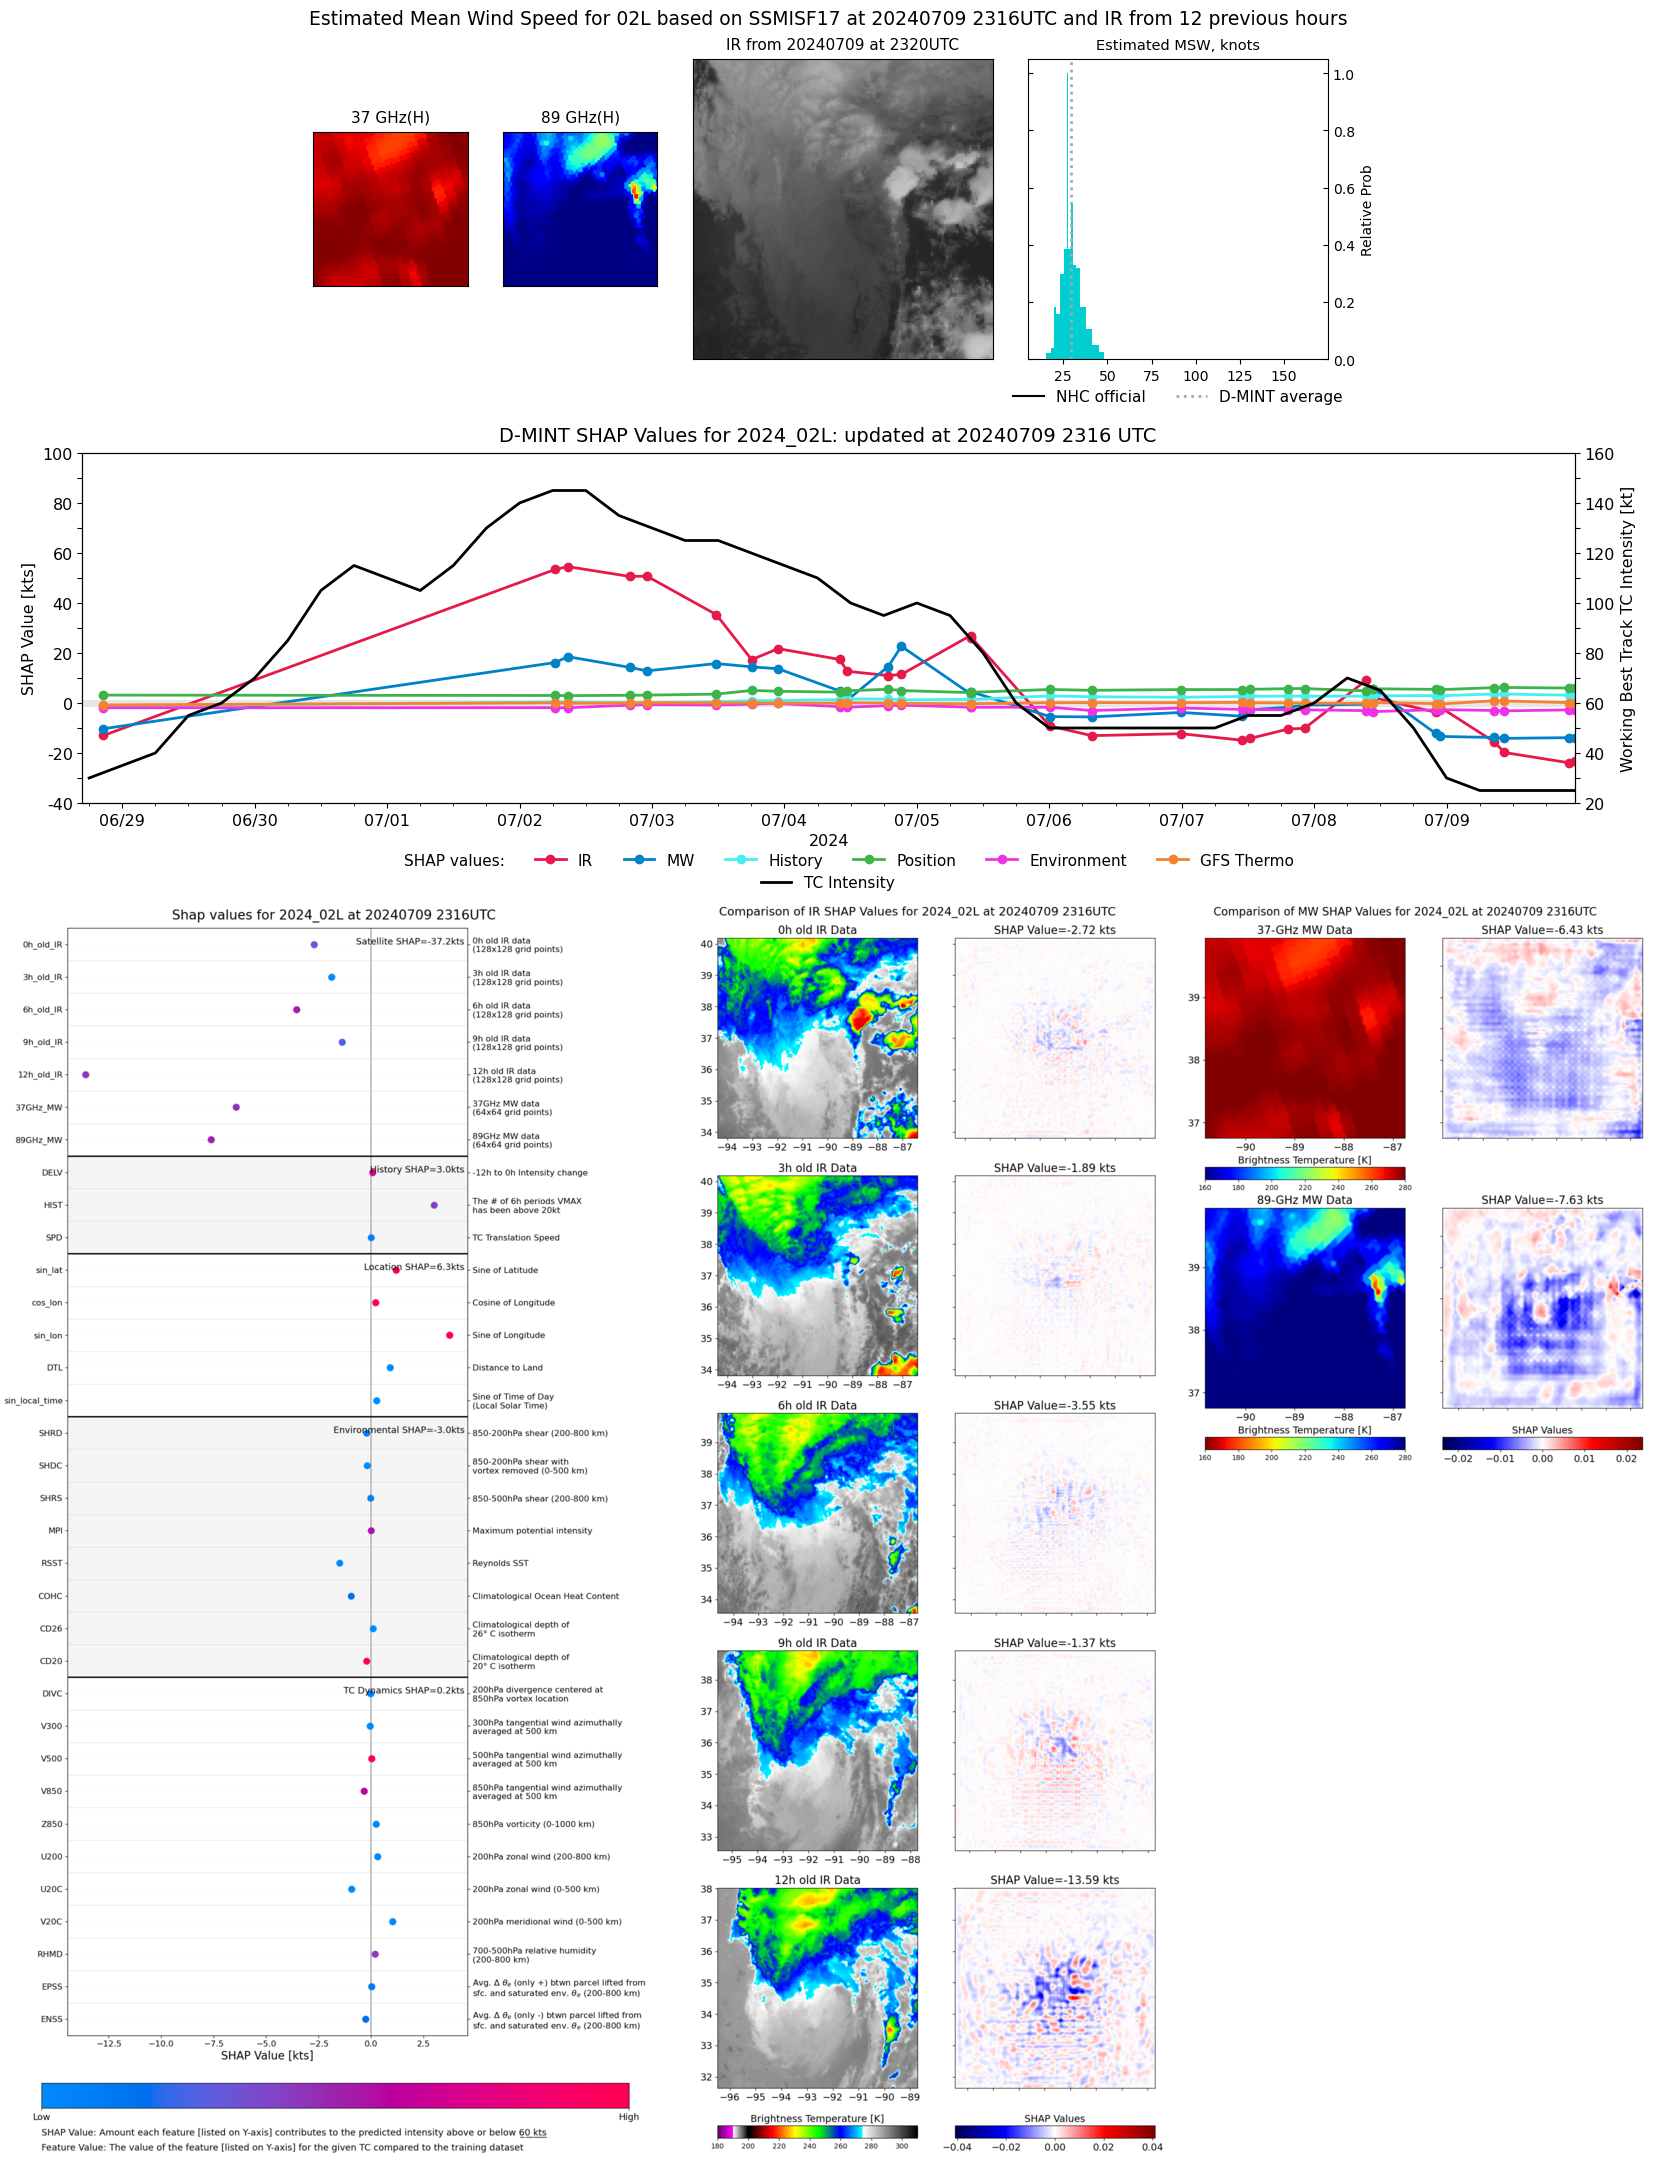 |
| 20240709 | UTC | 20240709 | 997 hPa | 37 kts | 33 kts | 42 kts | |
| 20240709 | 2208 UTC | GMI | 1007 hPa | 28 kts | 25 kts | 32 kts | 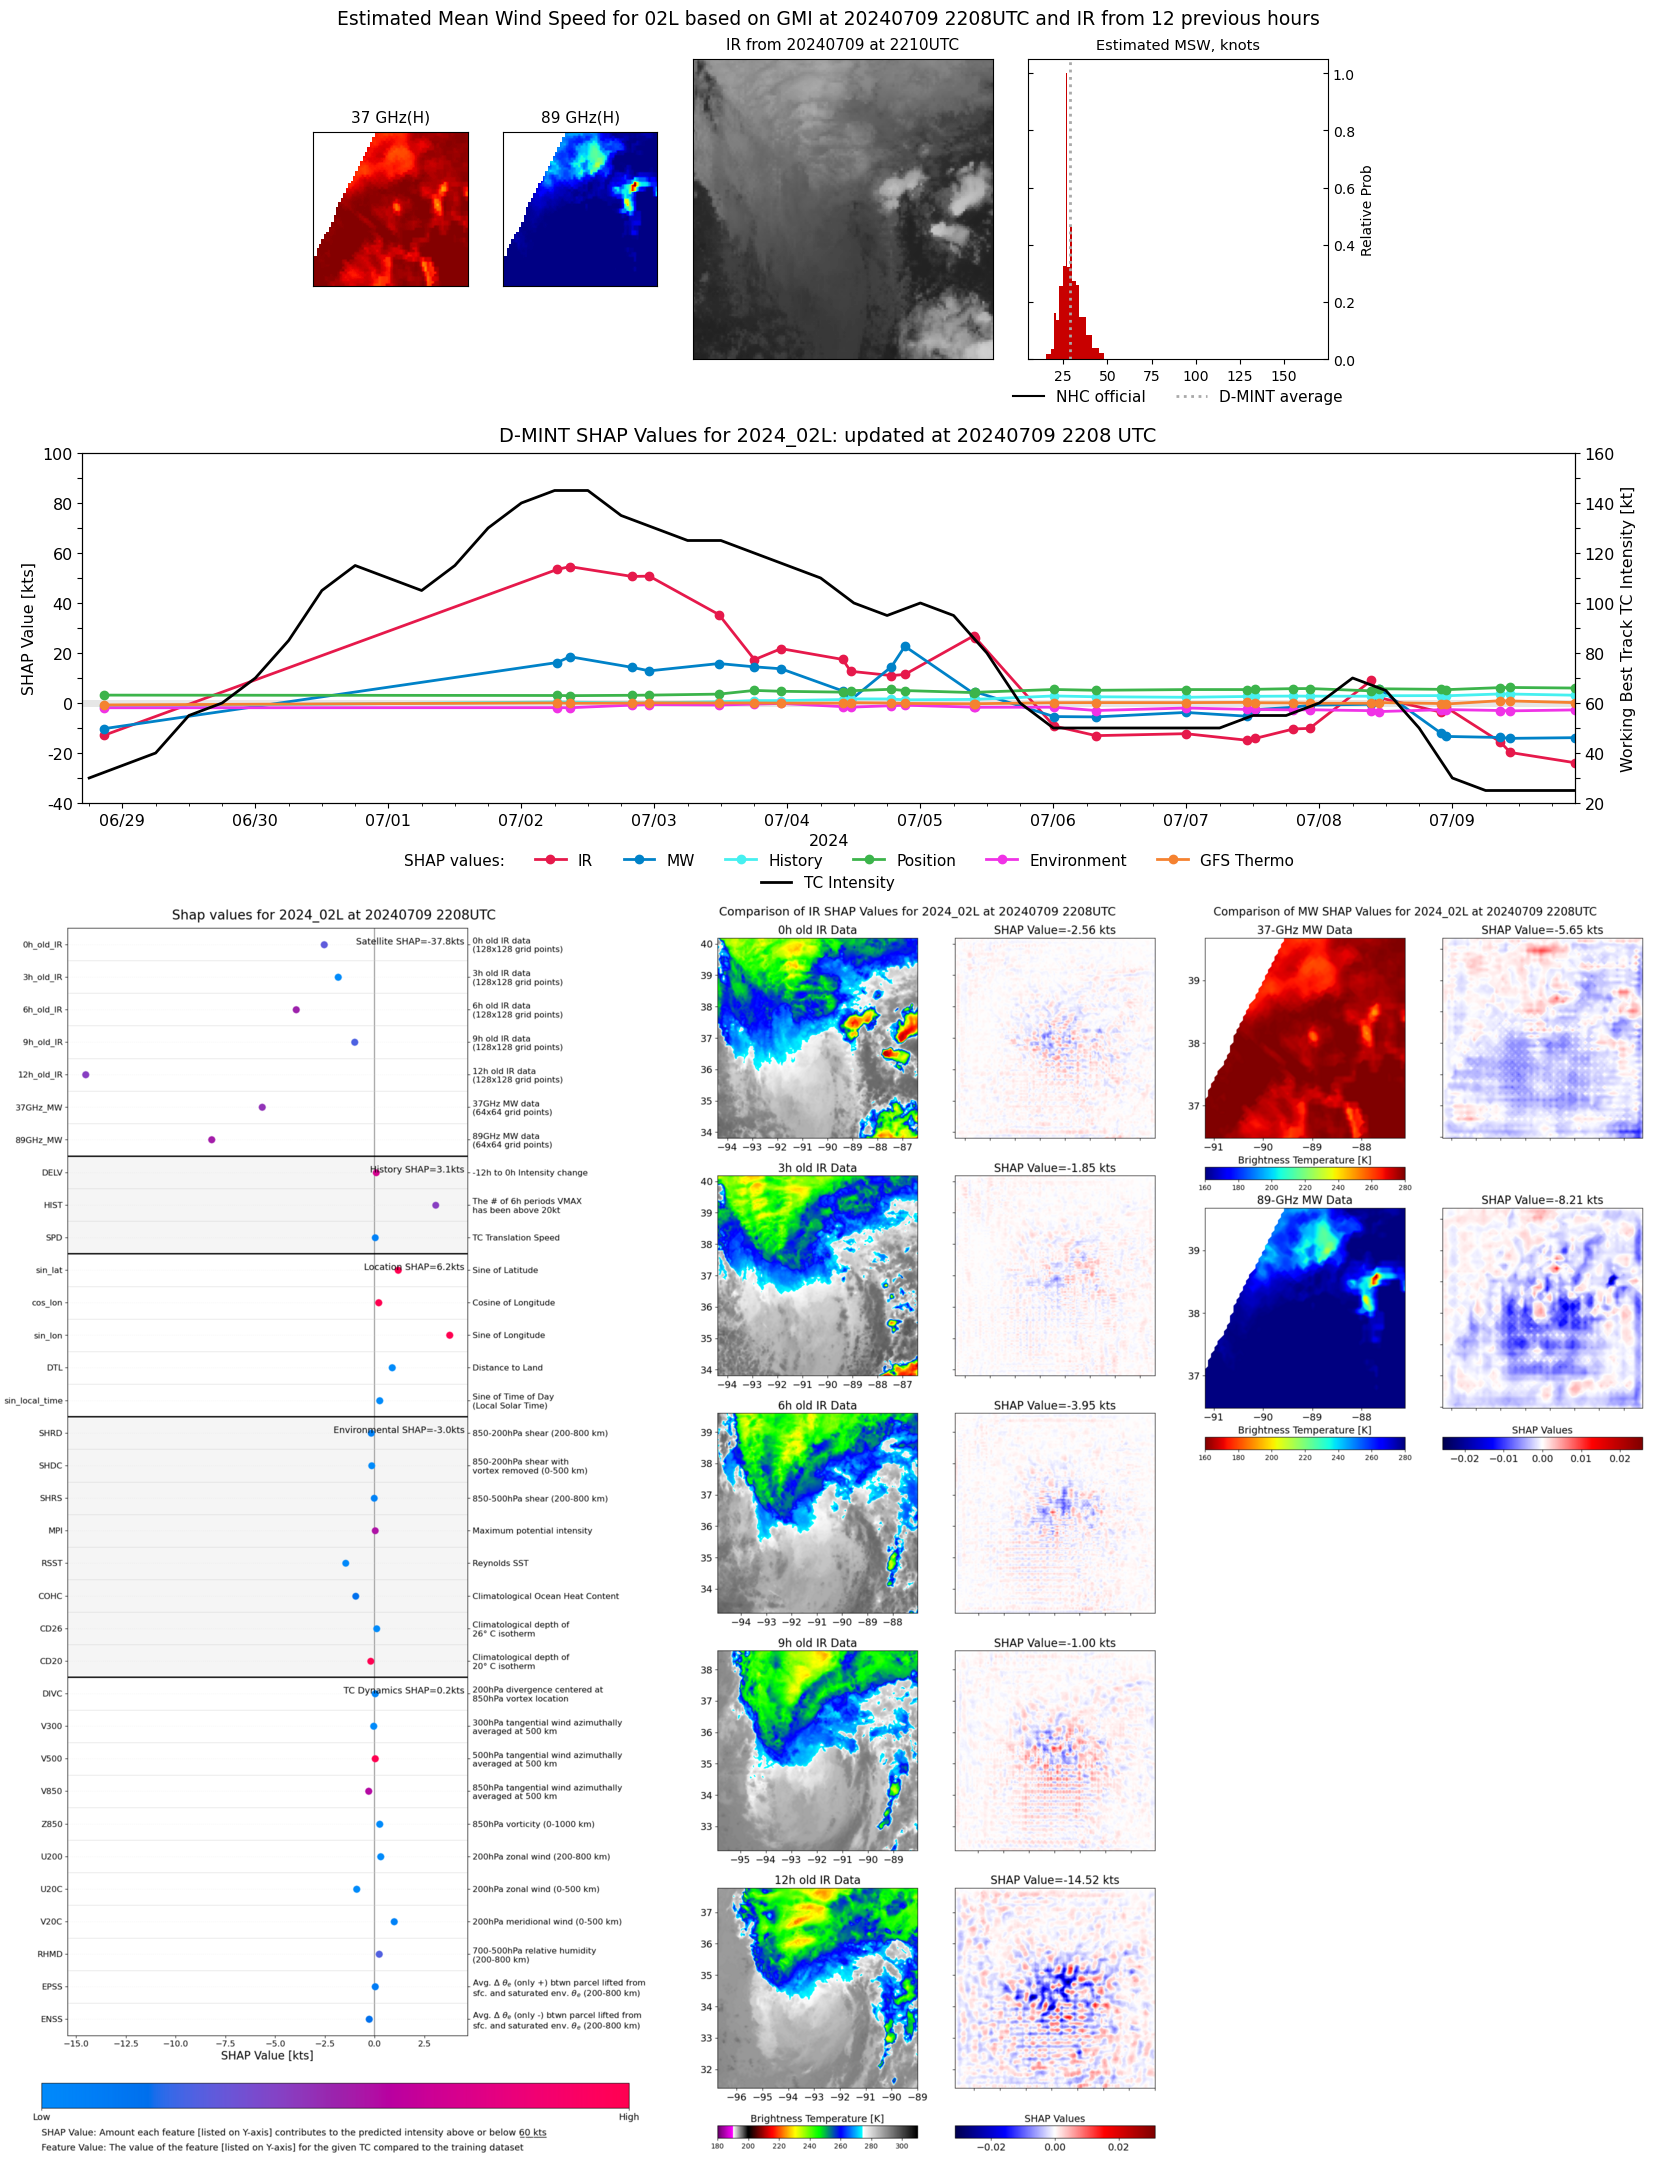 |
| 20240709 | UTC | 20240709 | 997 hPa | 37 kts | 33 kts | 42 kts | |
| 20240709 | 2151 UTC | SSMISF18 | 1006 hPa | 30 kts | 26 kts | 34 kts | 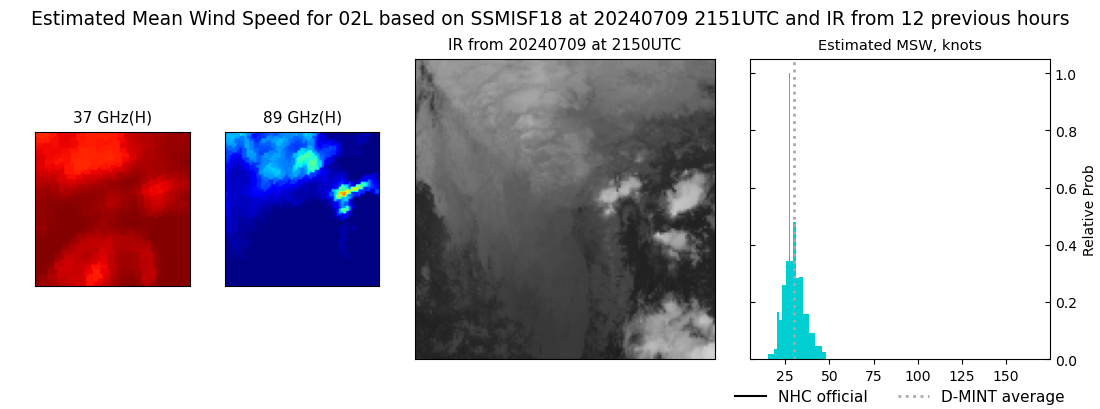 |
| 20240709 | UTC | 20240709 | 997 hPa | 37 kts | 33 kts | 42 kts | |
| 20240709 | 1028 UTC | SSMISF18 | 1001 hPa | 34 kts | 30 kts | 38 kts |  |
| 20240709 | UTC | 20240709 | 997 hPa | 37 kts | 33 kts | 42 kts | |
| 20240709 | 0838 UTC | GMI | 997 hPa | 37 kts | 33 kts | 42 kts | 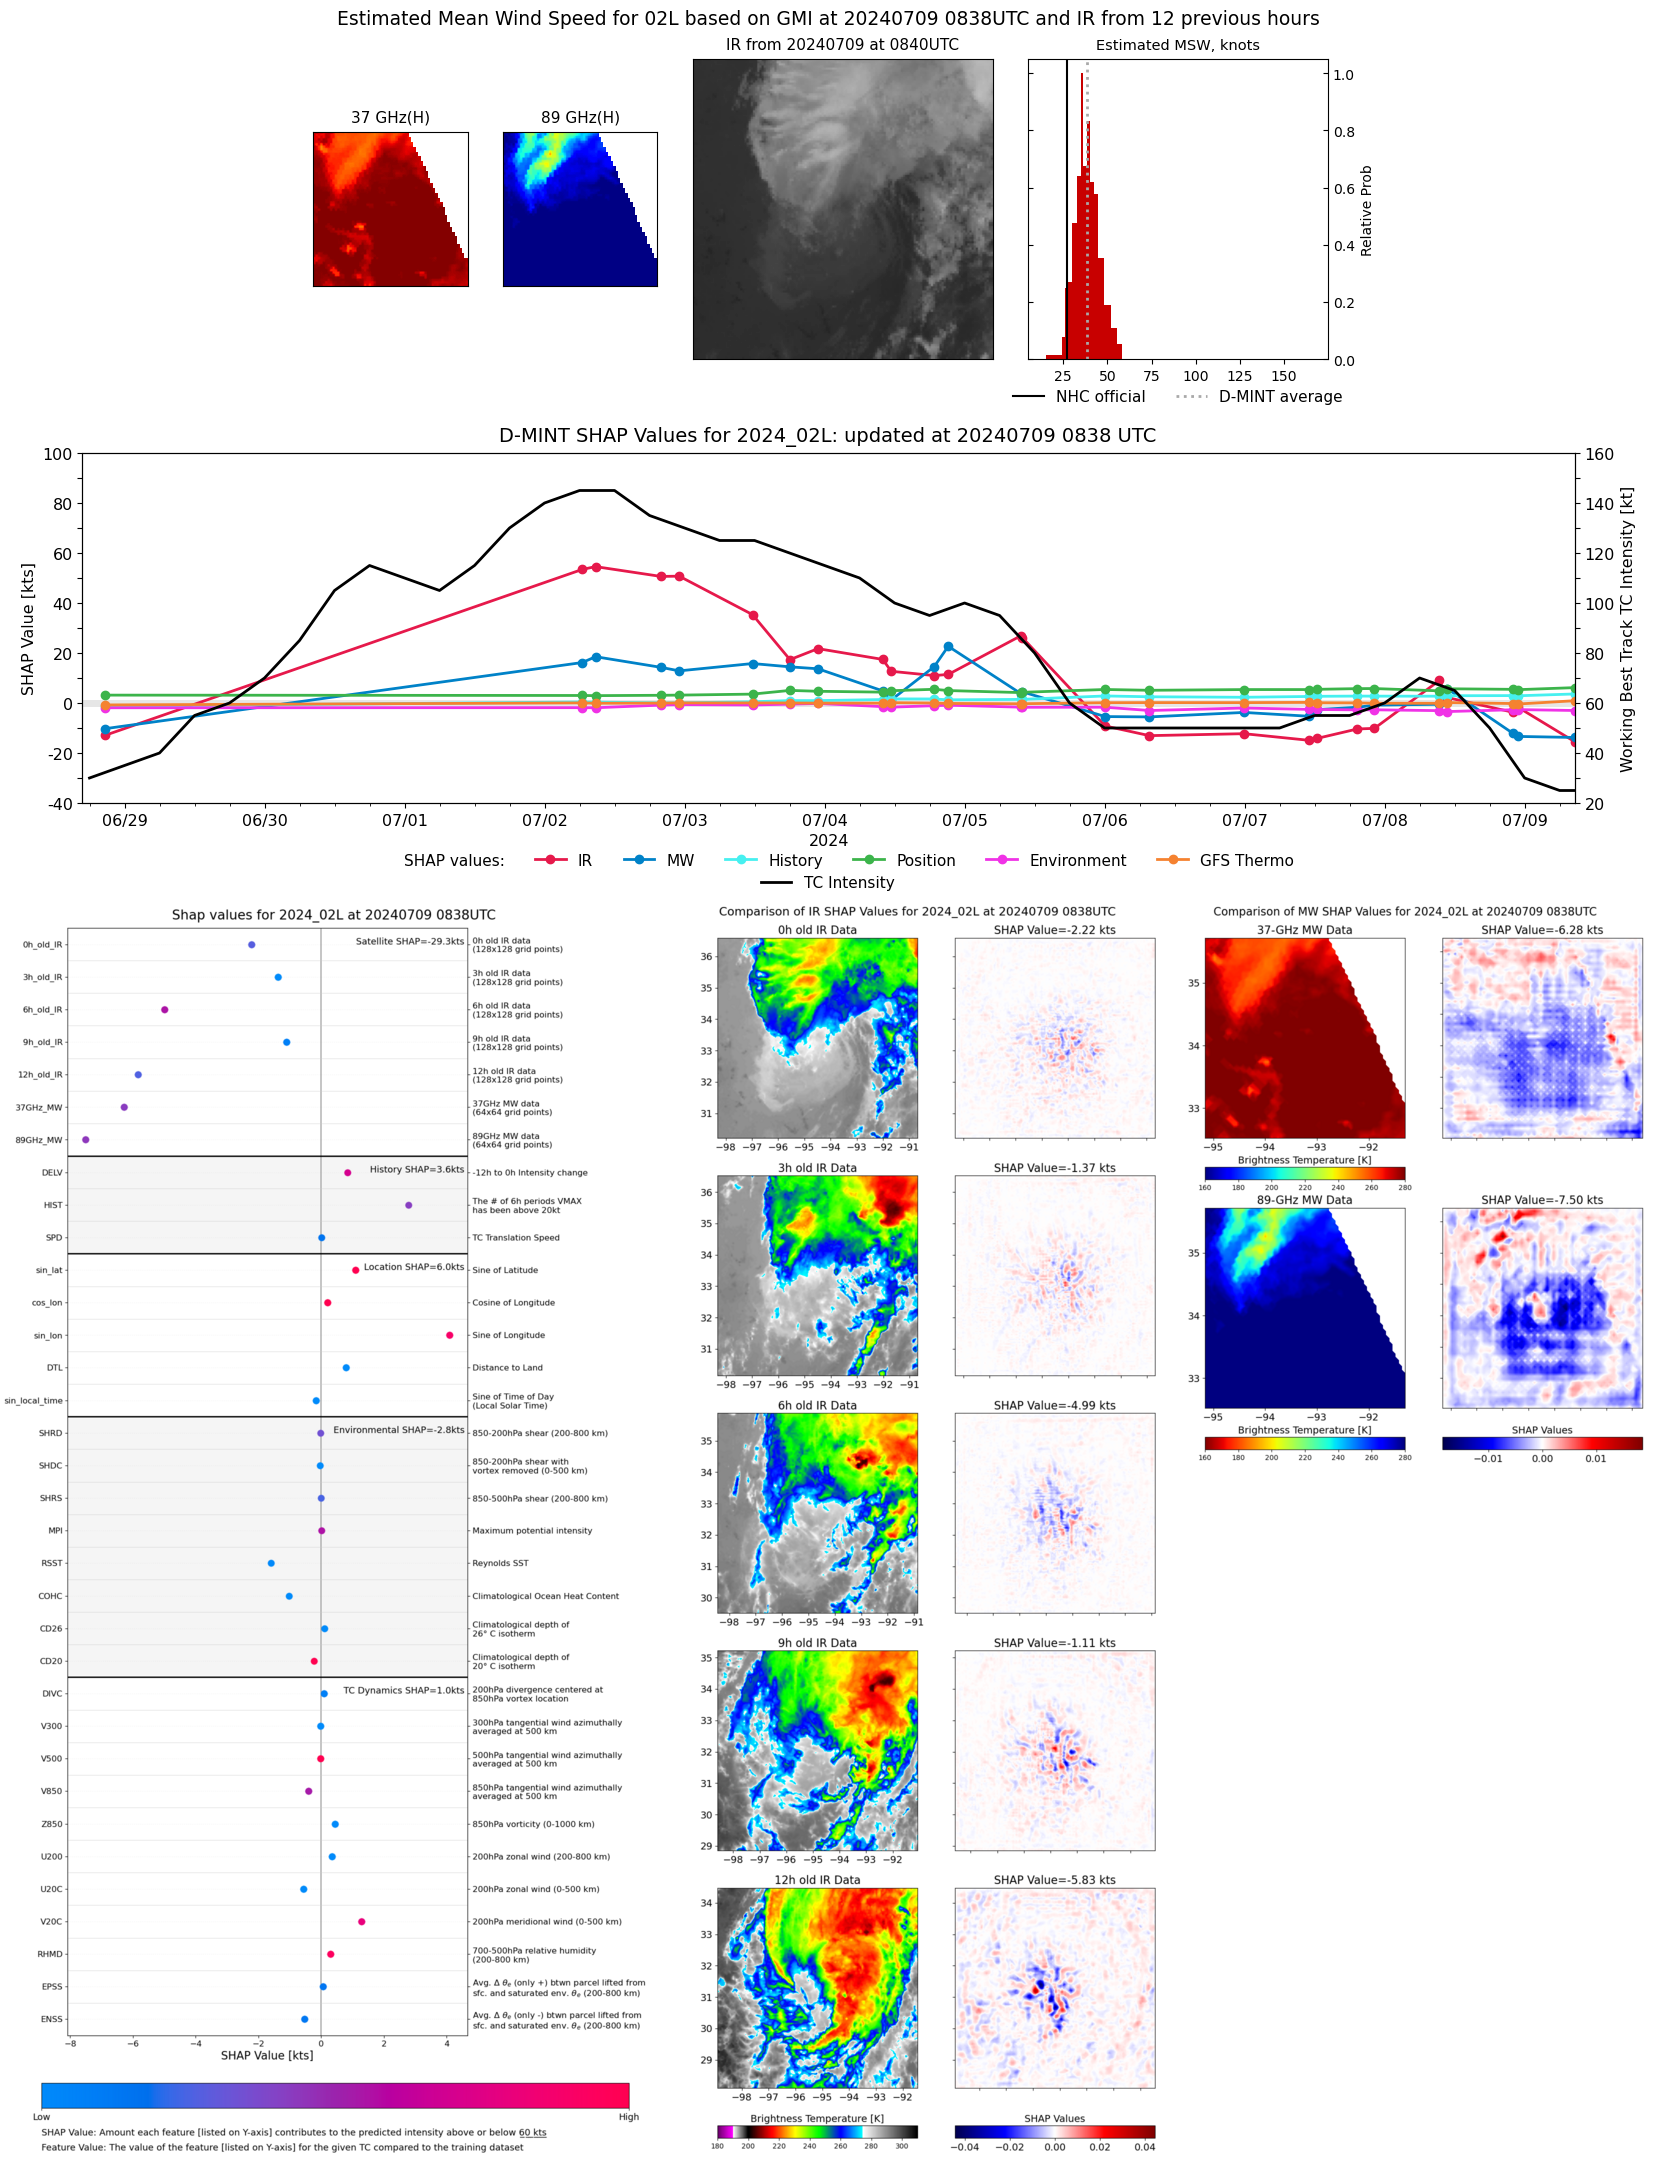 |
| 20240708 | UTC | 20240708 | 992 hPa | 59 kts | 54 kts | 64 kts | |
| 20240708 | 2248 UTC | GMI | 992 hPa | 50 kts | 44 kts | 57 kts | 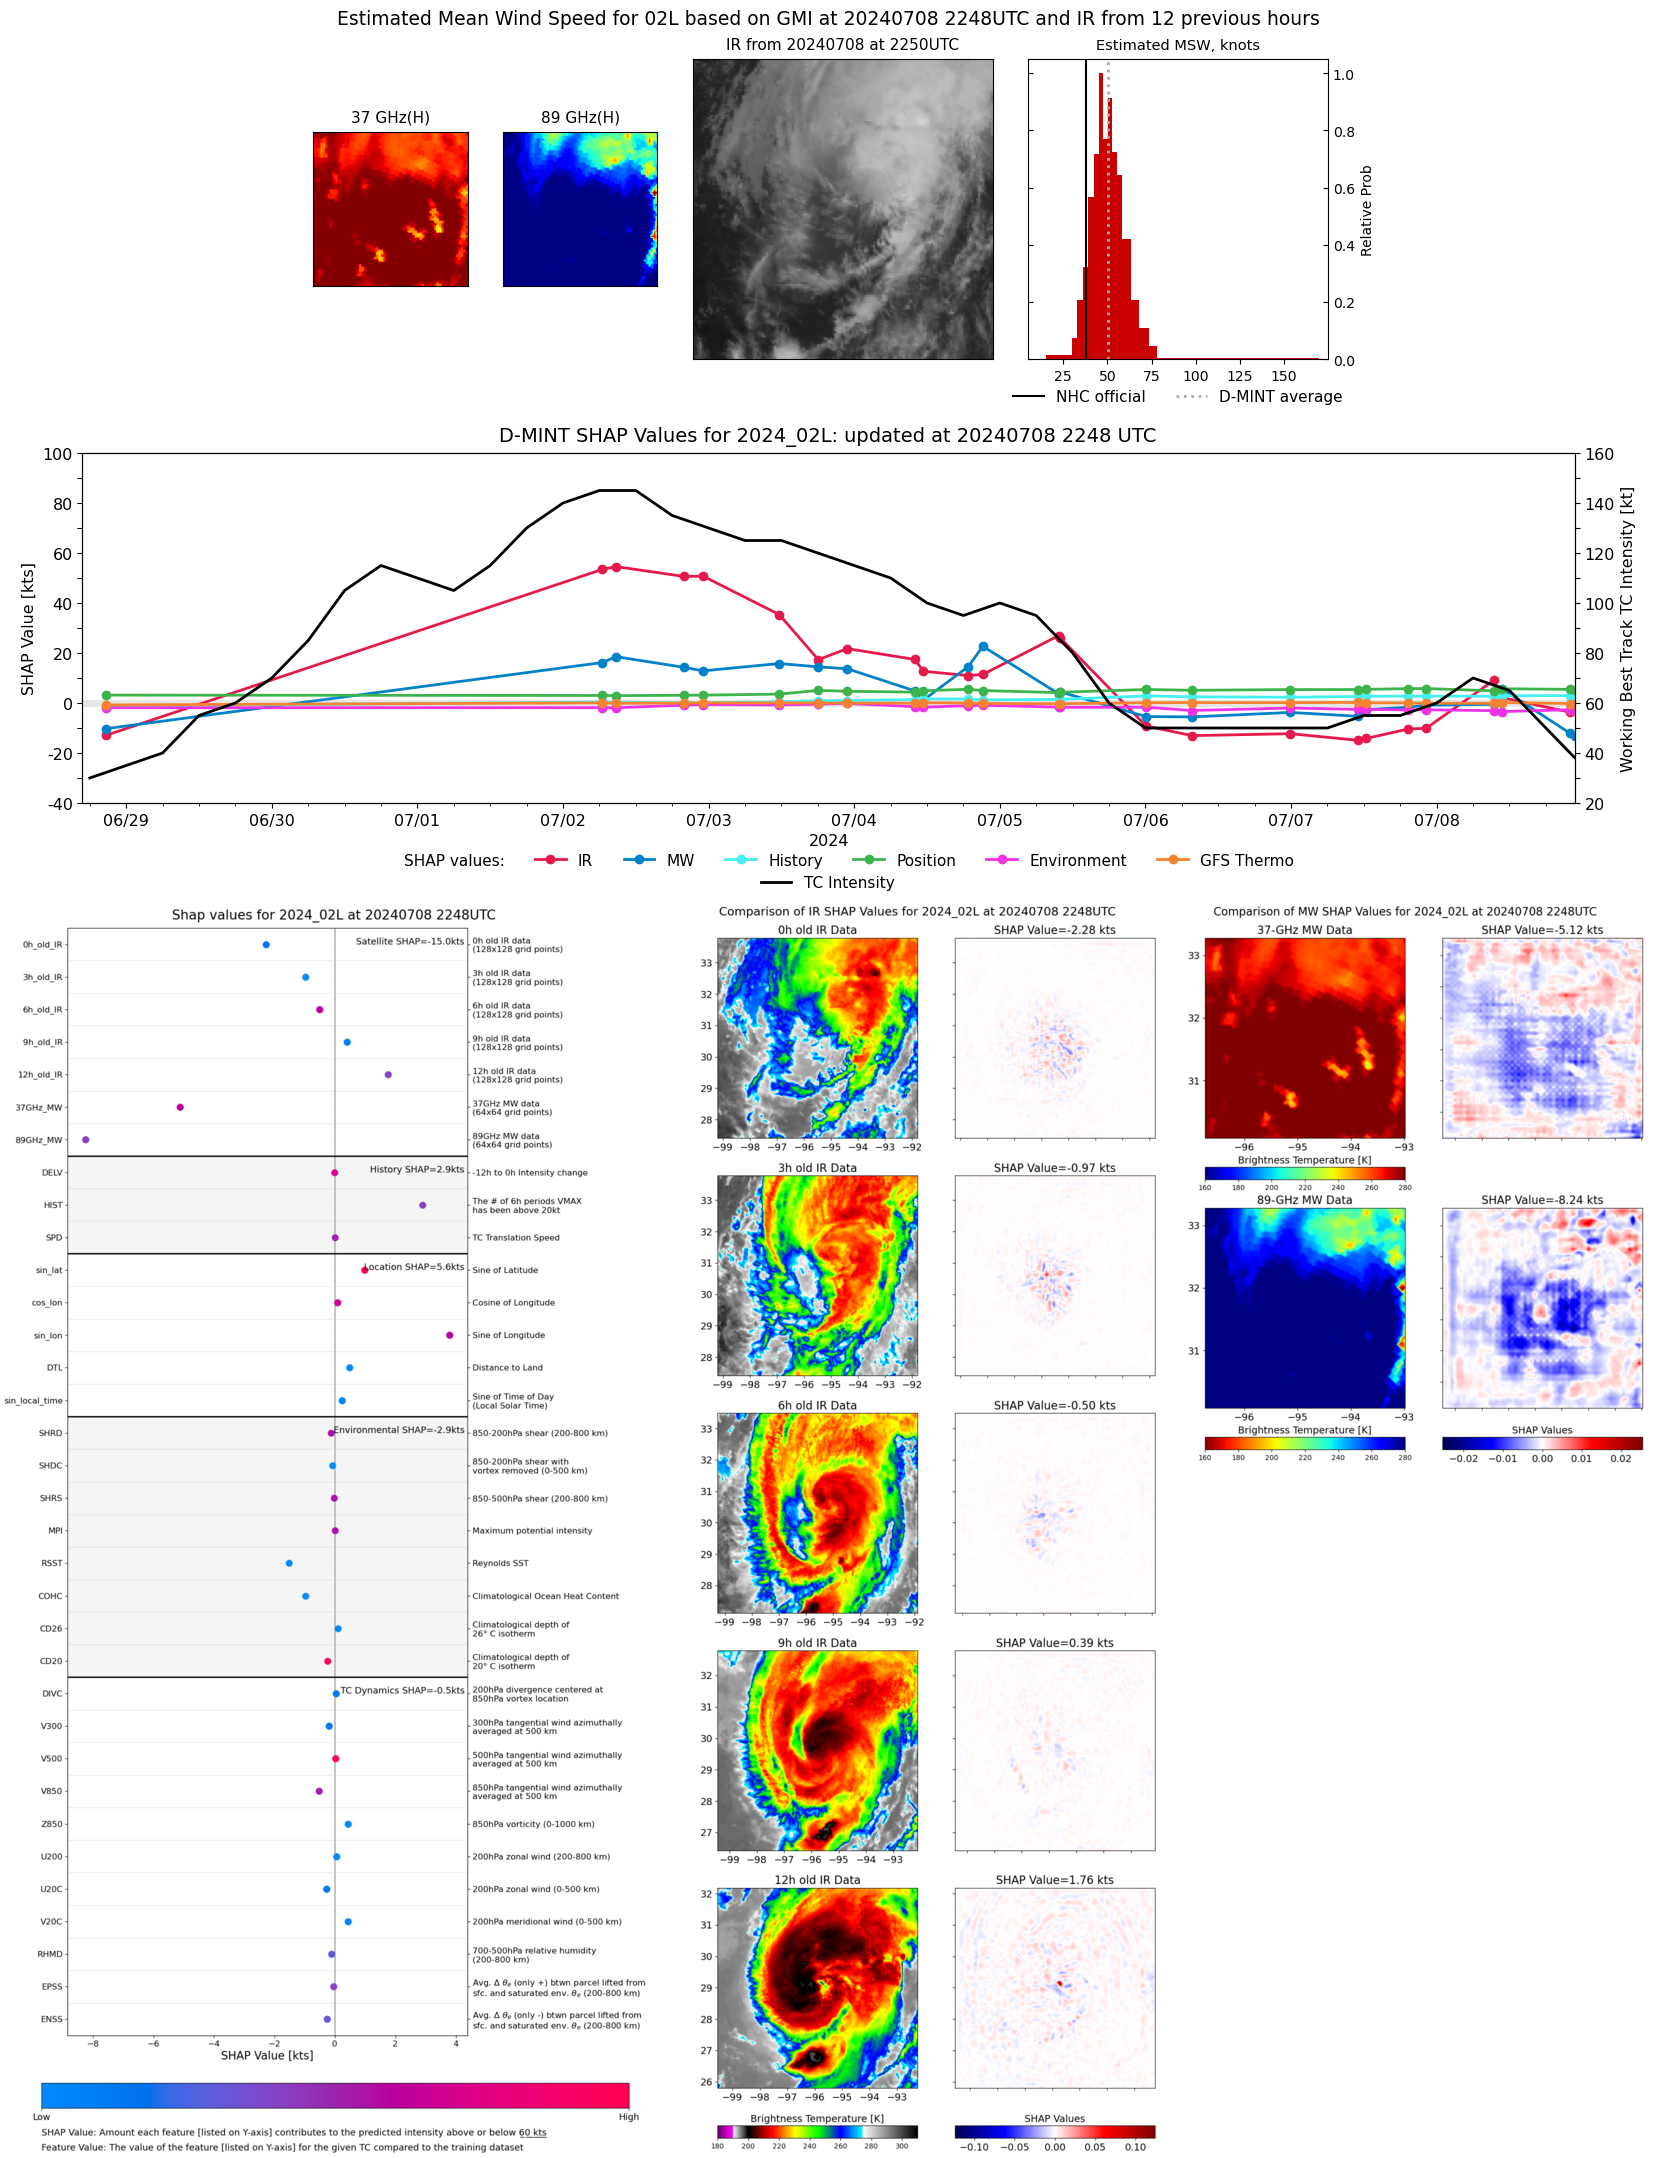 |
| 20240708 | UTC | 20240708 | 992 hPa | 59 kts | 54 kts | 64 kts | |
| 20240708 | 2202 UTC | SSMISF18 | 993 hPa | 50 kts | 44 kts | 56 kts | 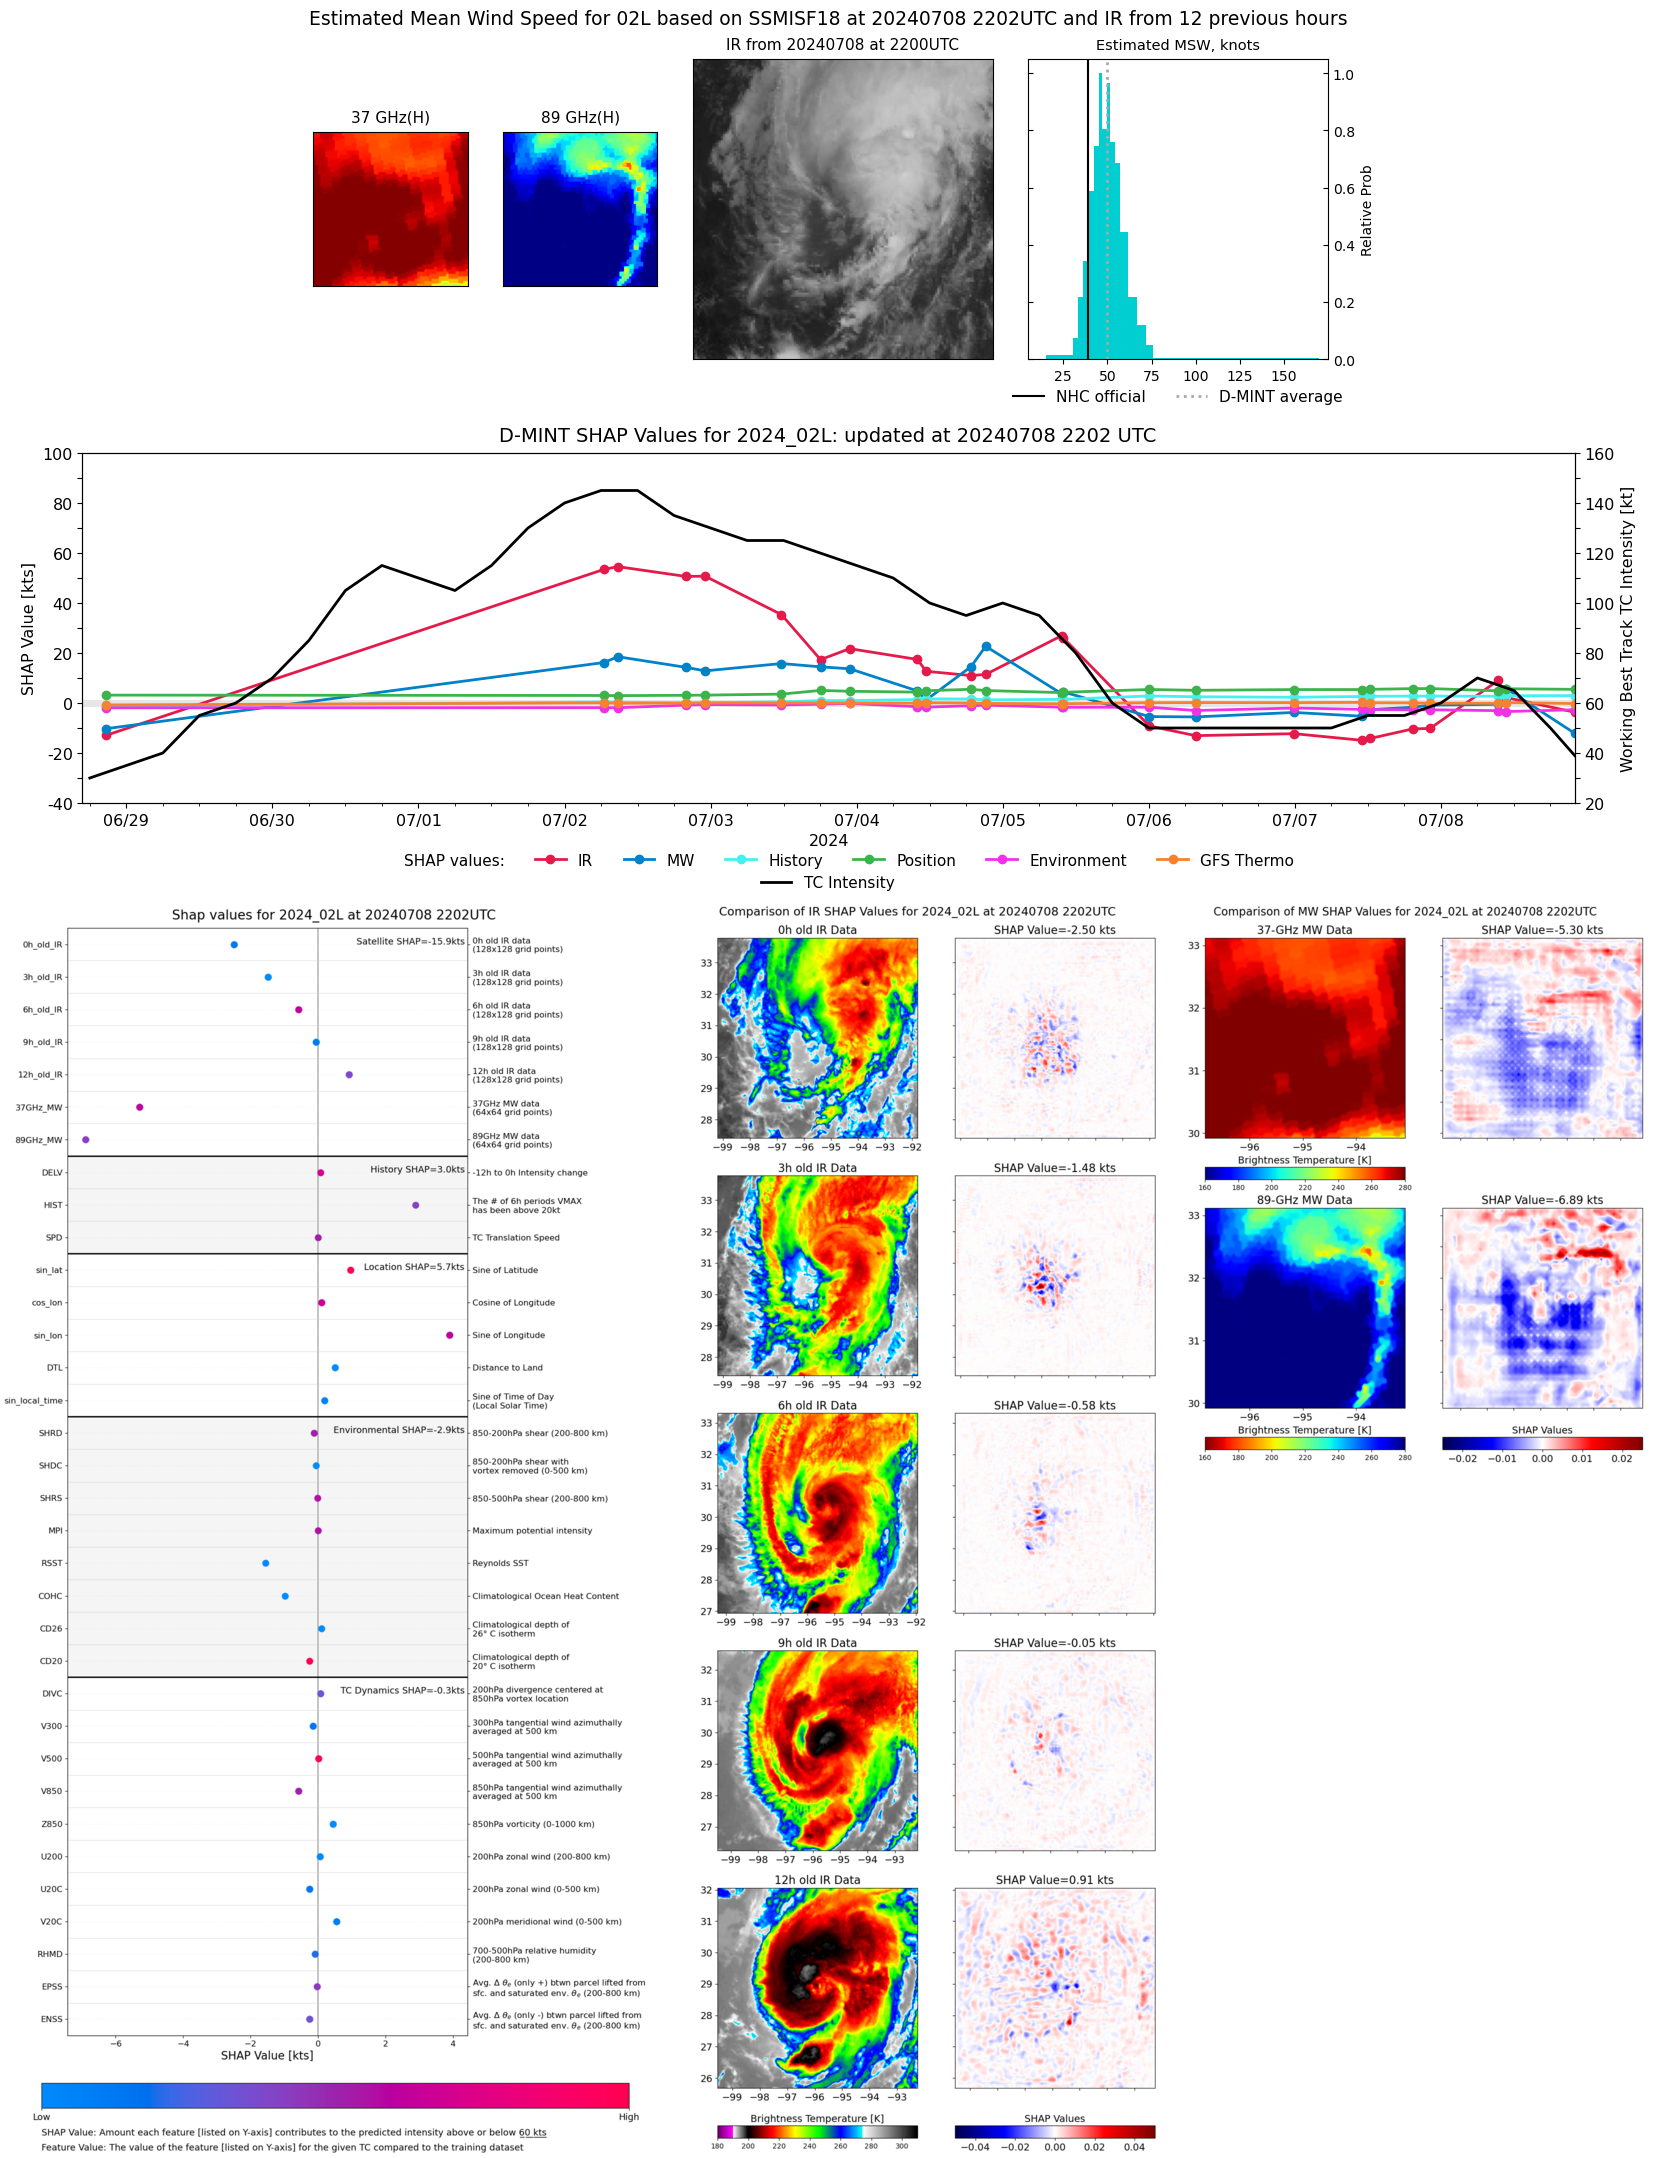 |
| 20240708 | UTC | 20240708 | 992 hPa | 59 kts | 54 kts | 64 kts | |
| 20240708 | 1508 UTC | TROPICS06 | 980 hPa | 63 kts | 59 kts | 68 kts | 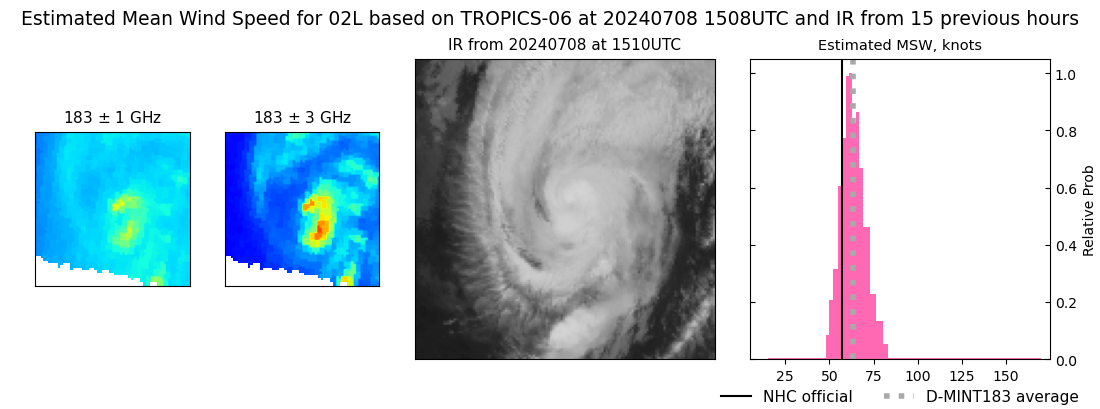 |
| 20240708 | UTC | 20240708 | 992 hPa | 59 kts | 54 kts | 64 kts | |
| 20240708 | 1147 UTC | TROPICS06 | 976 hPa | 76 kts | 71 kts | 81 kts | 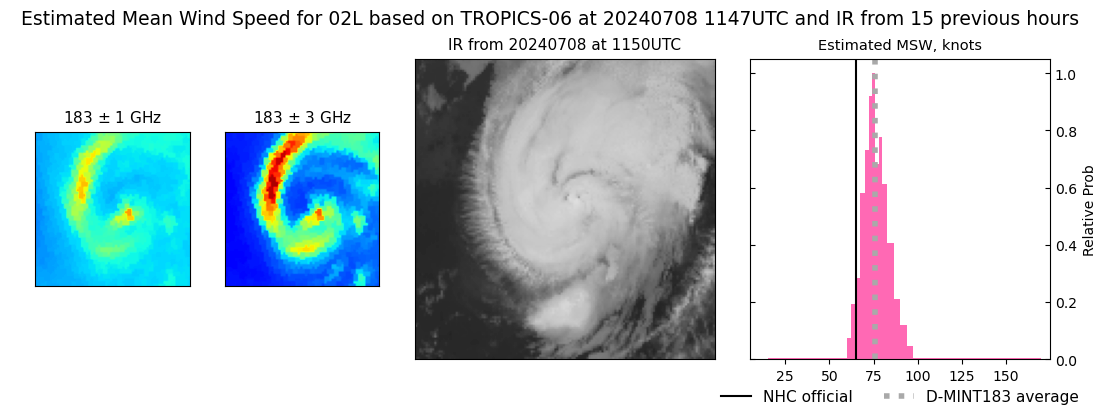 |
| 20240708 | UTC | 20240708 | 992 hPa | 59 kts | 54 kts | 64 kts | |
| 20240708 | 1043 UTC | SSMISF18 | 983 hPa | 73 kts | 66 kts | 80 kts | 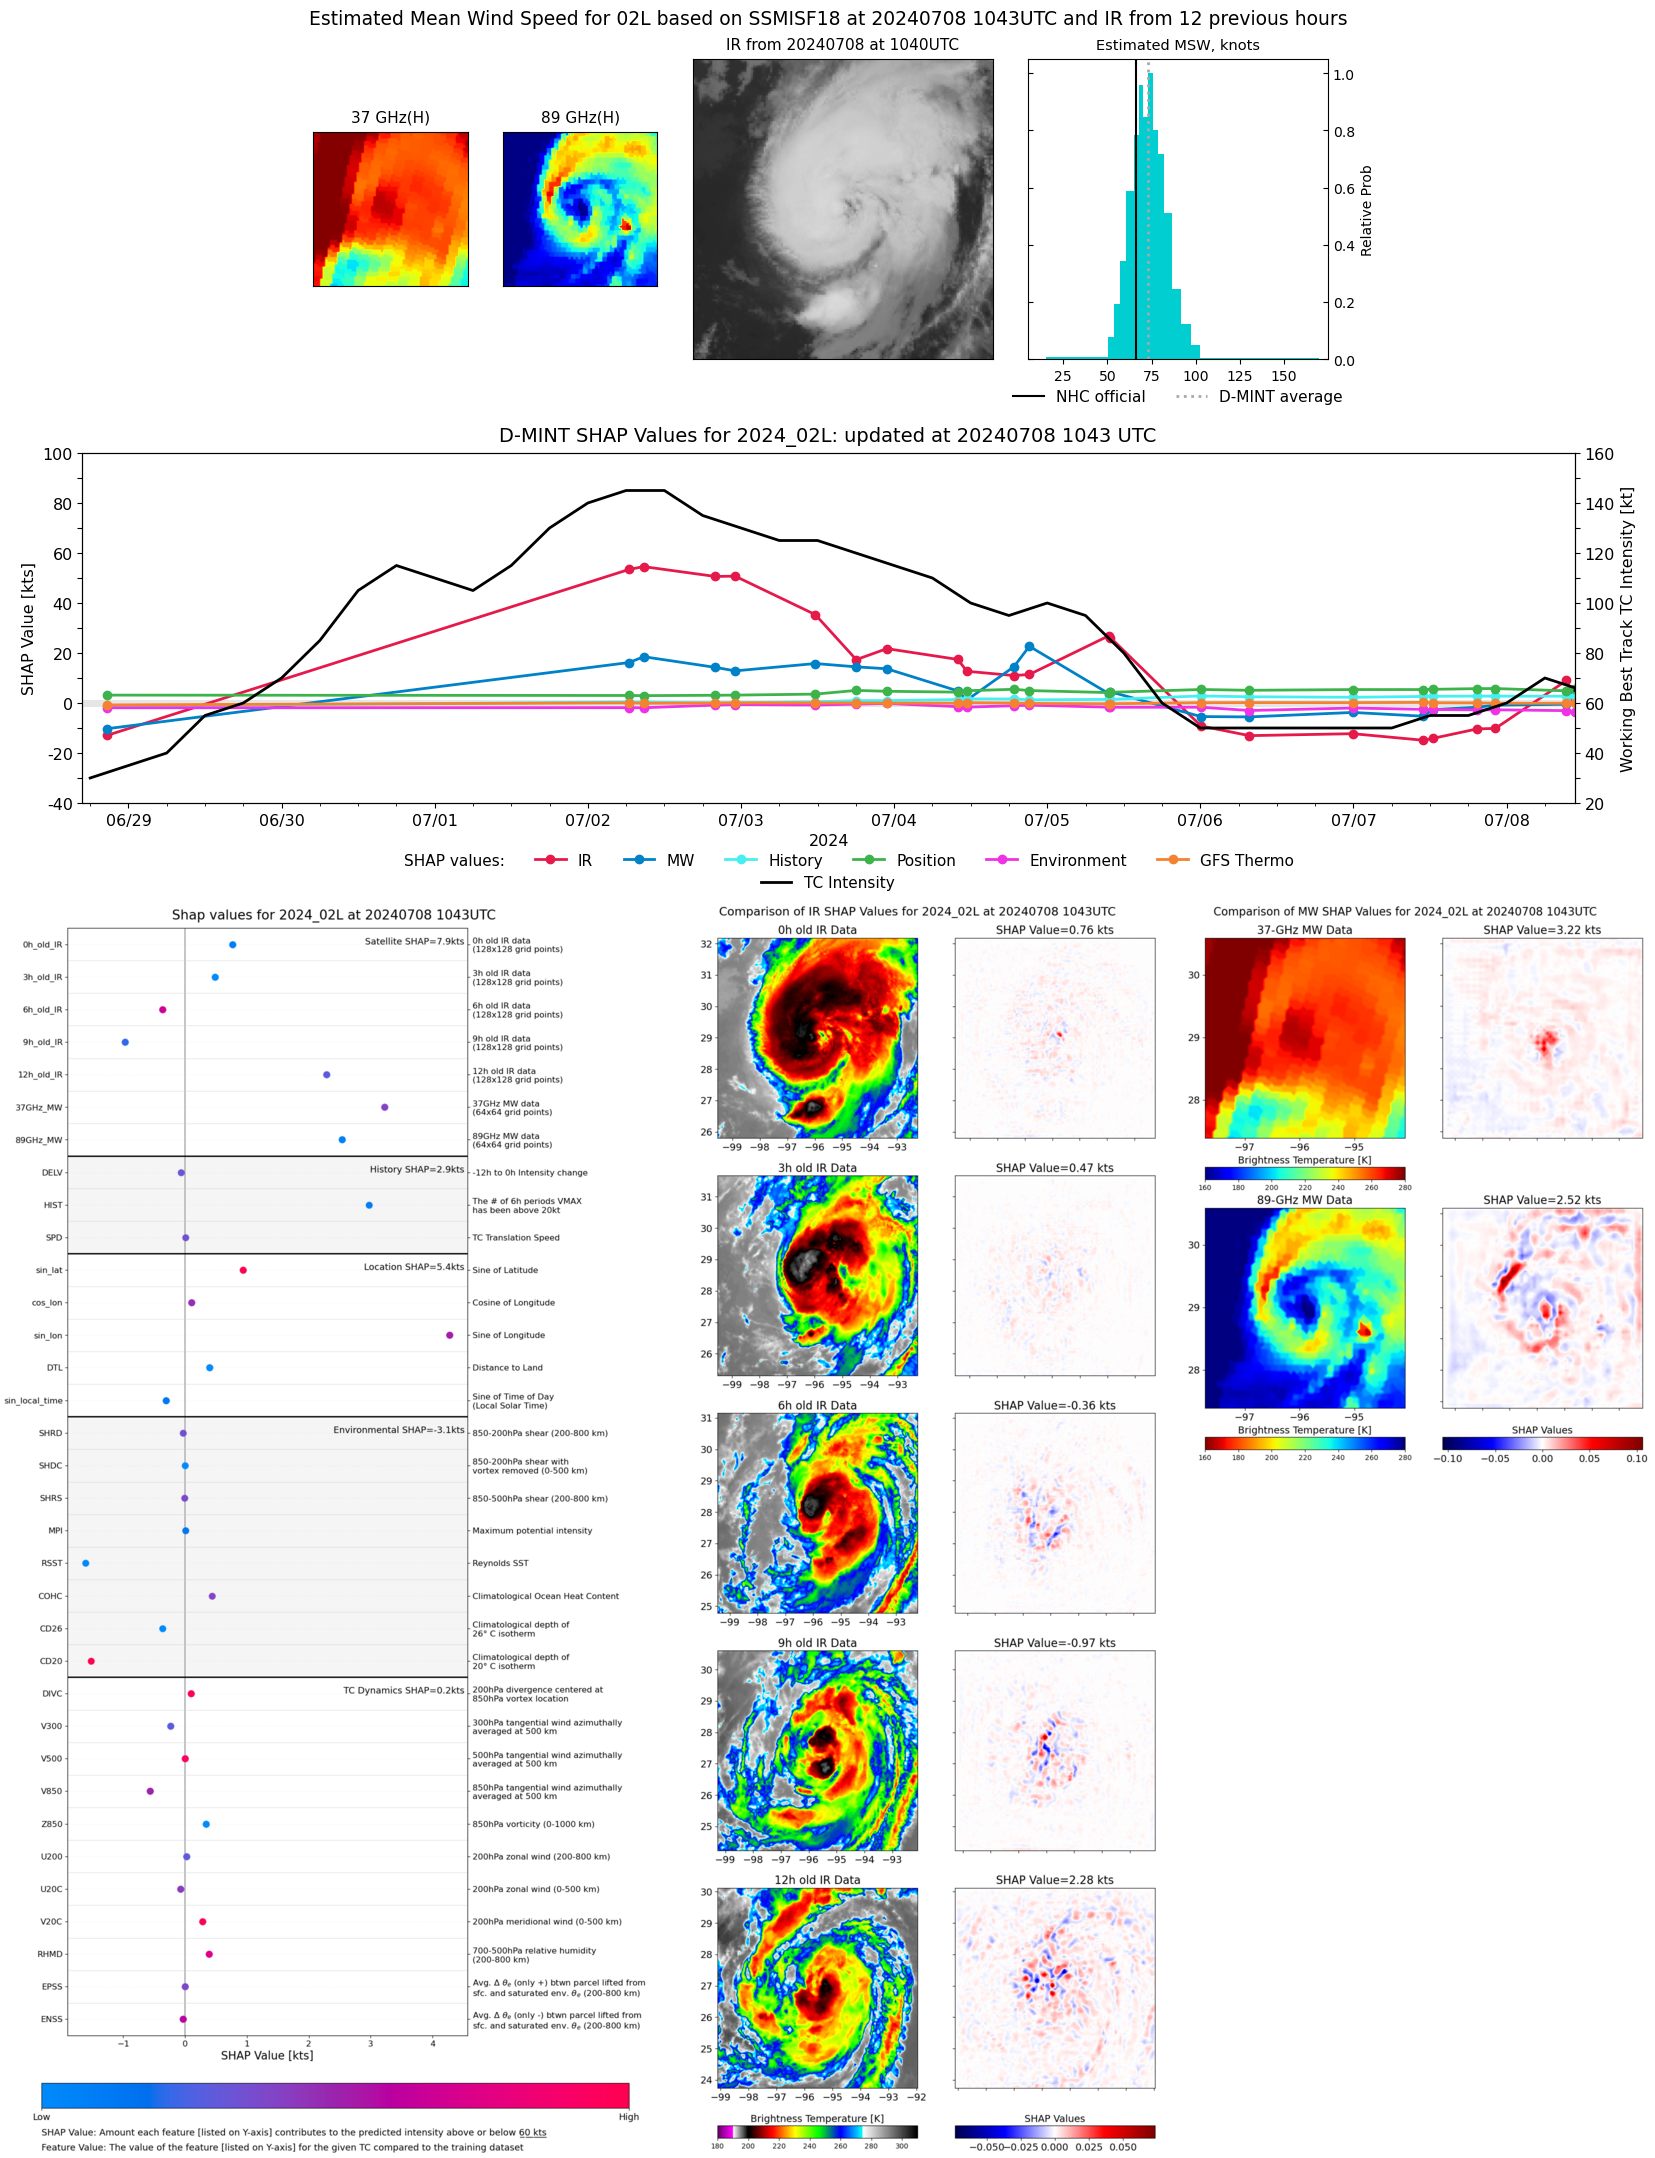 |
| 20240708 | UTC | 20240708 | 992 hPa | 59 kts | 54 kts | 64 kts | |
| 20240708 | 0923 UTC | GMI | 985 hPa | 70 kts | 63 kts | 78 kts | 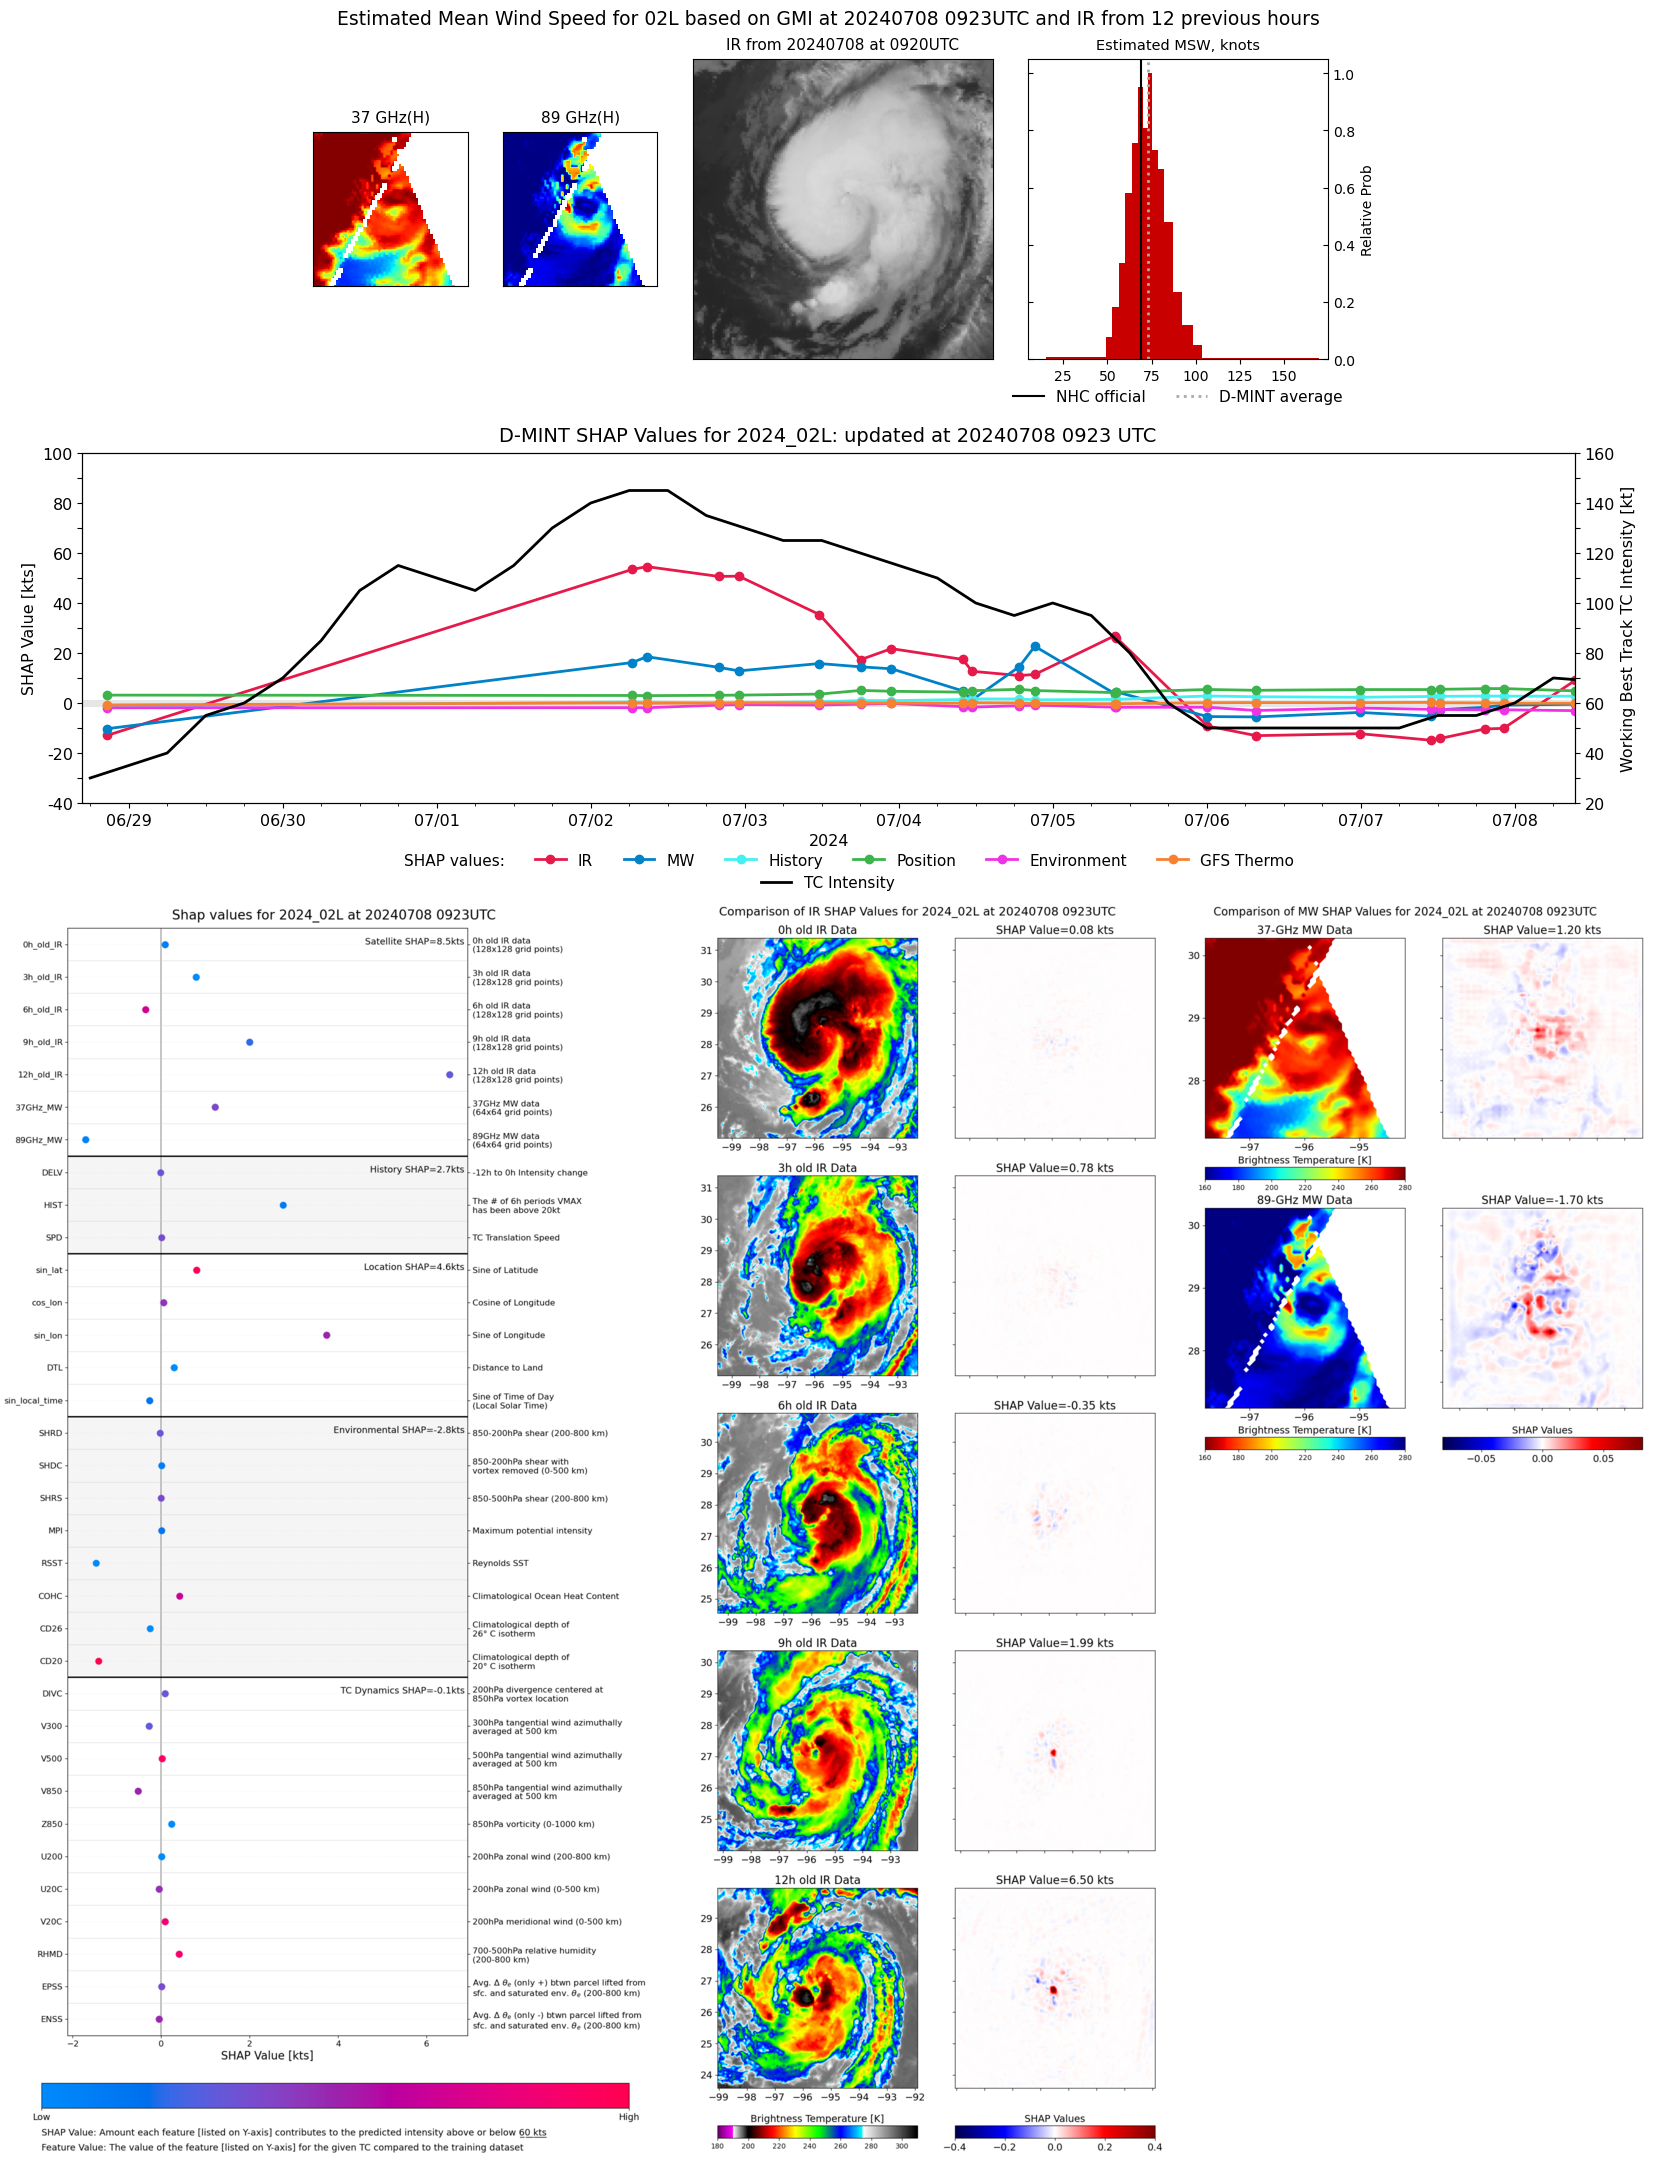 |
| 20240708 | UTC | 20240708 | 992 hPa | 59 kts | 54 kts | 64 kts | |
| 20240708 | 0444 UTC | TROPICS03 | 992 hPa | 59 kts | 54 kts | 64 kts | 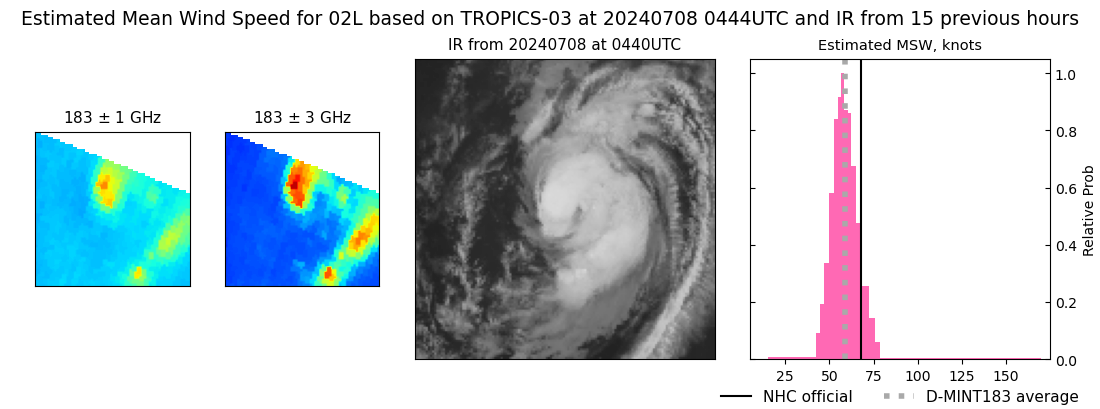 |
| 20240707 | UTC | 20240707 | 1003 hPa | 46 kts | 41 kts | 51 kts | |
| 20240707 | 2342 UTC | TROPICS03 | 990 hPa | 58 kts | 54 kts | 63 kts | 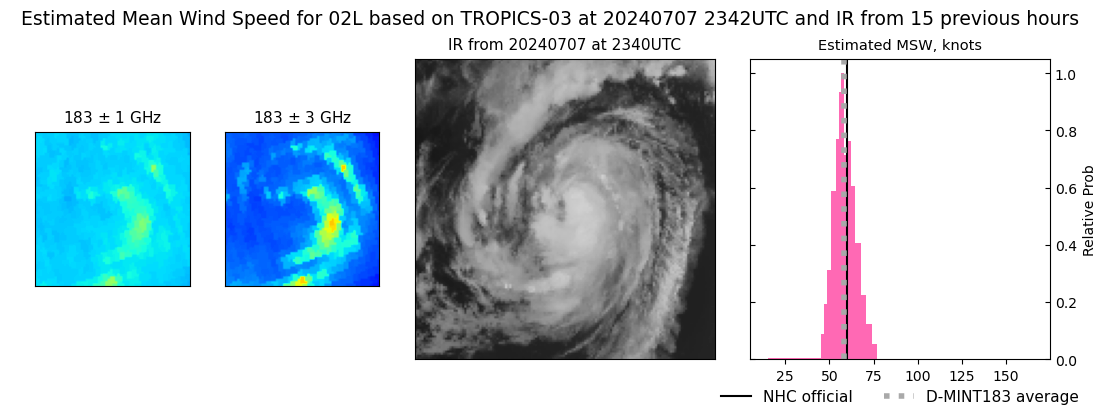 |
| 20240707 | UTC | 20240707 | 1003 hPa | 46 kts | 41 kts | 51 kts | |
| 20240707 | 2215 UTC | SSMISF18 | 994 hPa | 55 kts | 50 kts | 60 kts | 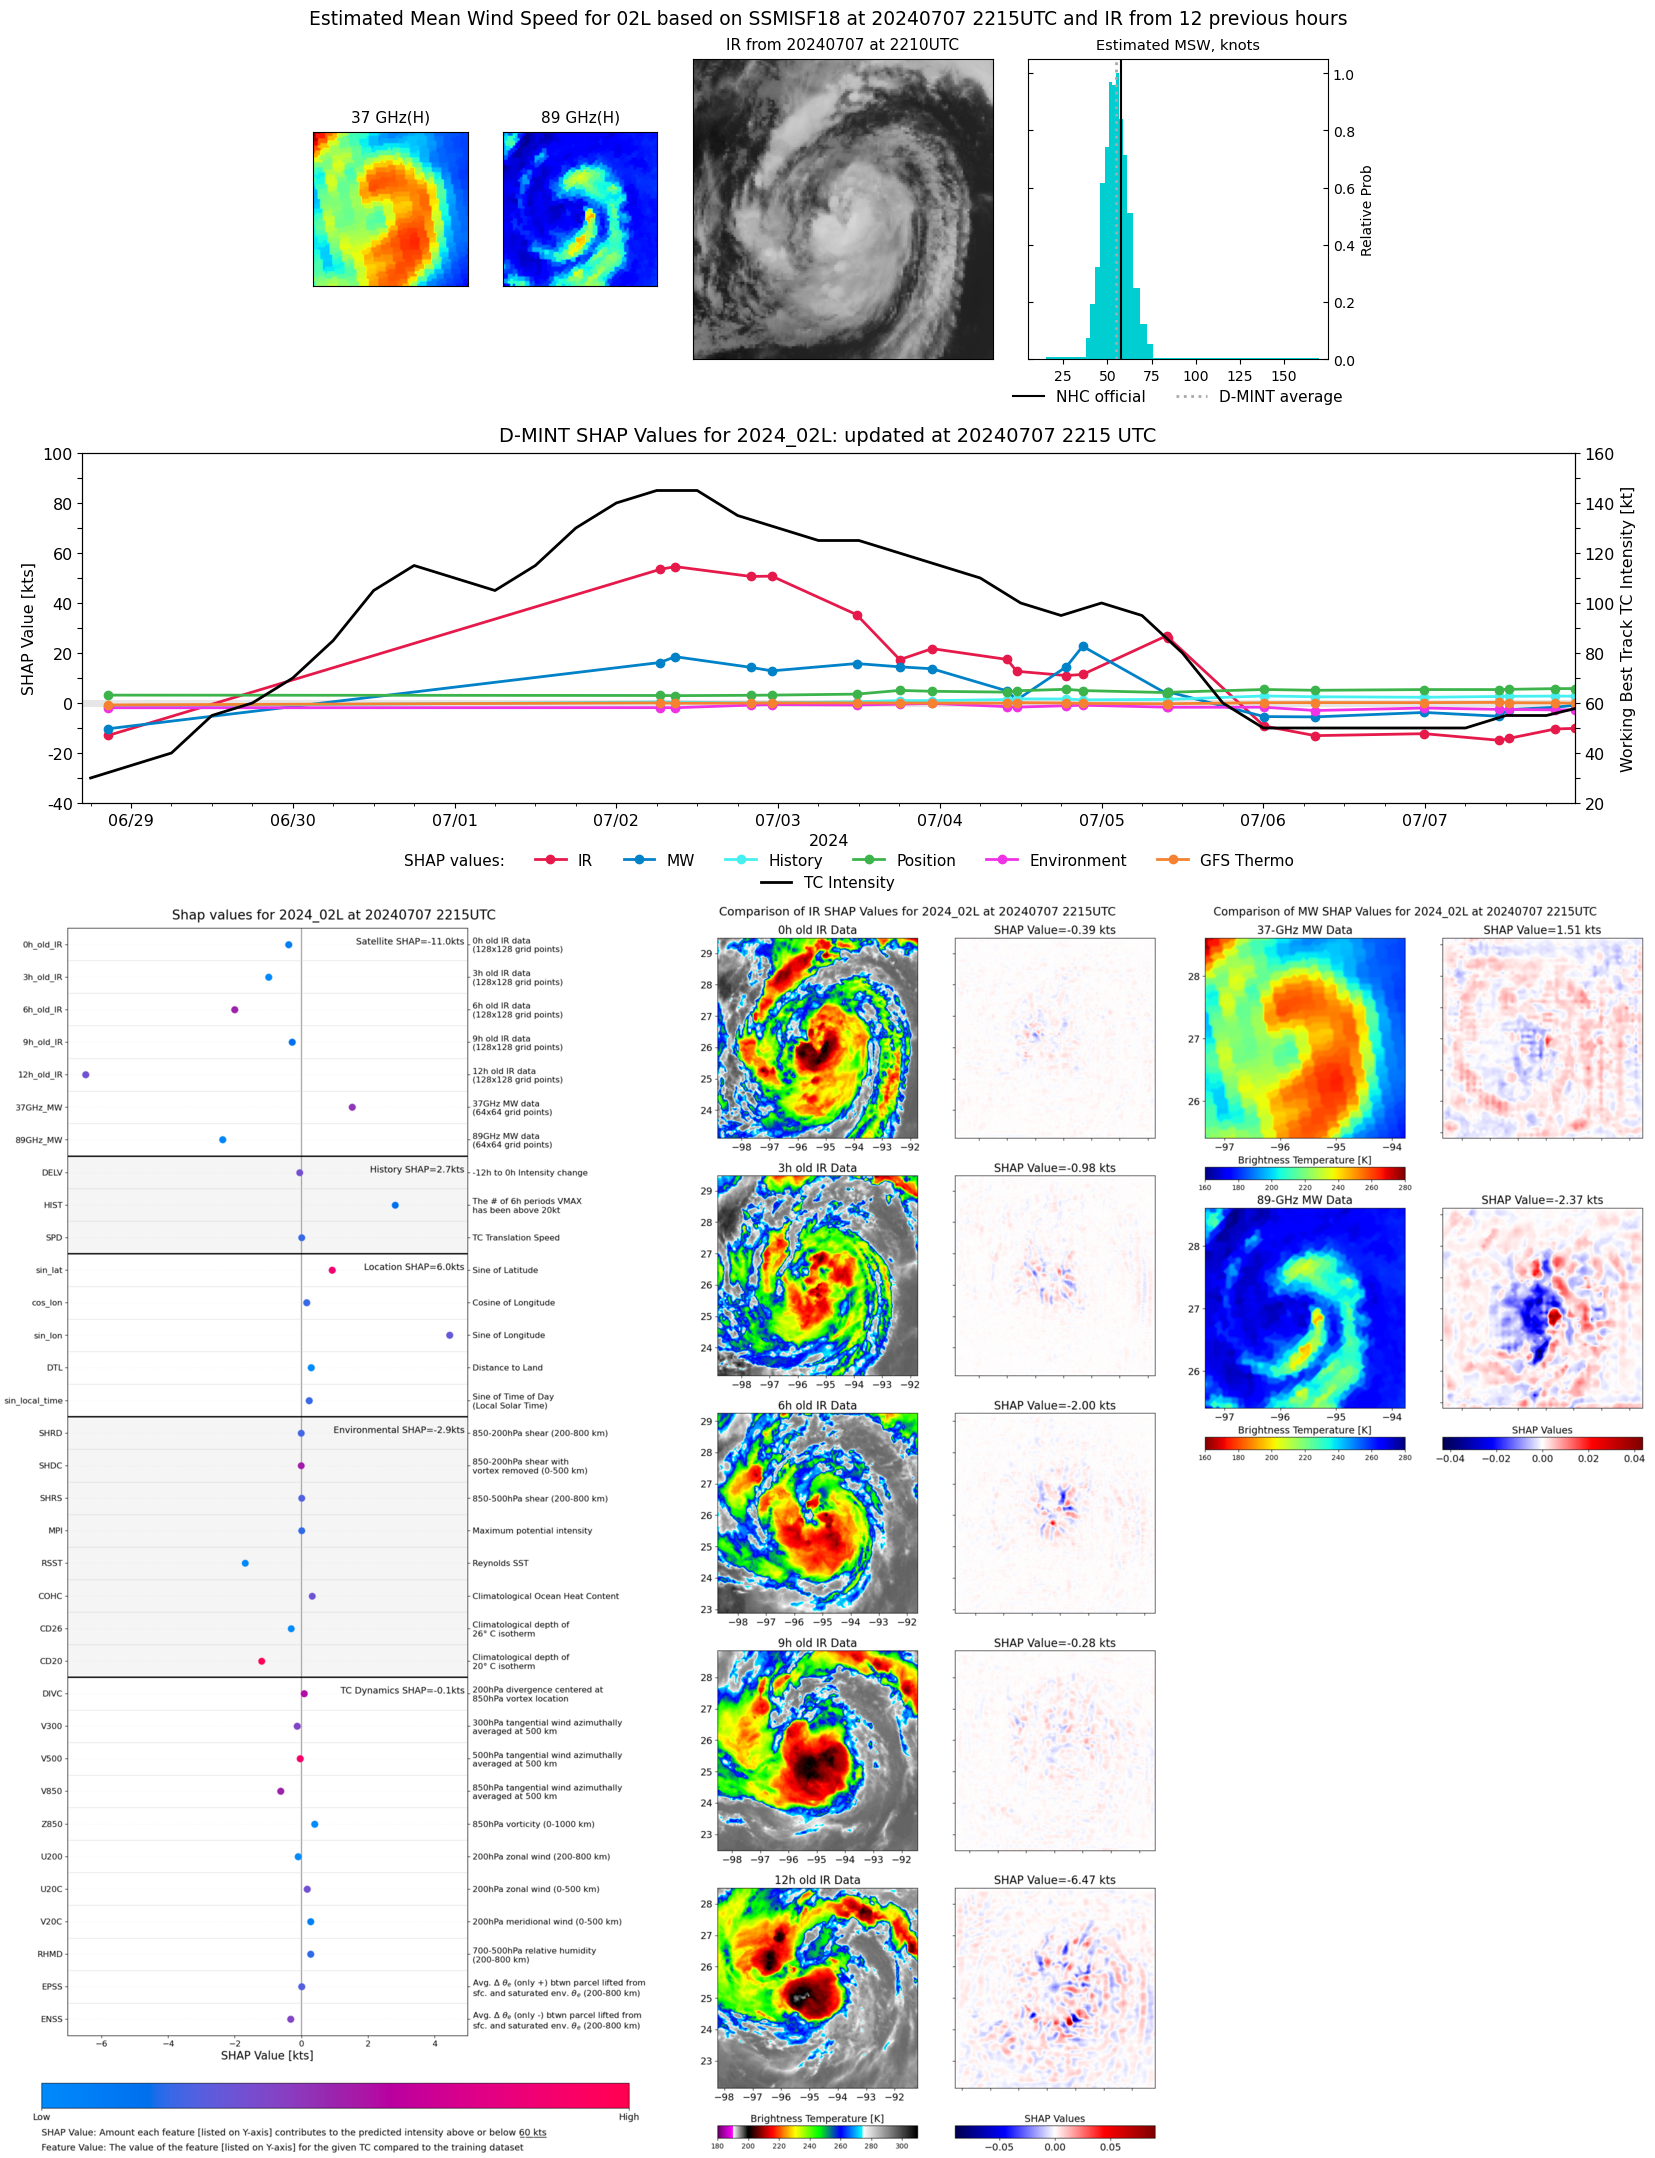 |
| 20240707 | UTC | 20240707 | 1003 hPa | 46 kts | 41 kts | 51 kts | |
| 20240707 | 1920 UTC | AMSR2 | 998 hPa | 54 kts | 49 kts | 59 kts | 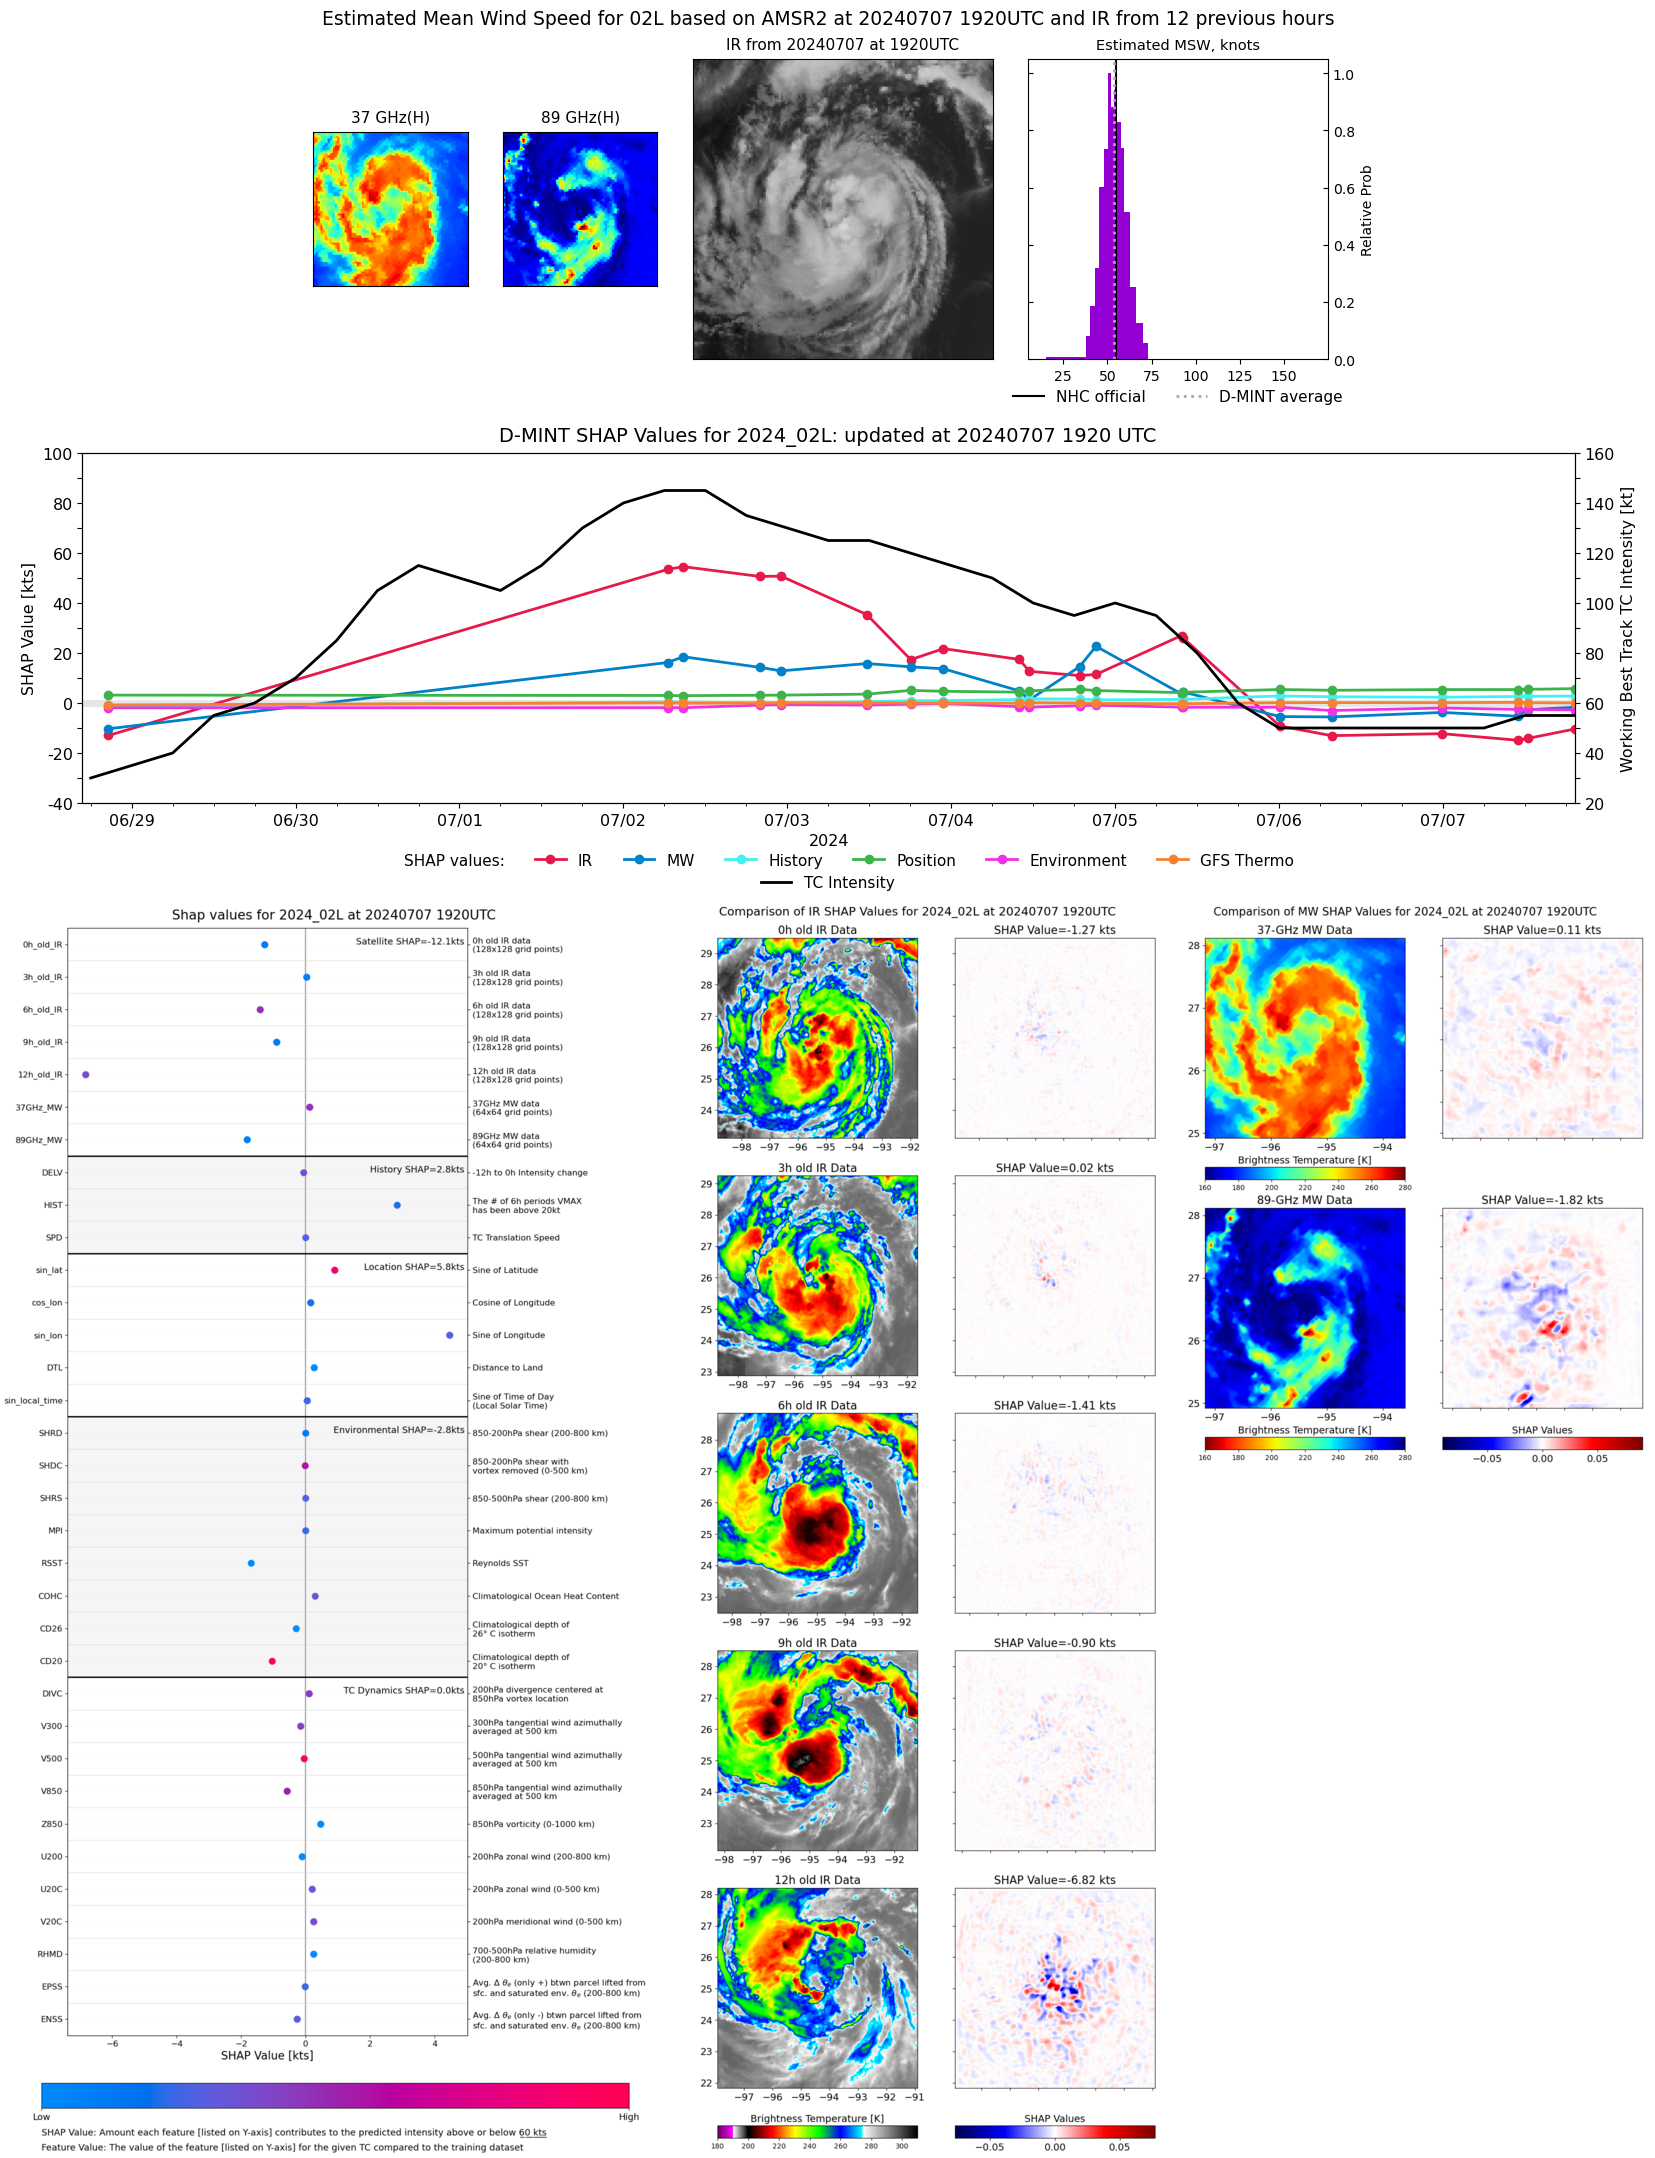 |
| 20240707 | UTC | 20240707 | 1003 hPa | 46 kts | 41 kts | 51 kts | |
| 20240707 | 1656 UTC | TROPICS05 | 999 hPa | 50 kts | 46 kts | 55 kts |  |
| 20240707 | UTC | 20240707 | 1003 hPa | 46 kts | 41 kts | 51 kts | |
| 20240707 | 1224 UTC | SSMISF17 | 1001 hPa | 46 kts | 42 kts | 51 kts | 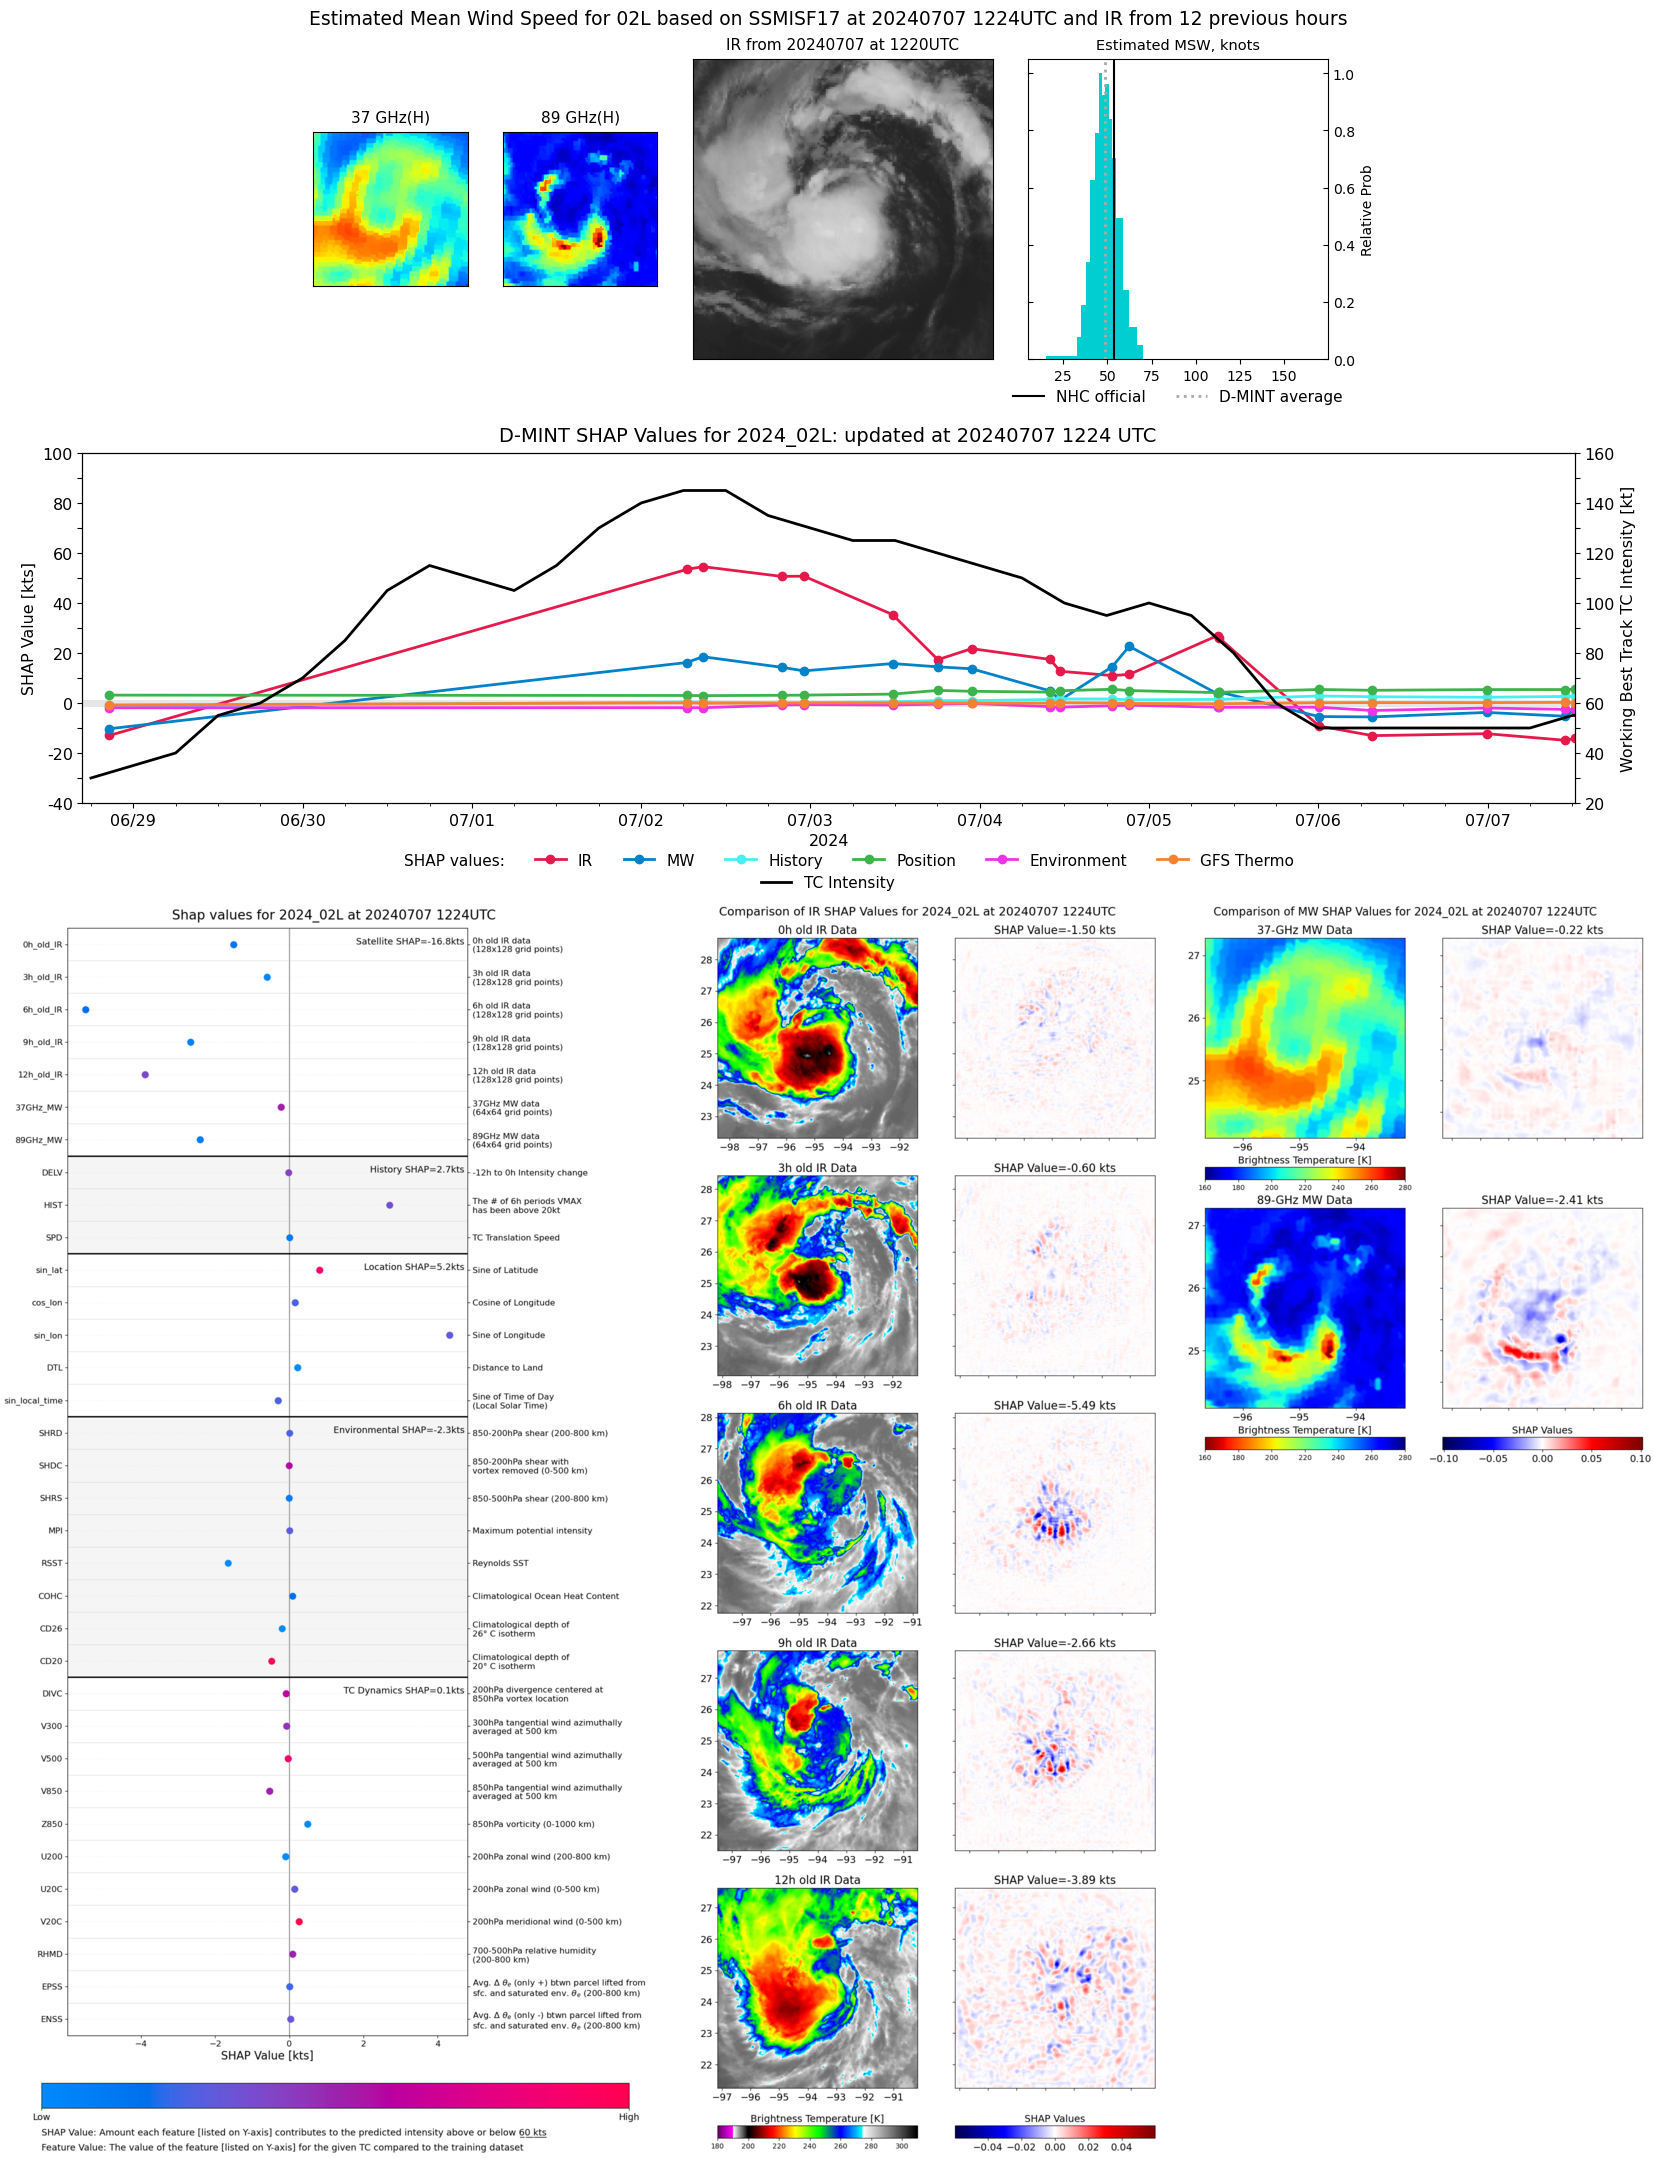 |
| 20240707 | UTC | 20240707 | 1003 hPa | 46 kts | 41 kts | 51 kts | |
| 20240707 | 1154 UTC | TROPICS05 | 994 hPa | 54 kts | 50 kts | 59 kts |  |
| 20240707 | UTC | 20240707 | 1003 hPa | 46 kts | 41 kts | 51 kts | |
| 20240707 | 1058 UTC | SSMISF18 | 1002 hPa | 42 kts | 38 kts | 47 kts | 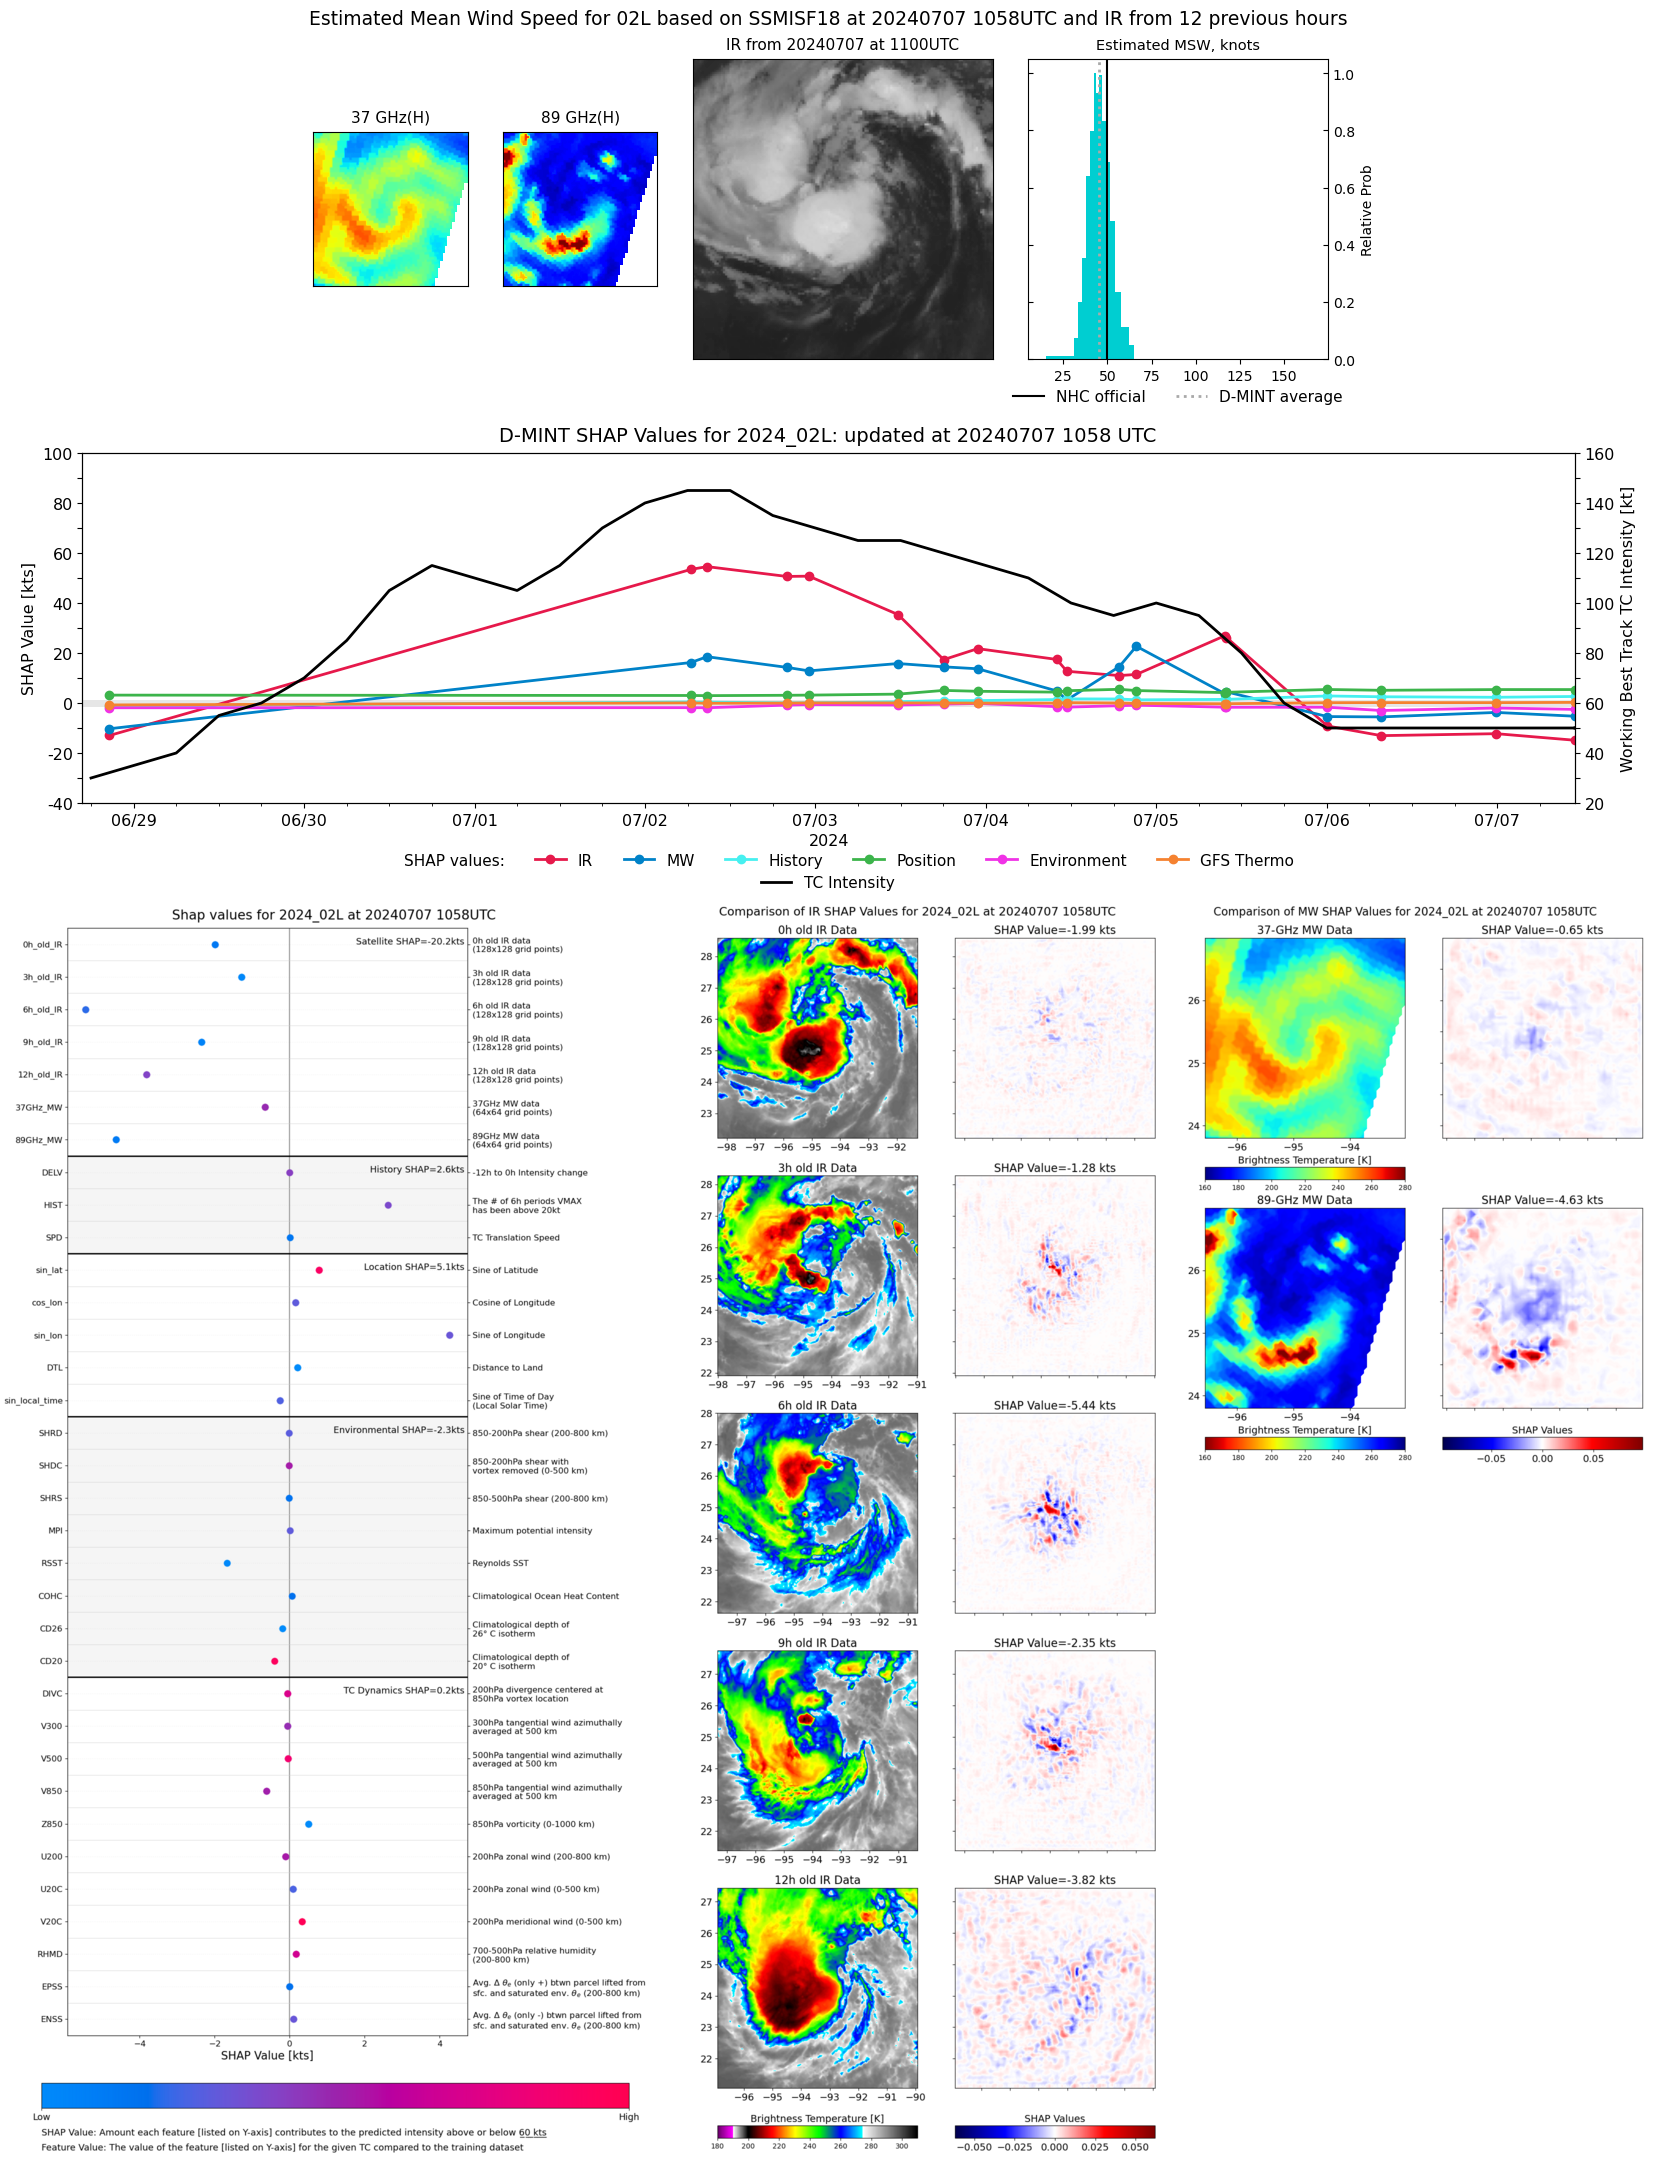 |
| 20240707 | UTC | 20240707 | 1003 hPa | 46 kts | 41 kts | 51 kts | |
| 20240707 | 0823 UTC | AMSR2 | 996 hPa | 52 kts | 47 kts | 57 kts | 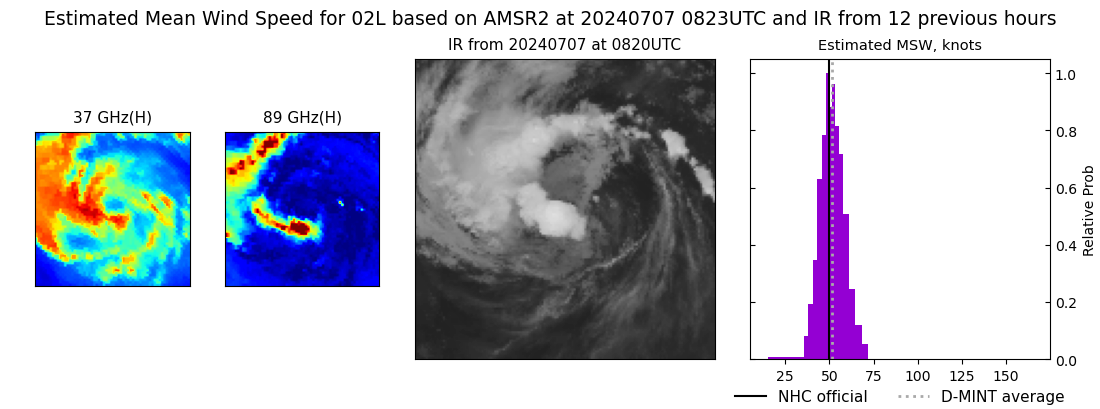 |
| 20240707 | UTC | 20240707 | 1003 hPa | 46 kts | 41 kts | 51 kts | |
| 20240707 | 0504 UTC | TROPICS03 | 1003 hPa | 46 kts | 41 kts | 51 kts | 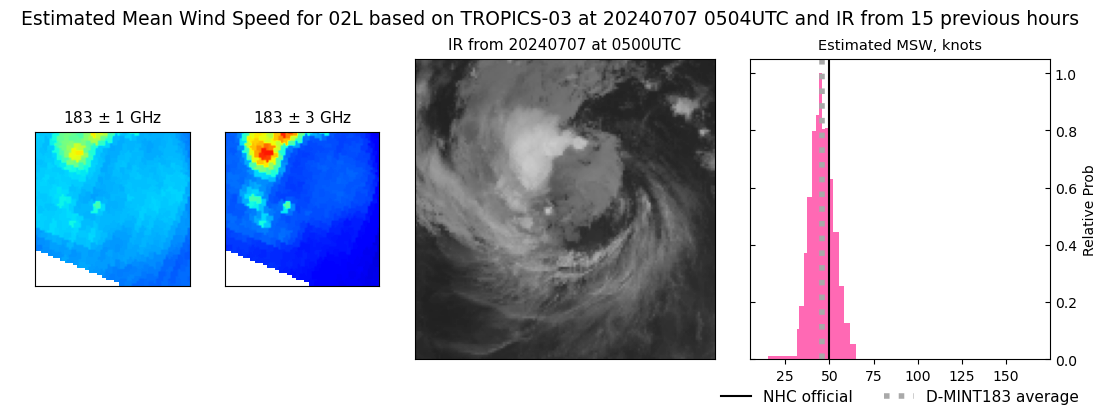 |
| 20240706 | UTC | 20240706 | 995 hPa | 52 kts | 46 kts | 59 kts | |
| 20240706 | 2354 UTC | SSMISF17 | 1001 hPa | 51 kts | 46 kts | 56 kts | 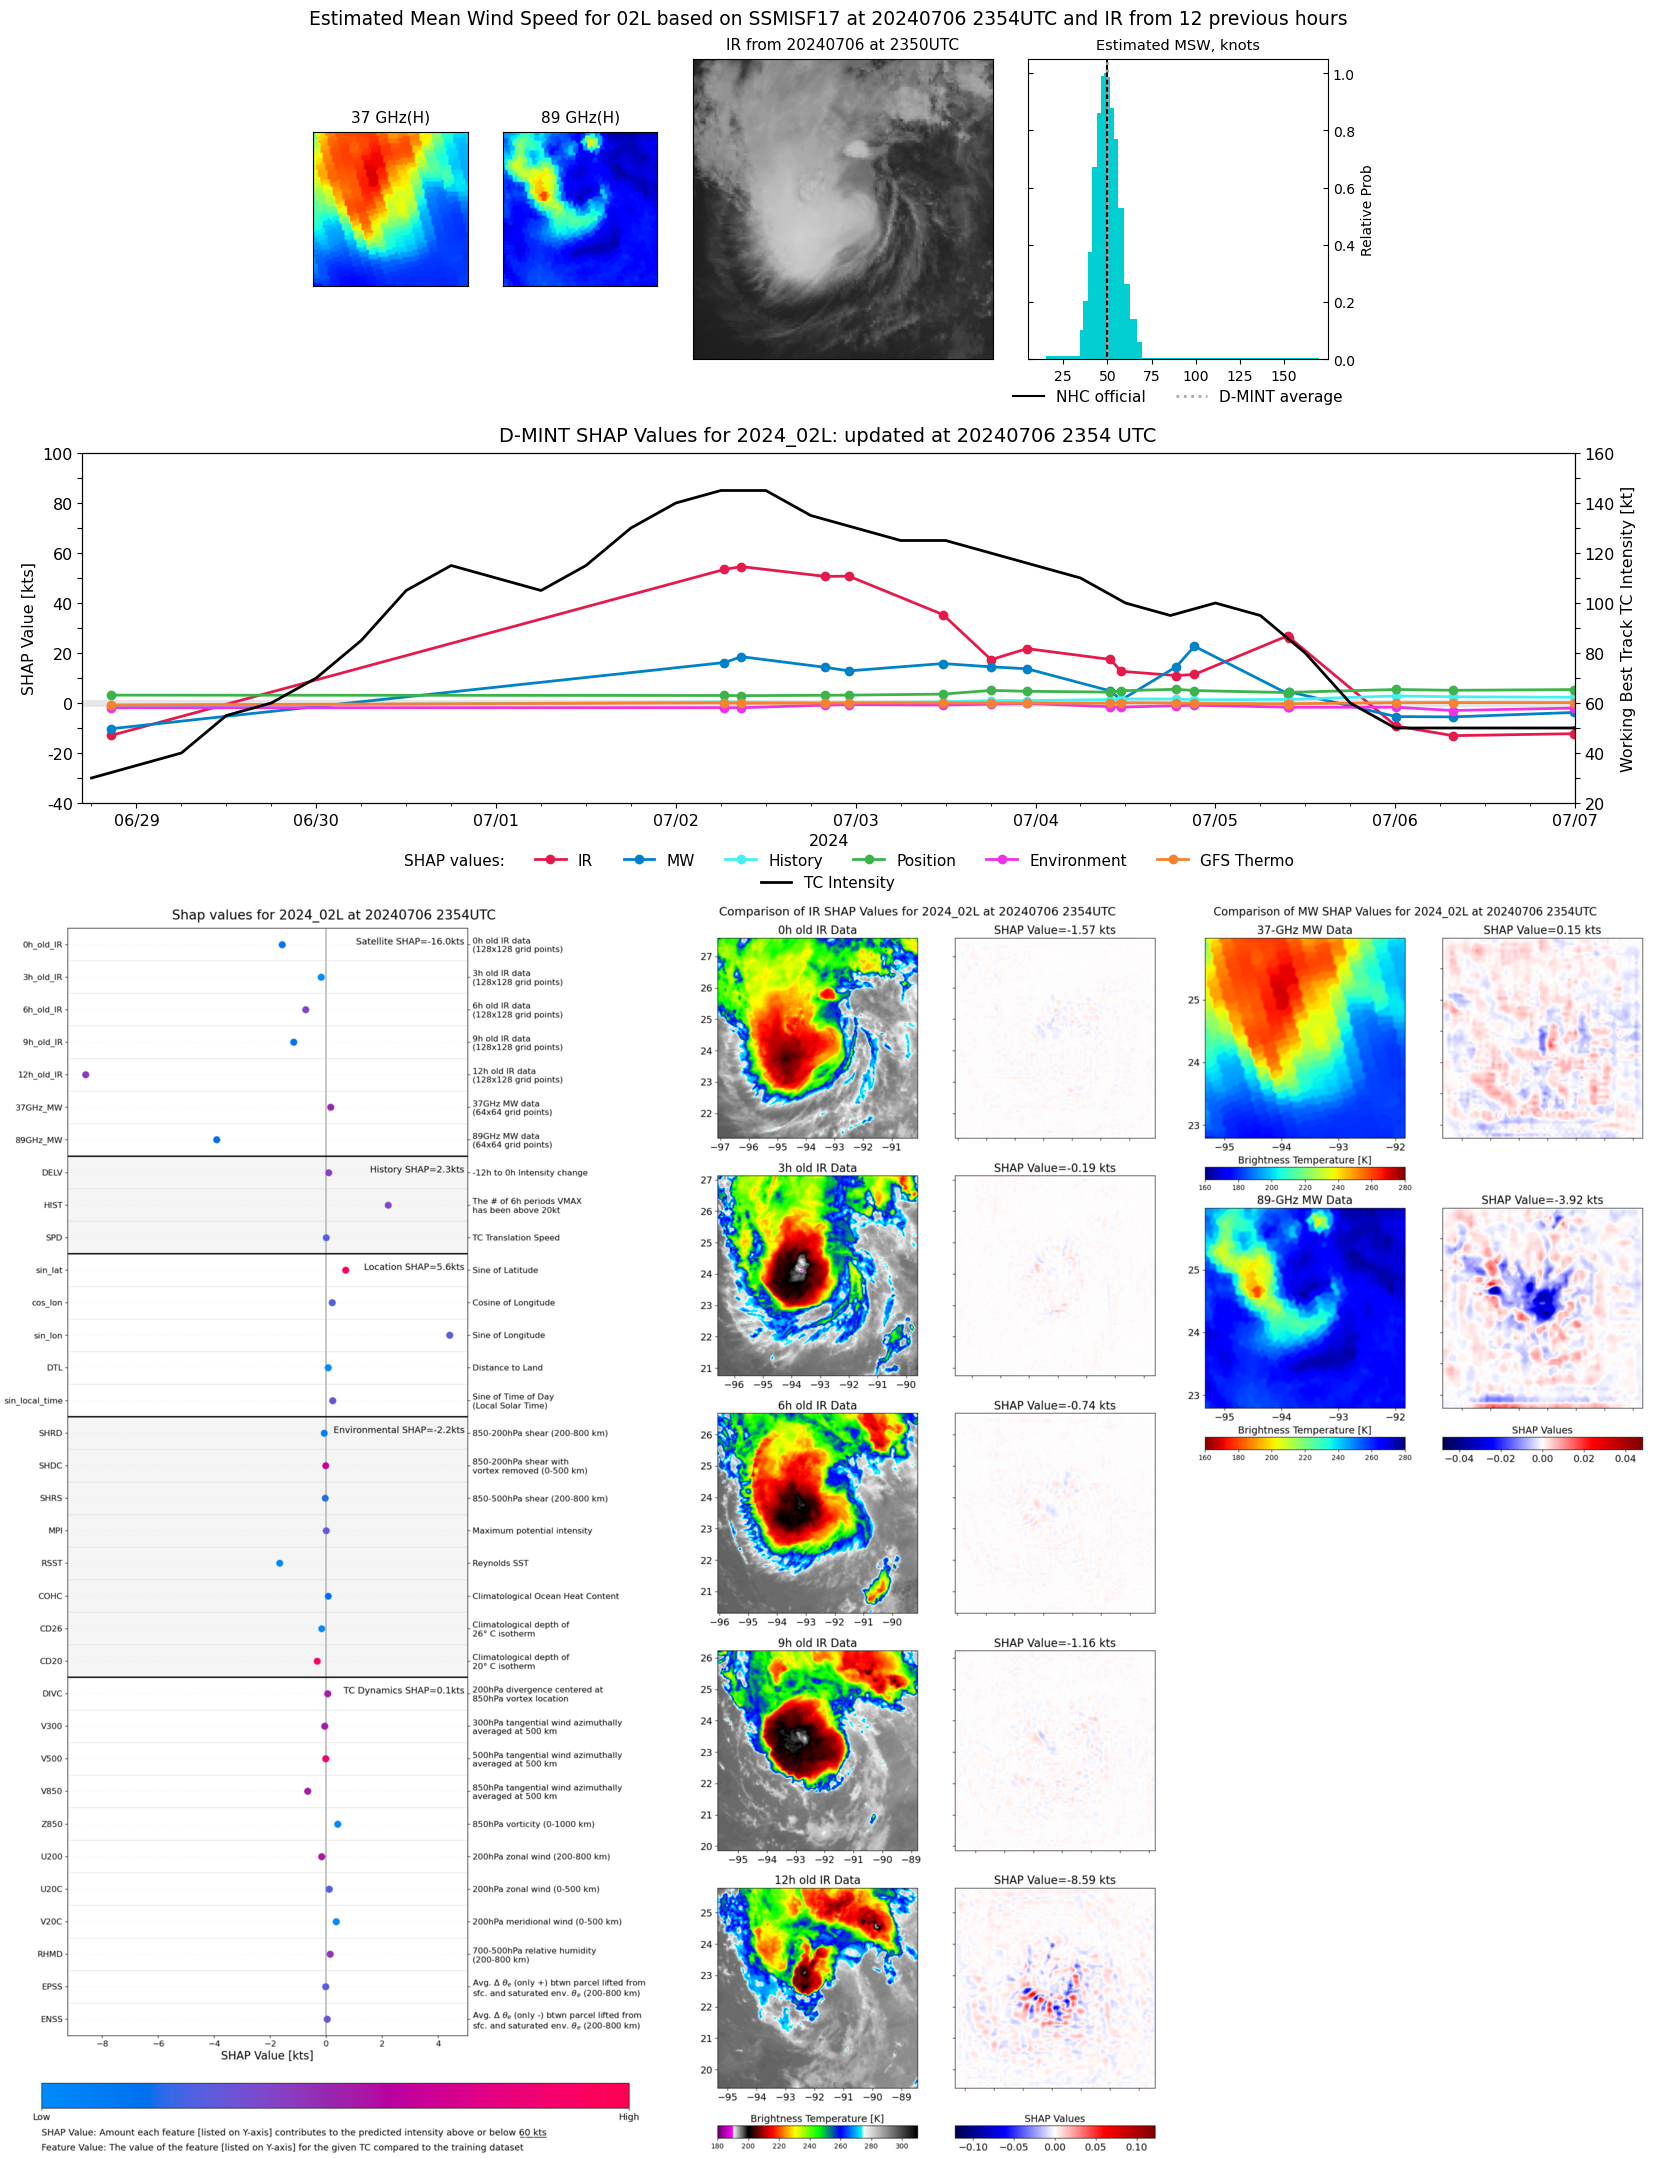 |
| 20240706 | UTC | 20240706 | 995 hPa | 52 kts | 46 kts | 59 kts | |
| 20240706 | 1733 UTC | TROPICS06 | 1006 hPa | 36 kts | 33 kts | 40 kts | 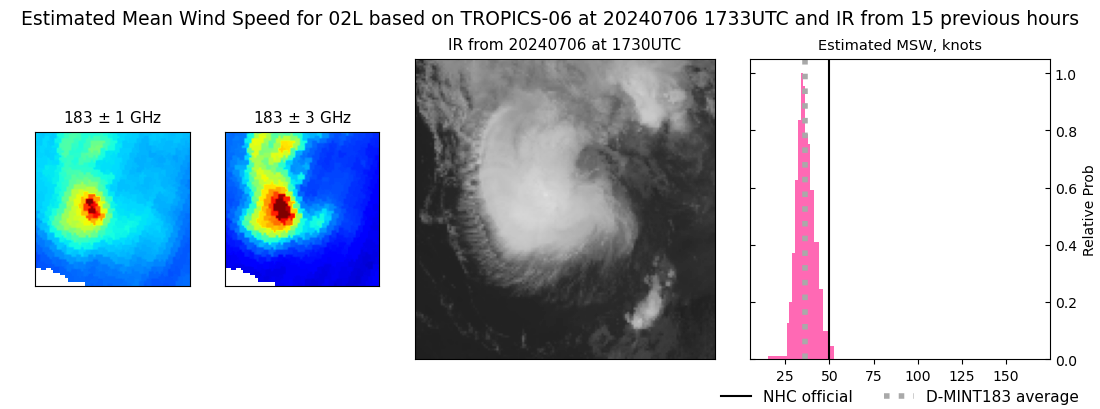 |
| 20240706 | UTC | 20240706 | 995 hPa | 52 kts | 46 kts | 59 kts | |
| 20240706 | 1238 UTC | SSMISF17 | 1004 hPa | 35 kts | 31 kts | 40 kts | 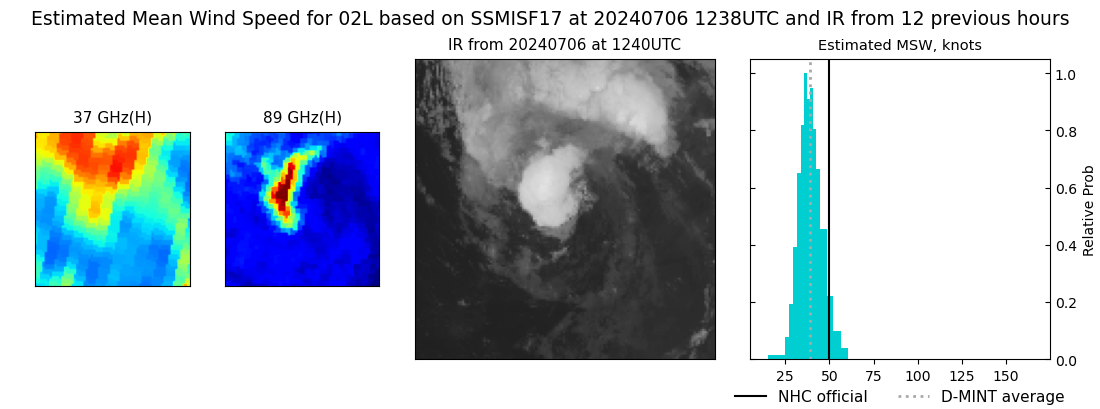 |
| 20240706 | UTC | 20240706 | 995 hPa | 52 kts | 46 kts | 59 kts | |
| 20240706 | 0741 UTC | AMSR2 | 1001 hPa | 46 kts | 41 kts | 51 kts | 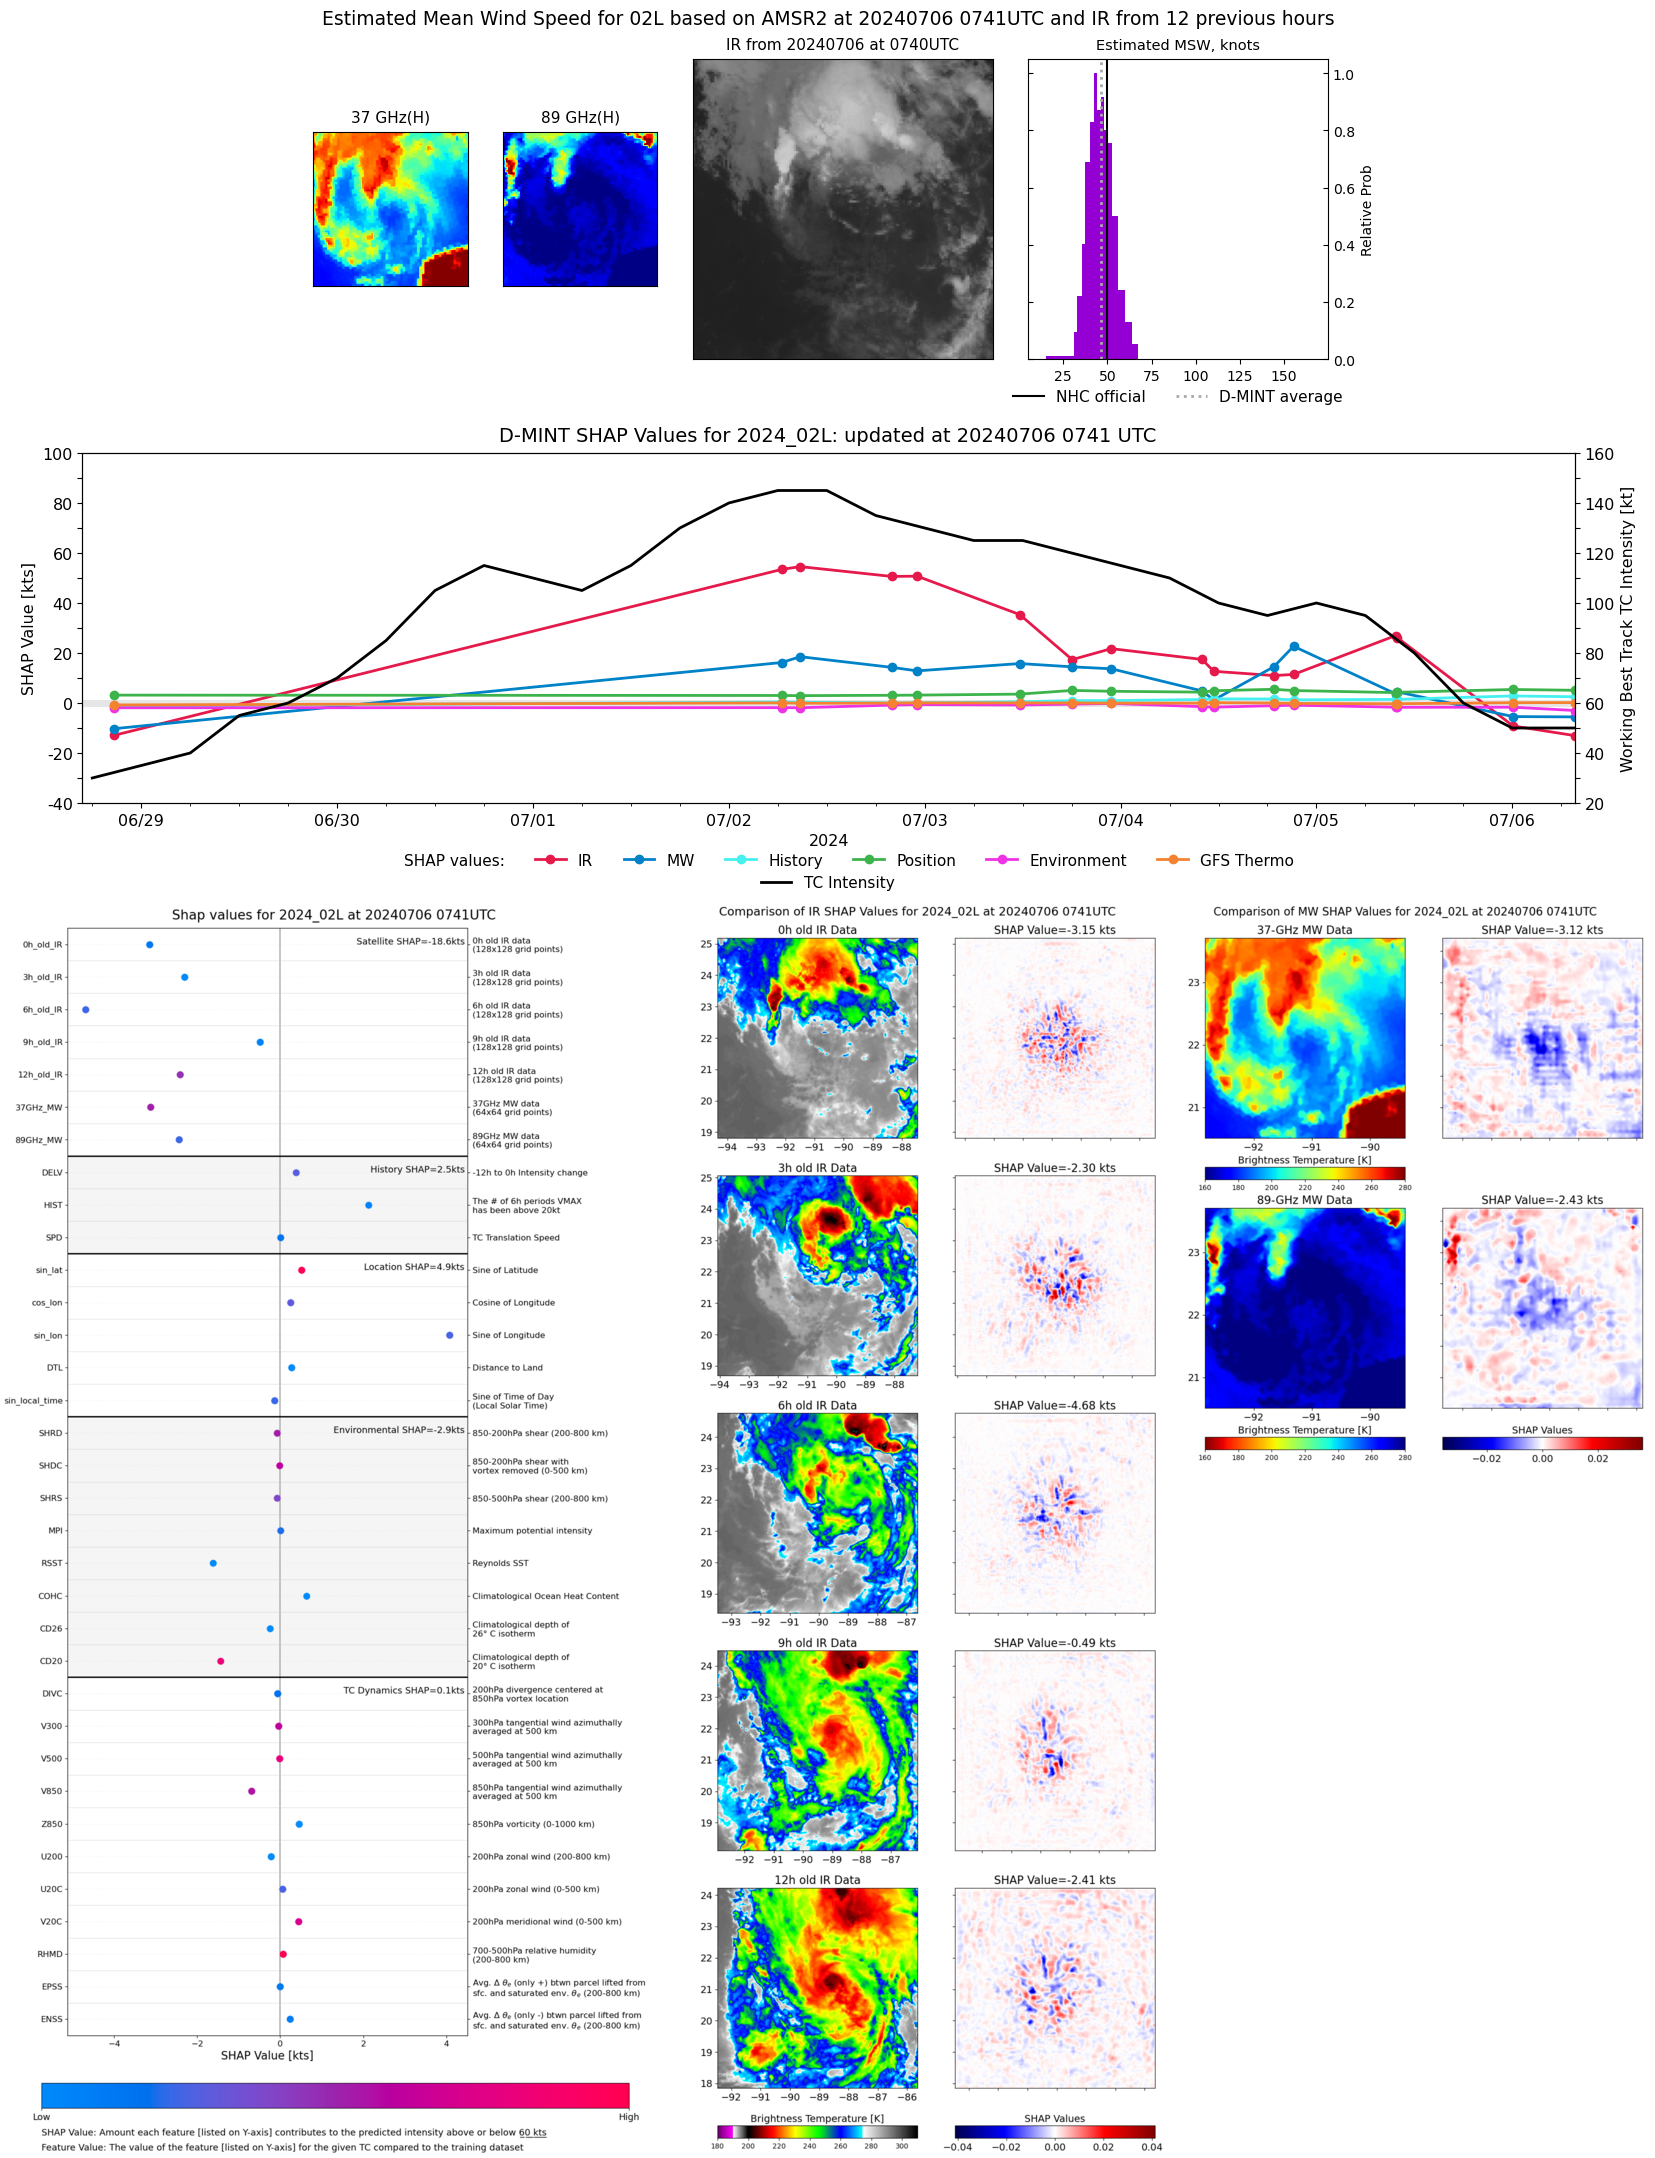 |
| 20240706 | UTC | 20240706 | 995 hPa | 52 kts | 46 kts | 59 kts | |
| 20240706 | 0006 UTC | SSMISF17 | 995 hPa | 52 kts | 46 kts | 59 kts | 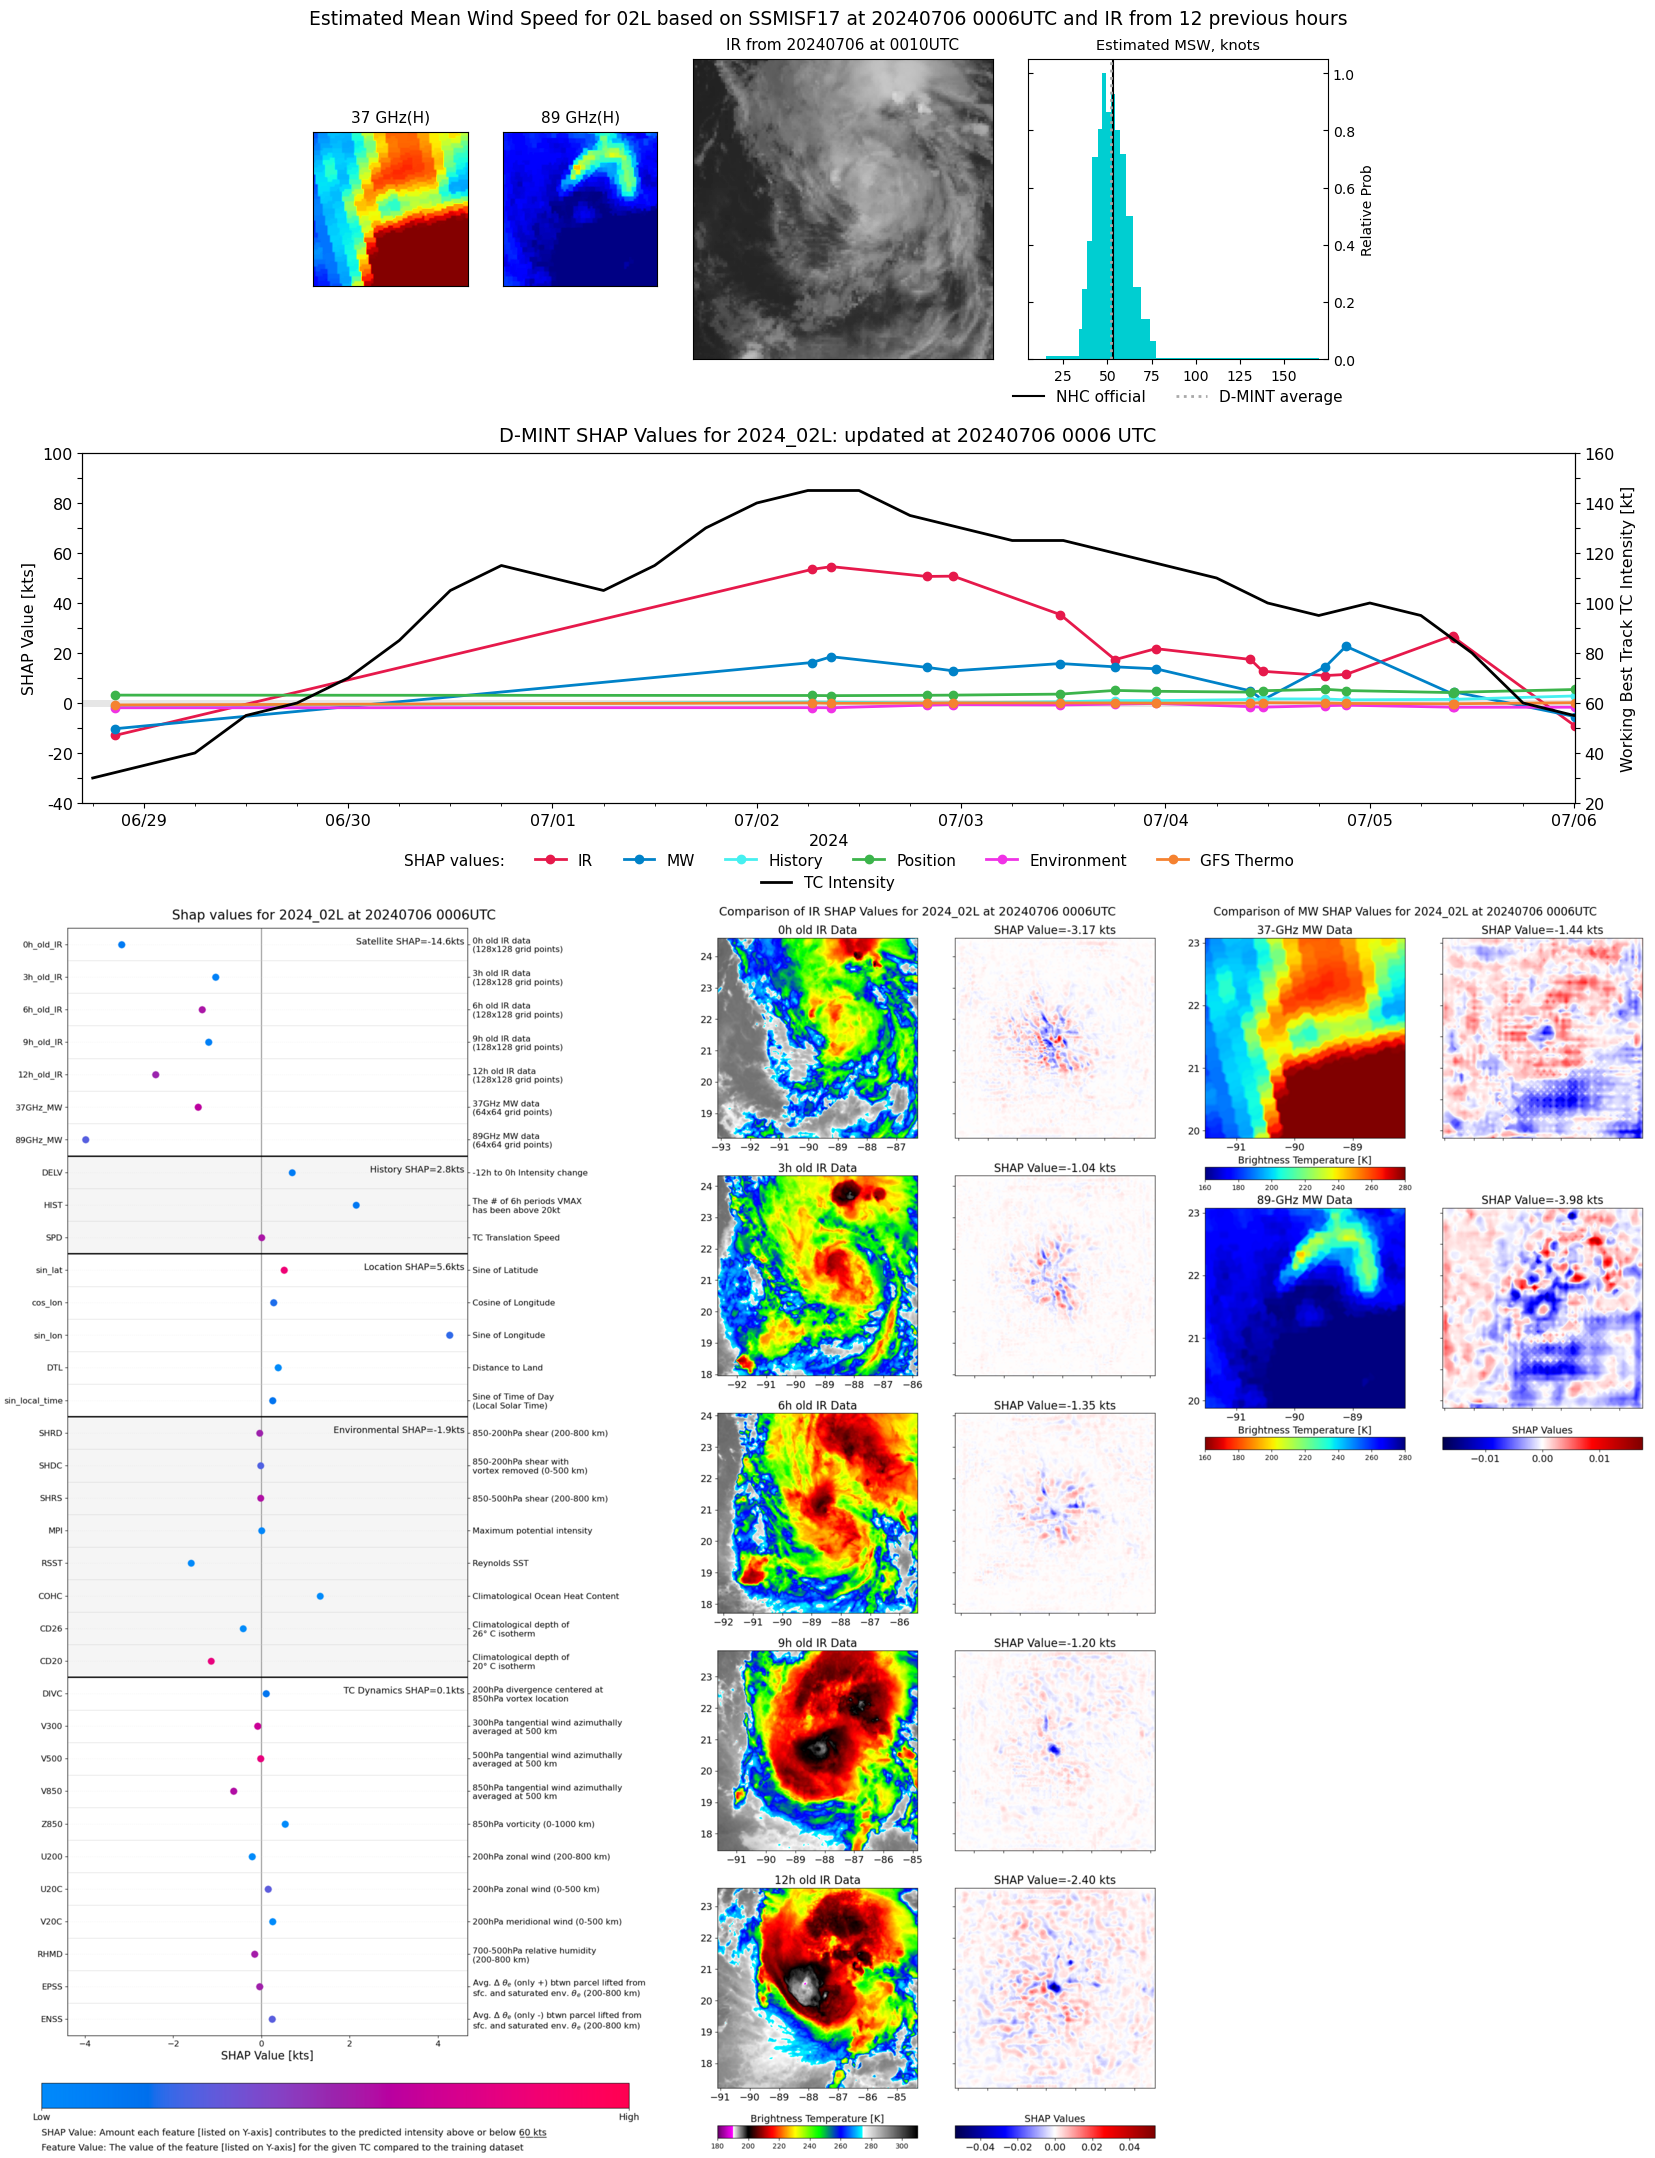 |
| 20240705 | UTC | 20240705 | 968 hPa | 94 kts | 86 kts | 103 kts | |
| 20240705 | 1931 UTC | AMSR2 | 993 hPa | 55 kts | 48 kts | 63 kts | 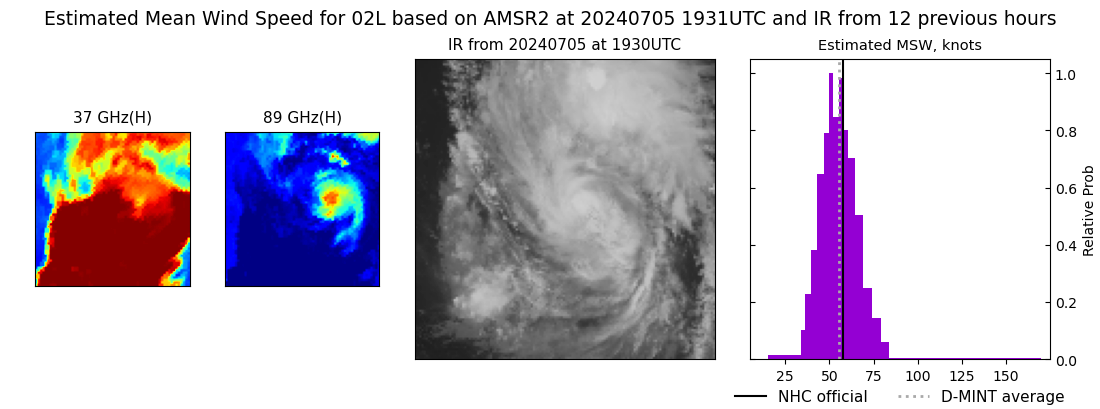 |
| 20240705 | UTC | 20240705 | 968 hPa | 94 kts | 86 kts | 103 kts | |
| 20240705 | 0953 UTC | GMI | 974 hPa | 94 kts | 86 kts | 103 kts | 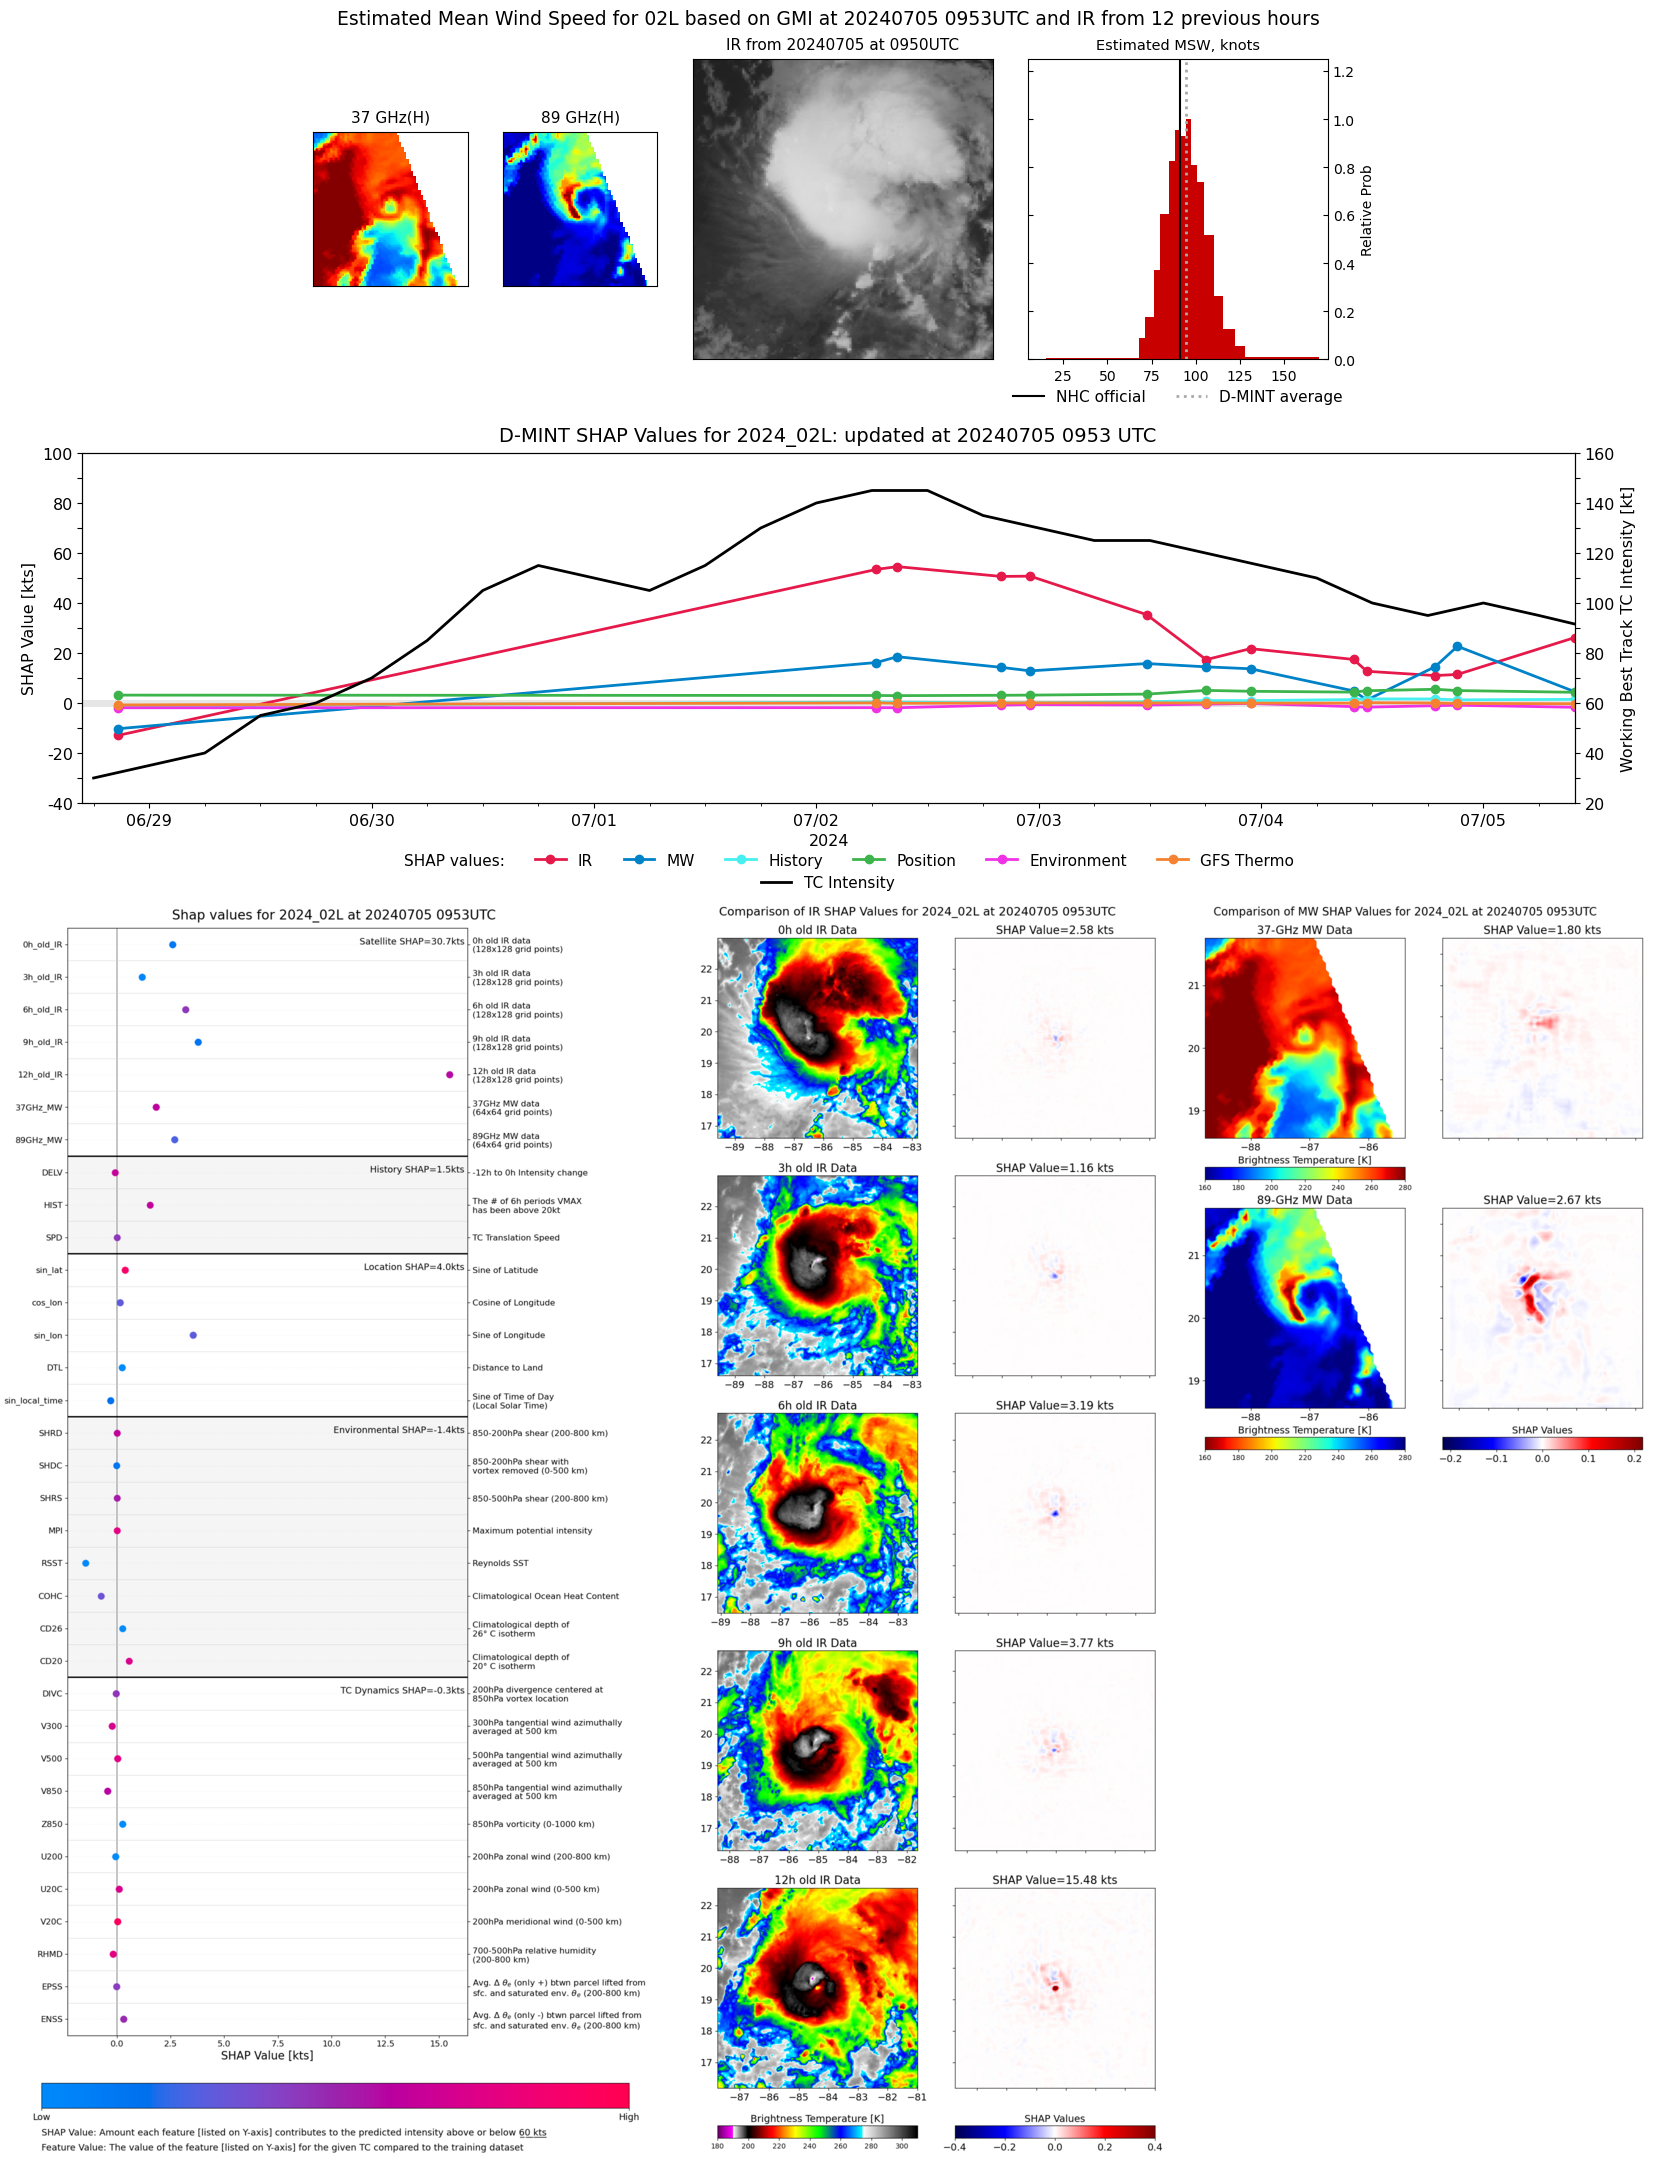 |
| 20240705 | UTC | 20240705 | 968 hPa | 94 kts | 86 kts | 103 kts | |
| 20240705 | 0944 UTC | SSMISF18 | 968 hPa | 94 kts | 86 kts | 103 kts | 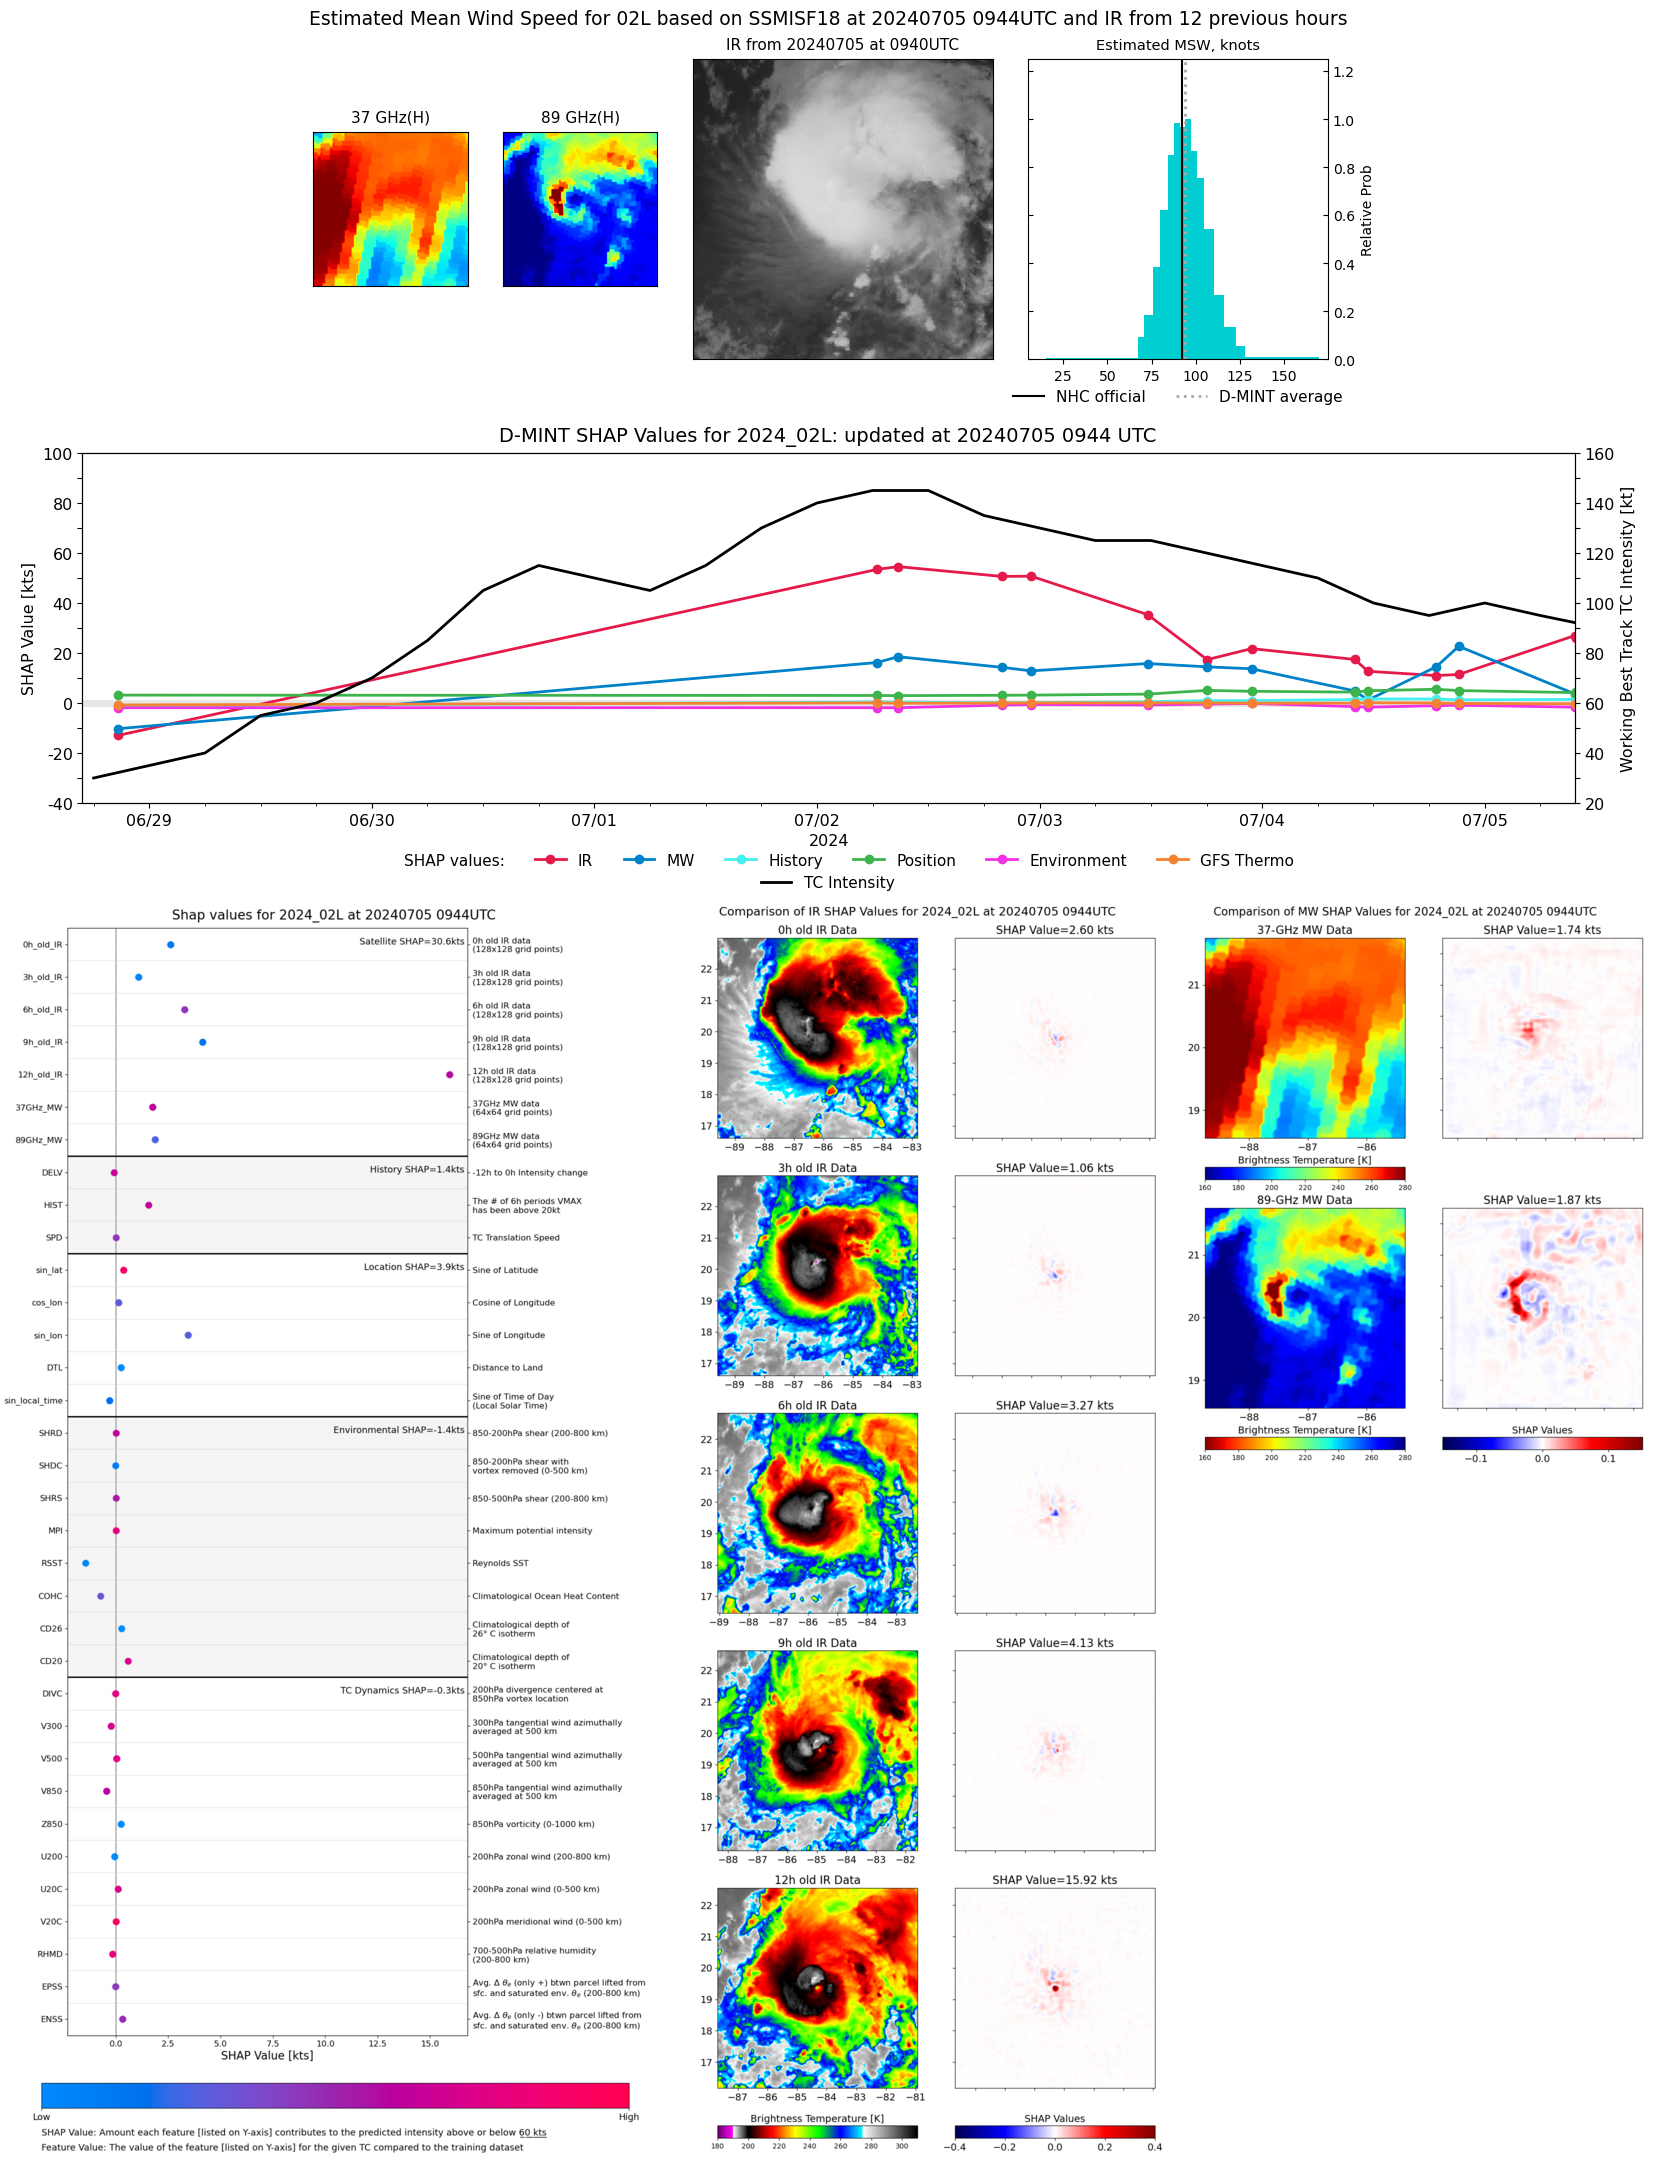 |
| 20240704 | UTC | 20240704 | 973 hPa | 86 kts | 78 kts | 94 kts | |
| 20240704 | 2302 UTC | TROPICS03 | 970 hPa | 91 kts | 84 kts | 99 kts | 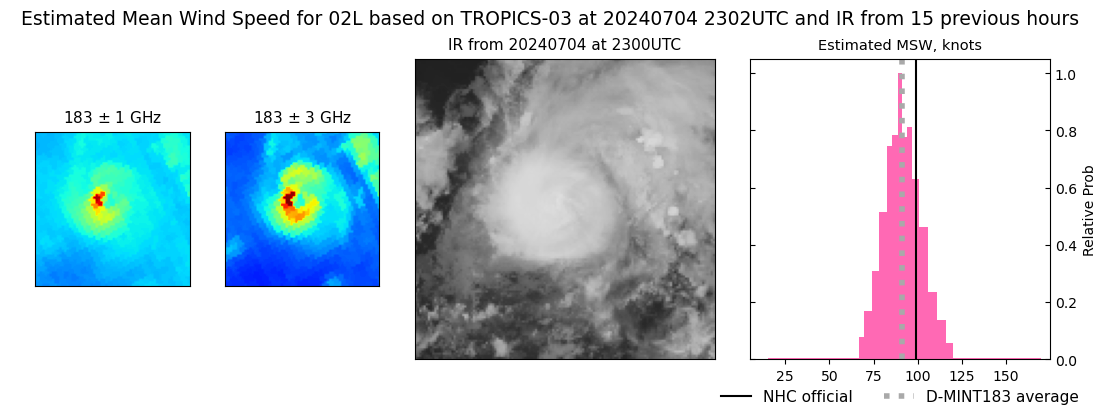 |
| 20240704 | UTC | 20240704 | 973 hPa | 86 kts | 78 kts | 94 kts | |
| 20240704 | 2112 UTC | SSMISF18 | 969 hPa | 99 kts | 91 kts | 107 kts | 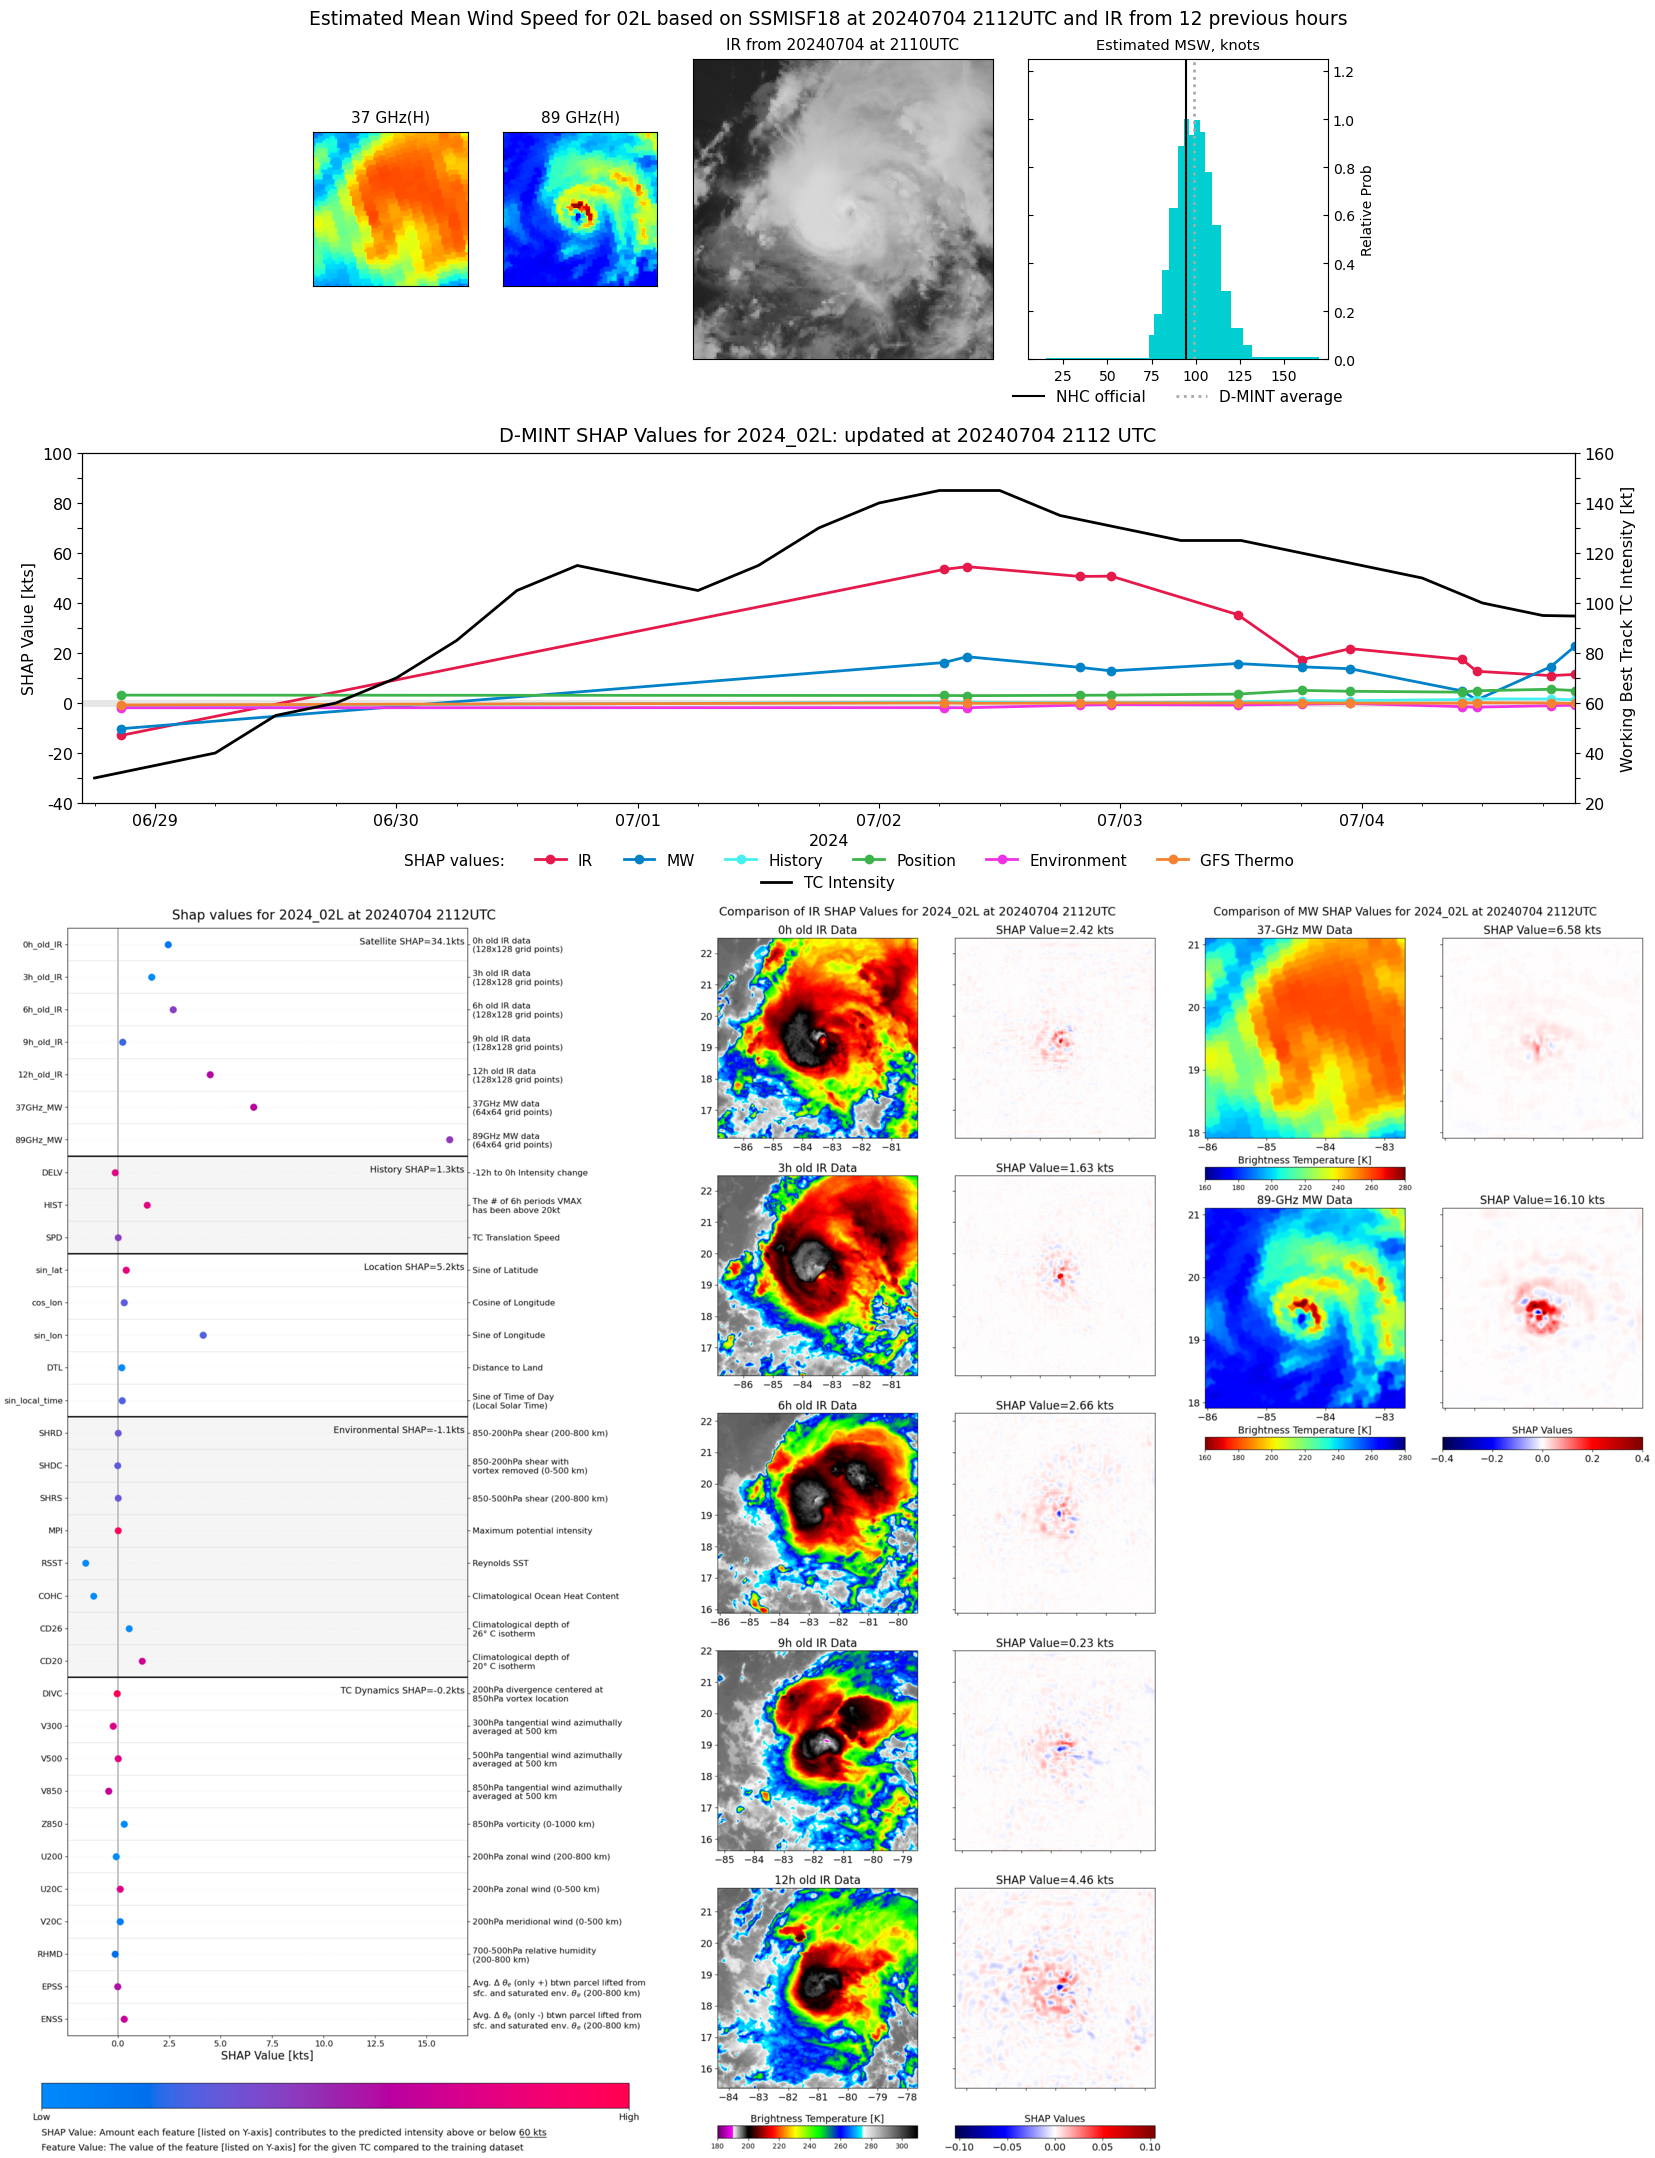 |
| 20240704 | UTC | 20240704 | 973 hPa | 86 kts | 78 kts | 94 kts | |
| 20240704 | 1847 UTC | AMSR2 | 976 hPa | 91 kts | 84 kts | 100 kts | 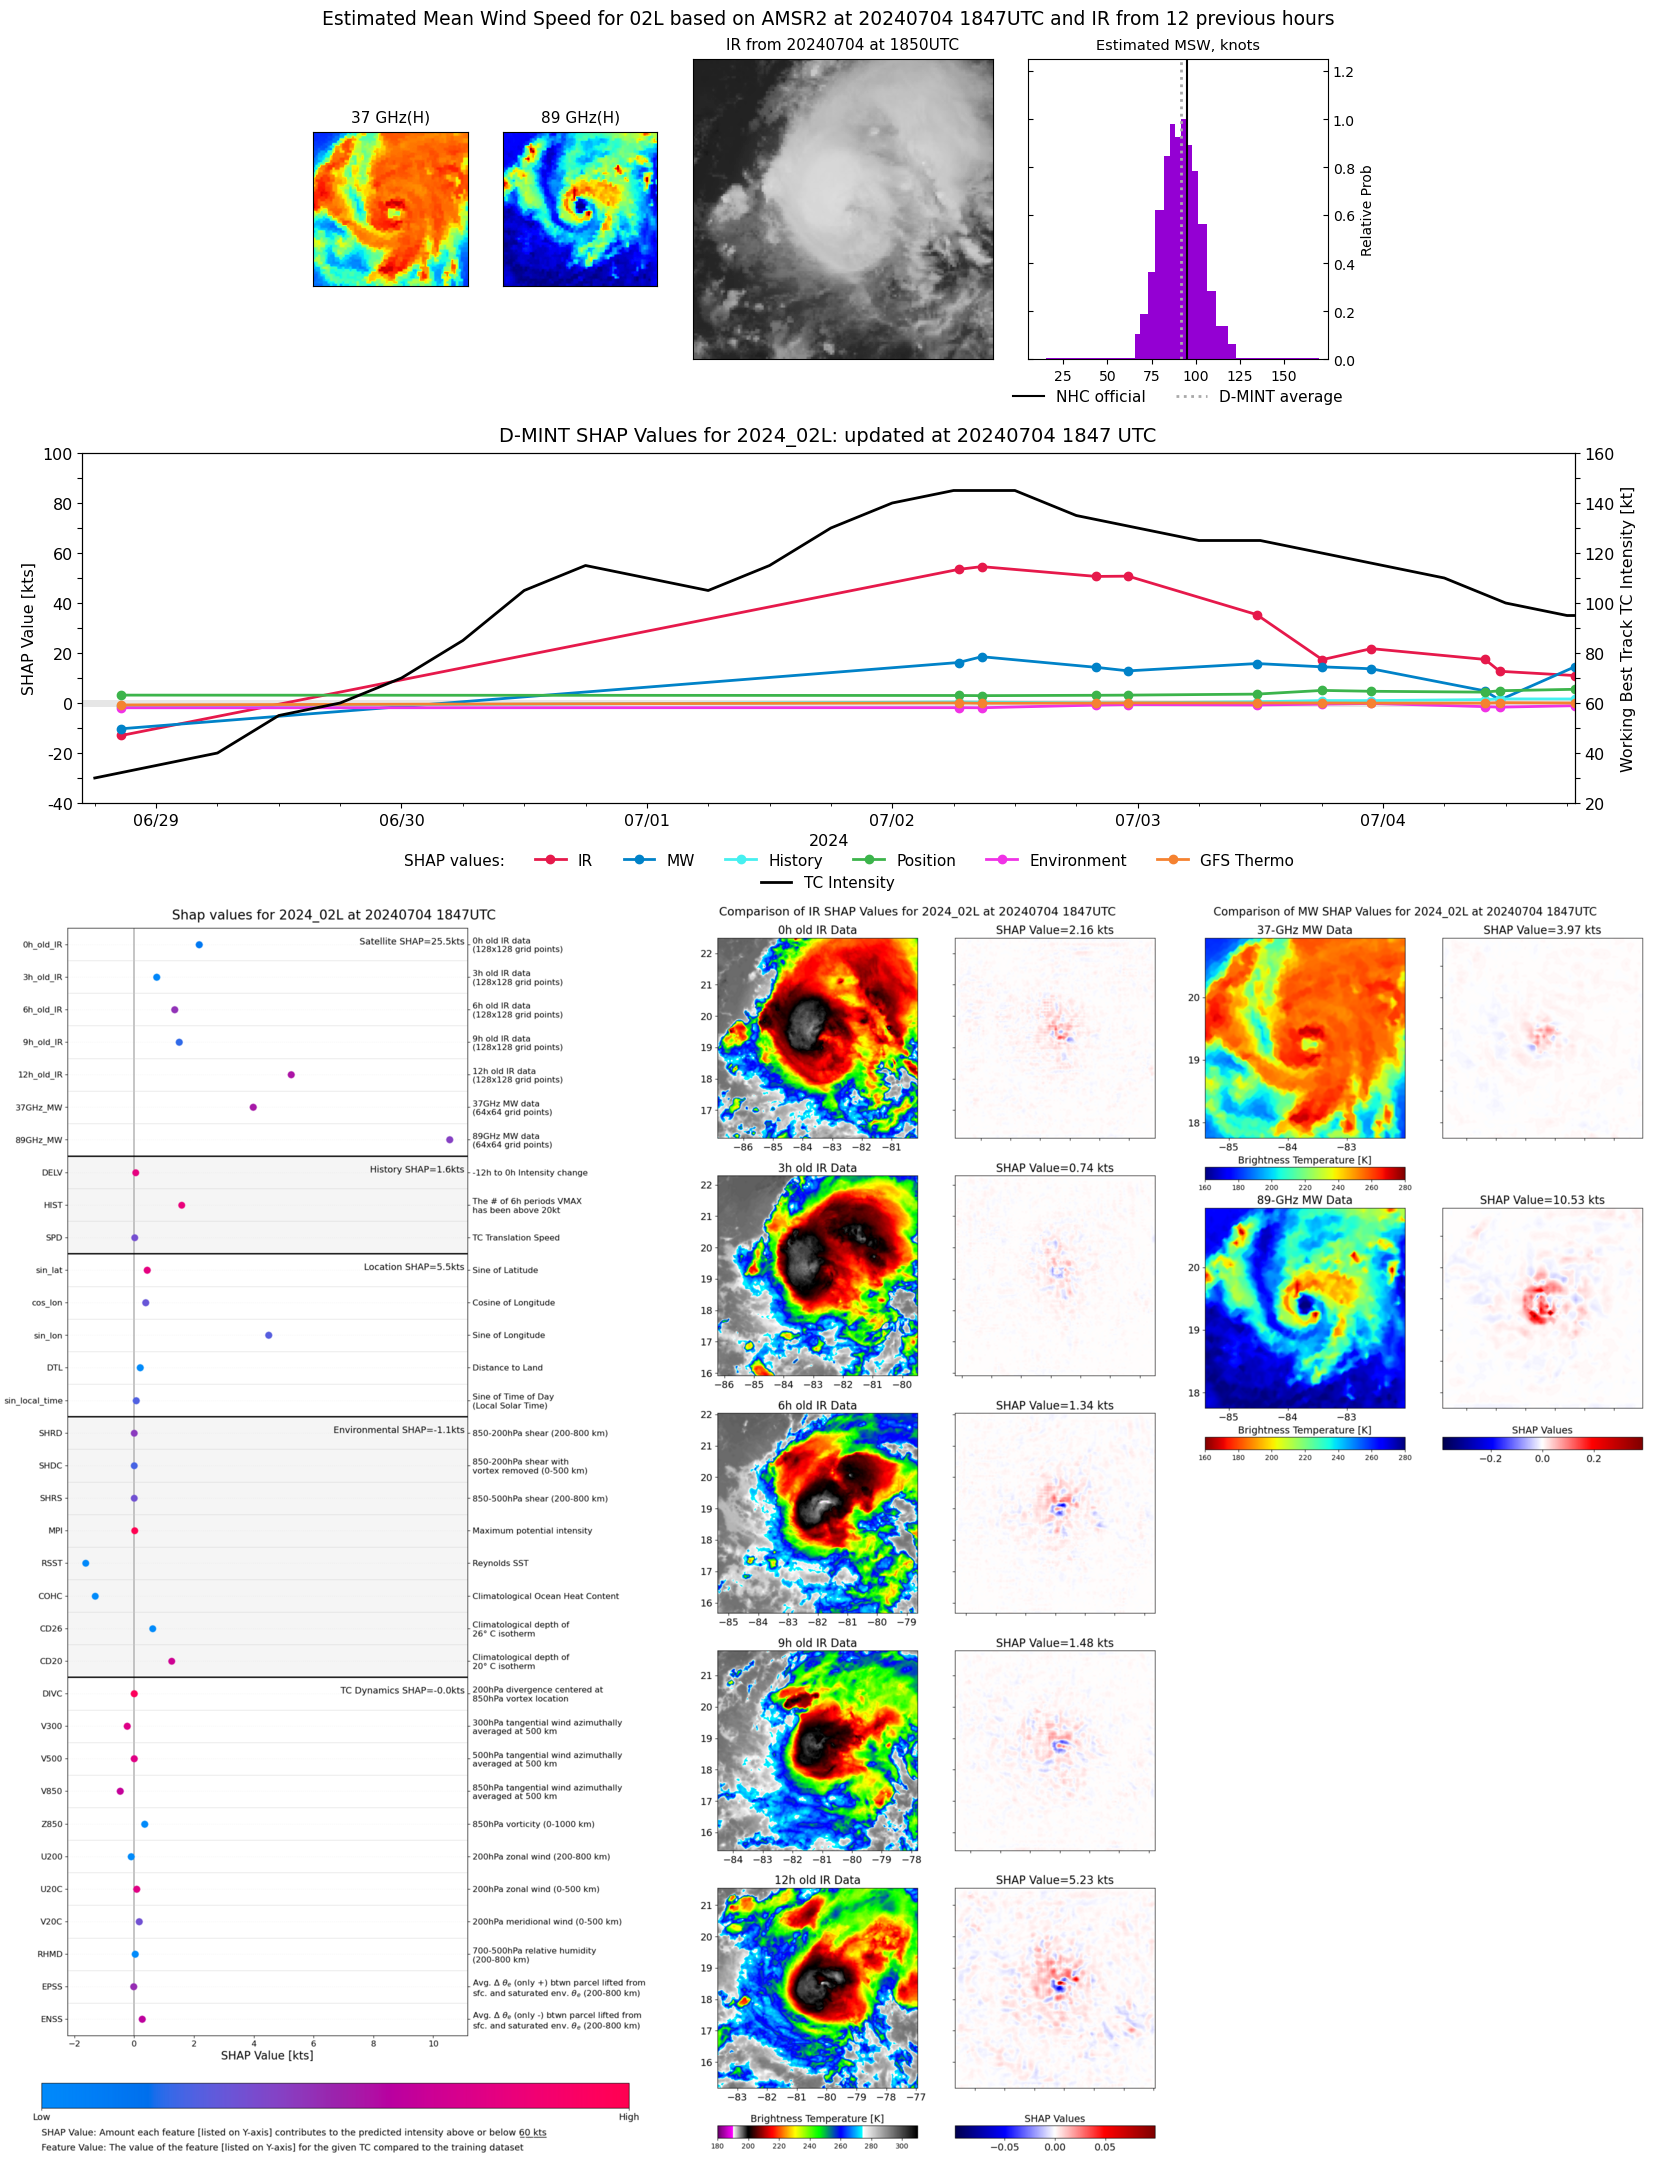 |
| 20240704 | UTC | 20240704 | 973 hPa | 86 kts | 78 kts | 94 kts | |
| 20240704 | 1125 UTC | SSMISF17 | 981 hPa | 82 kts | 74 kts | 91 kts |  |
| 20240704 | UTC | 20240704 | 973 hPa | 86 kts | 78 kts | 94 kts | |
| 20240704 | 0959 UTC | SSMISF18 | 973 hPa | 86 kts | 78 kts | 94 kts | 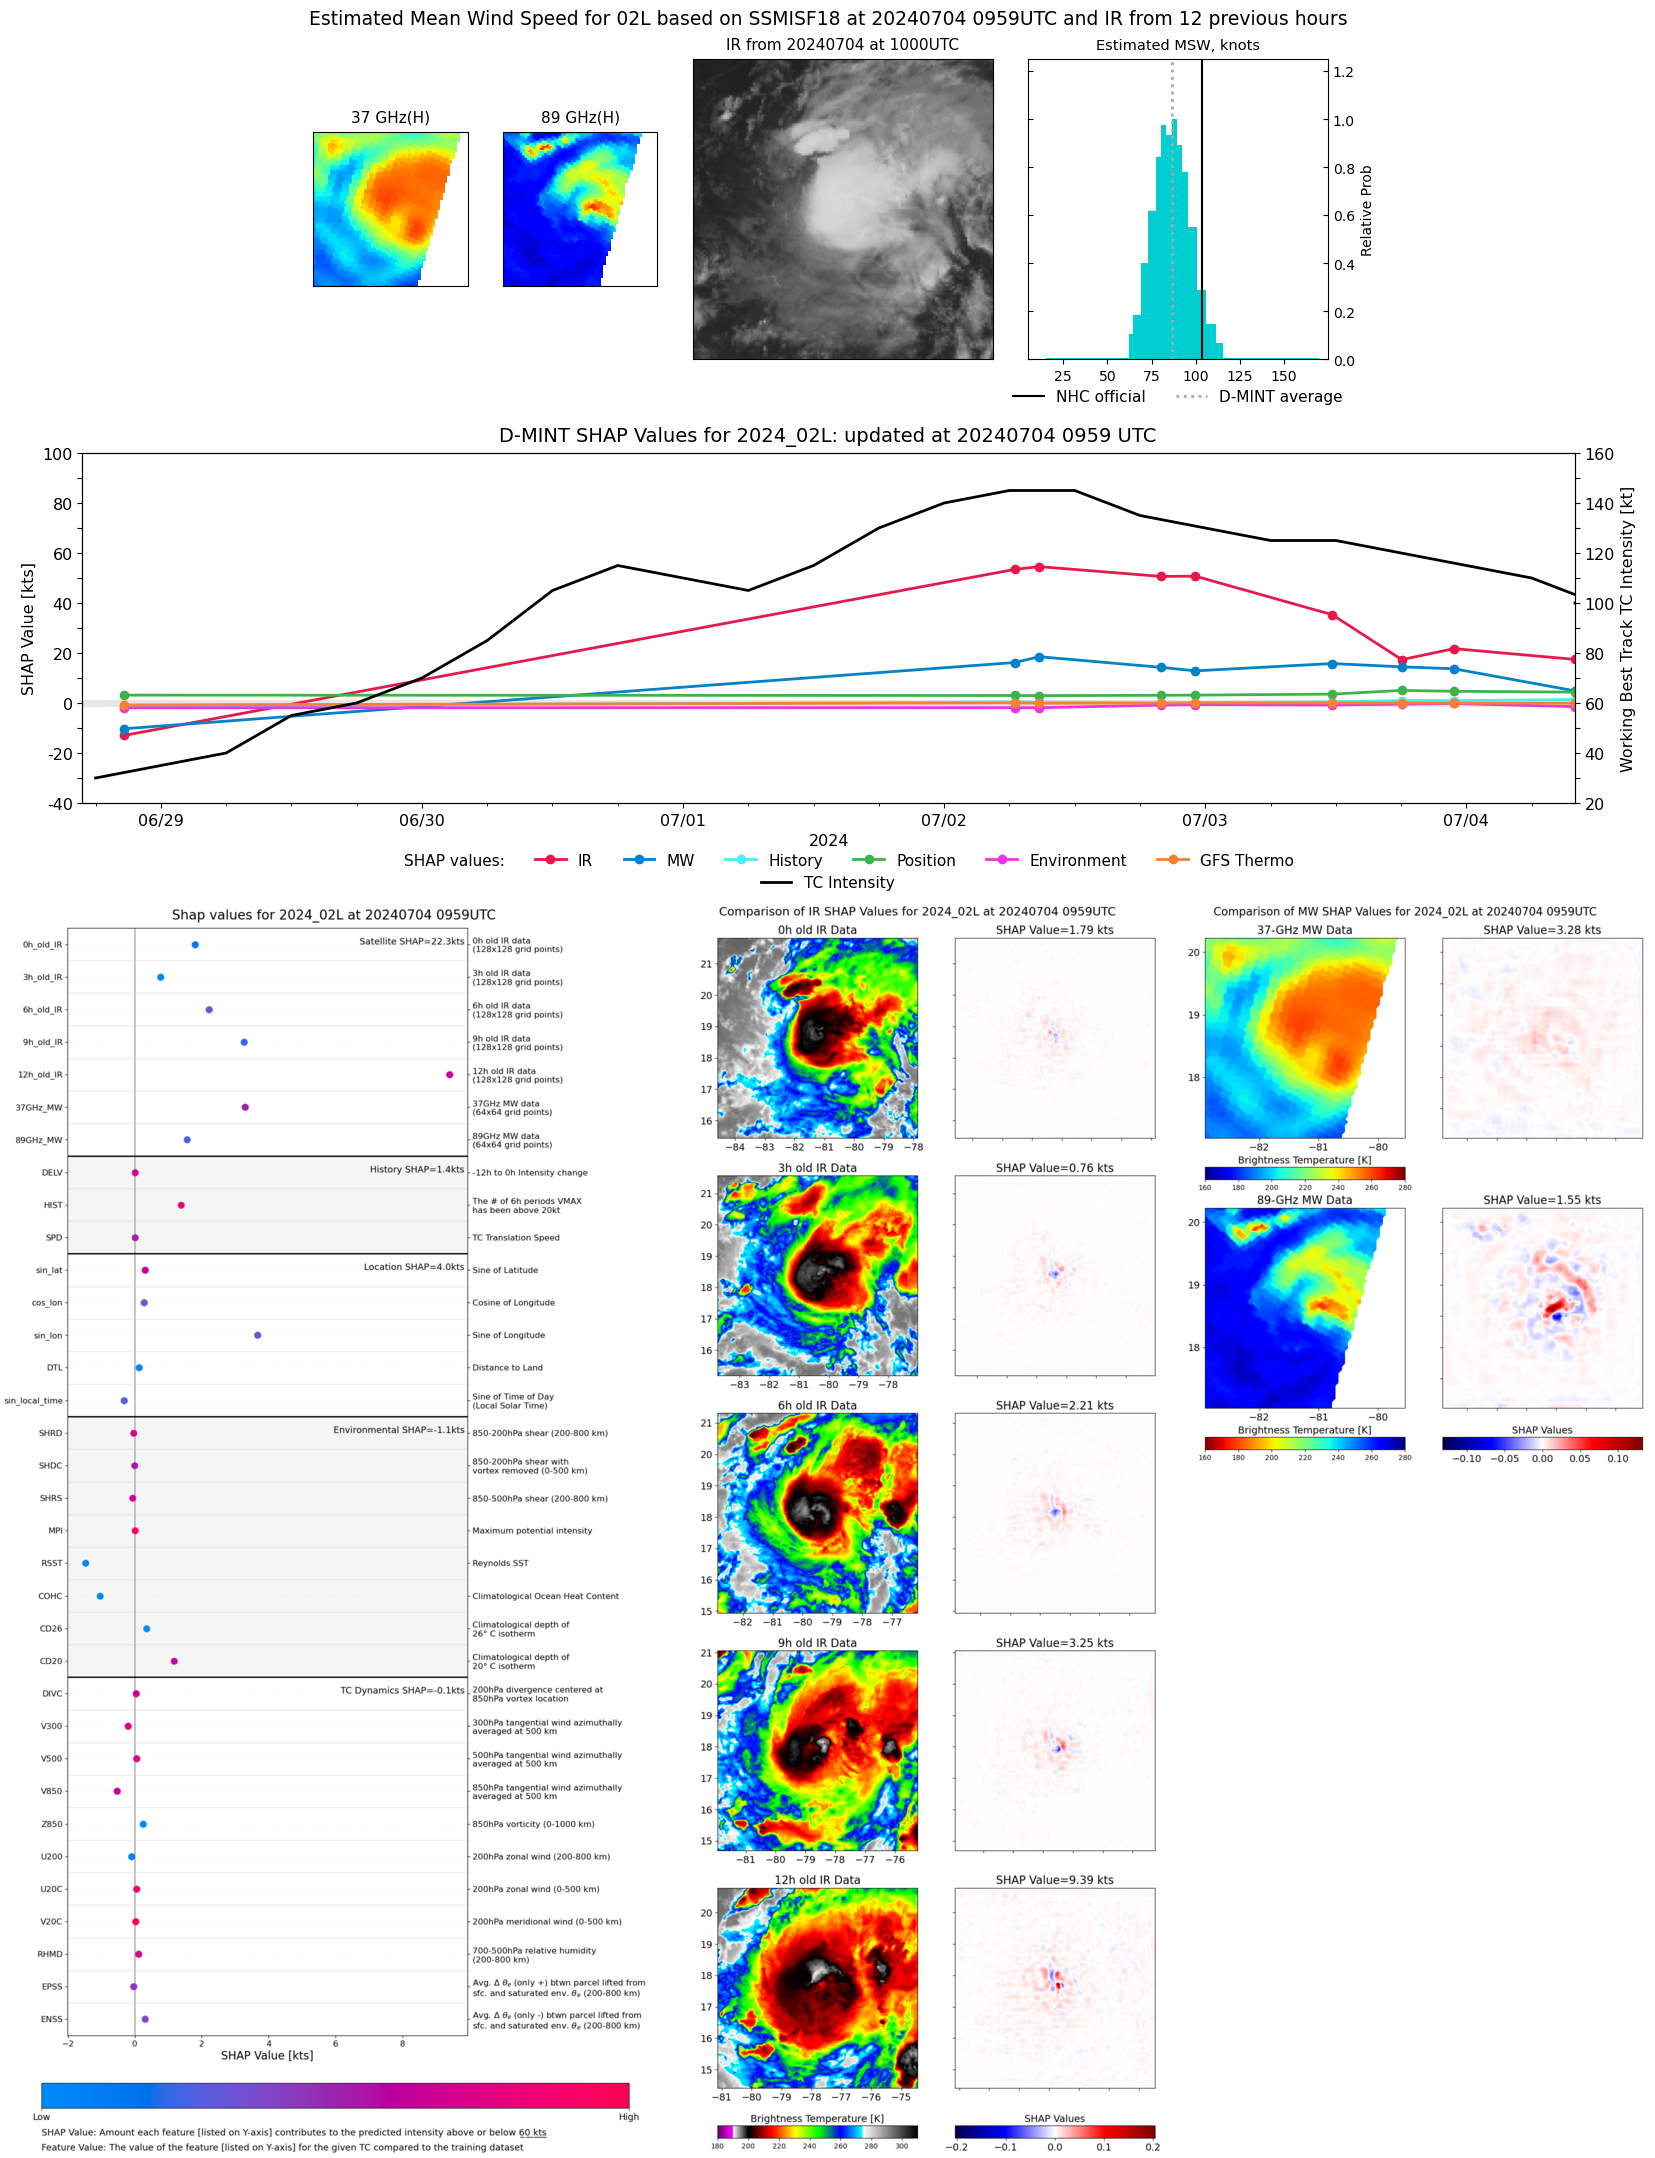 |
| 20240703 | UTC | 20240703 | 951 hPa | 111 kts | 103 kts | 118 kts | |
| 20240703 | 2252 UTC | SSMISF17 | 965 hPa | 103 kts | 94 kts | 111 kts | 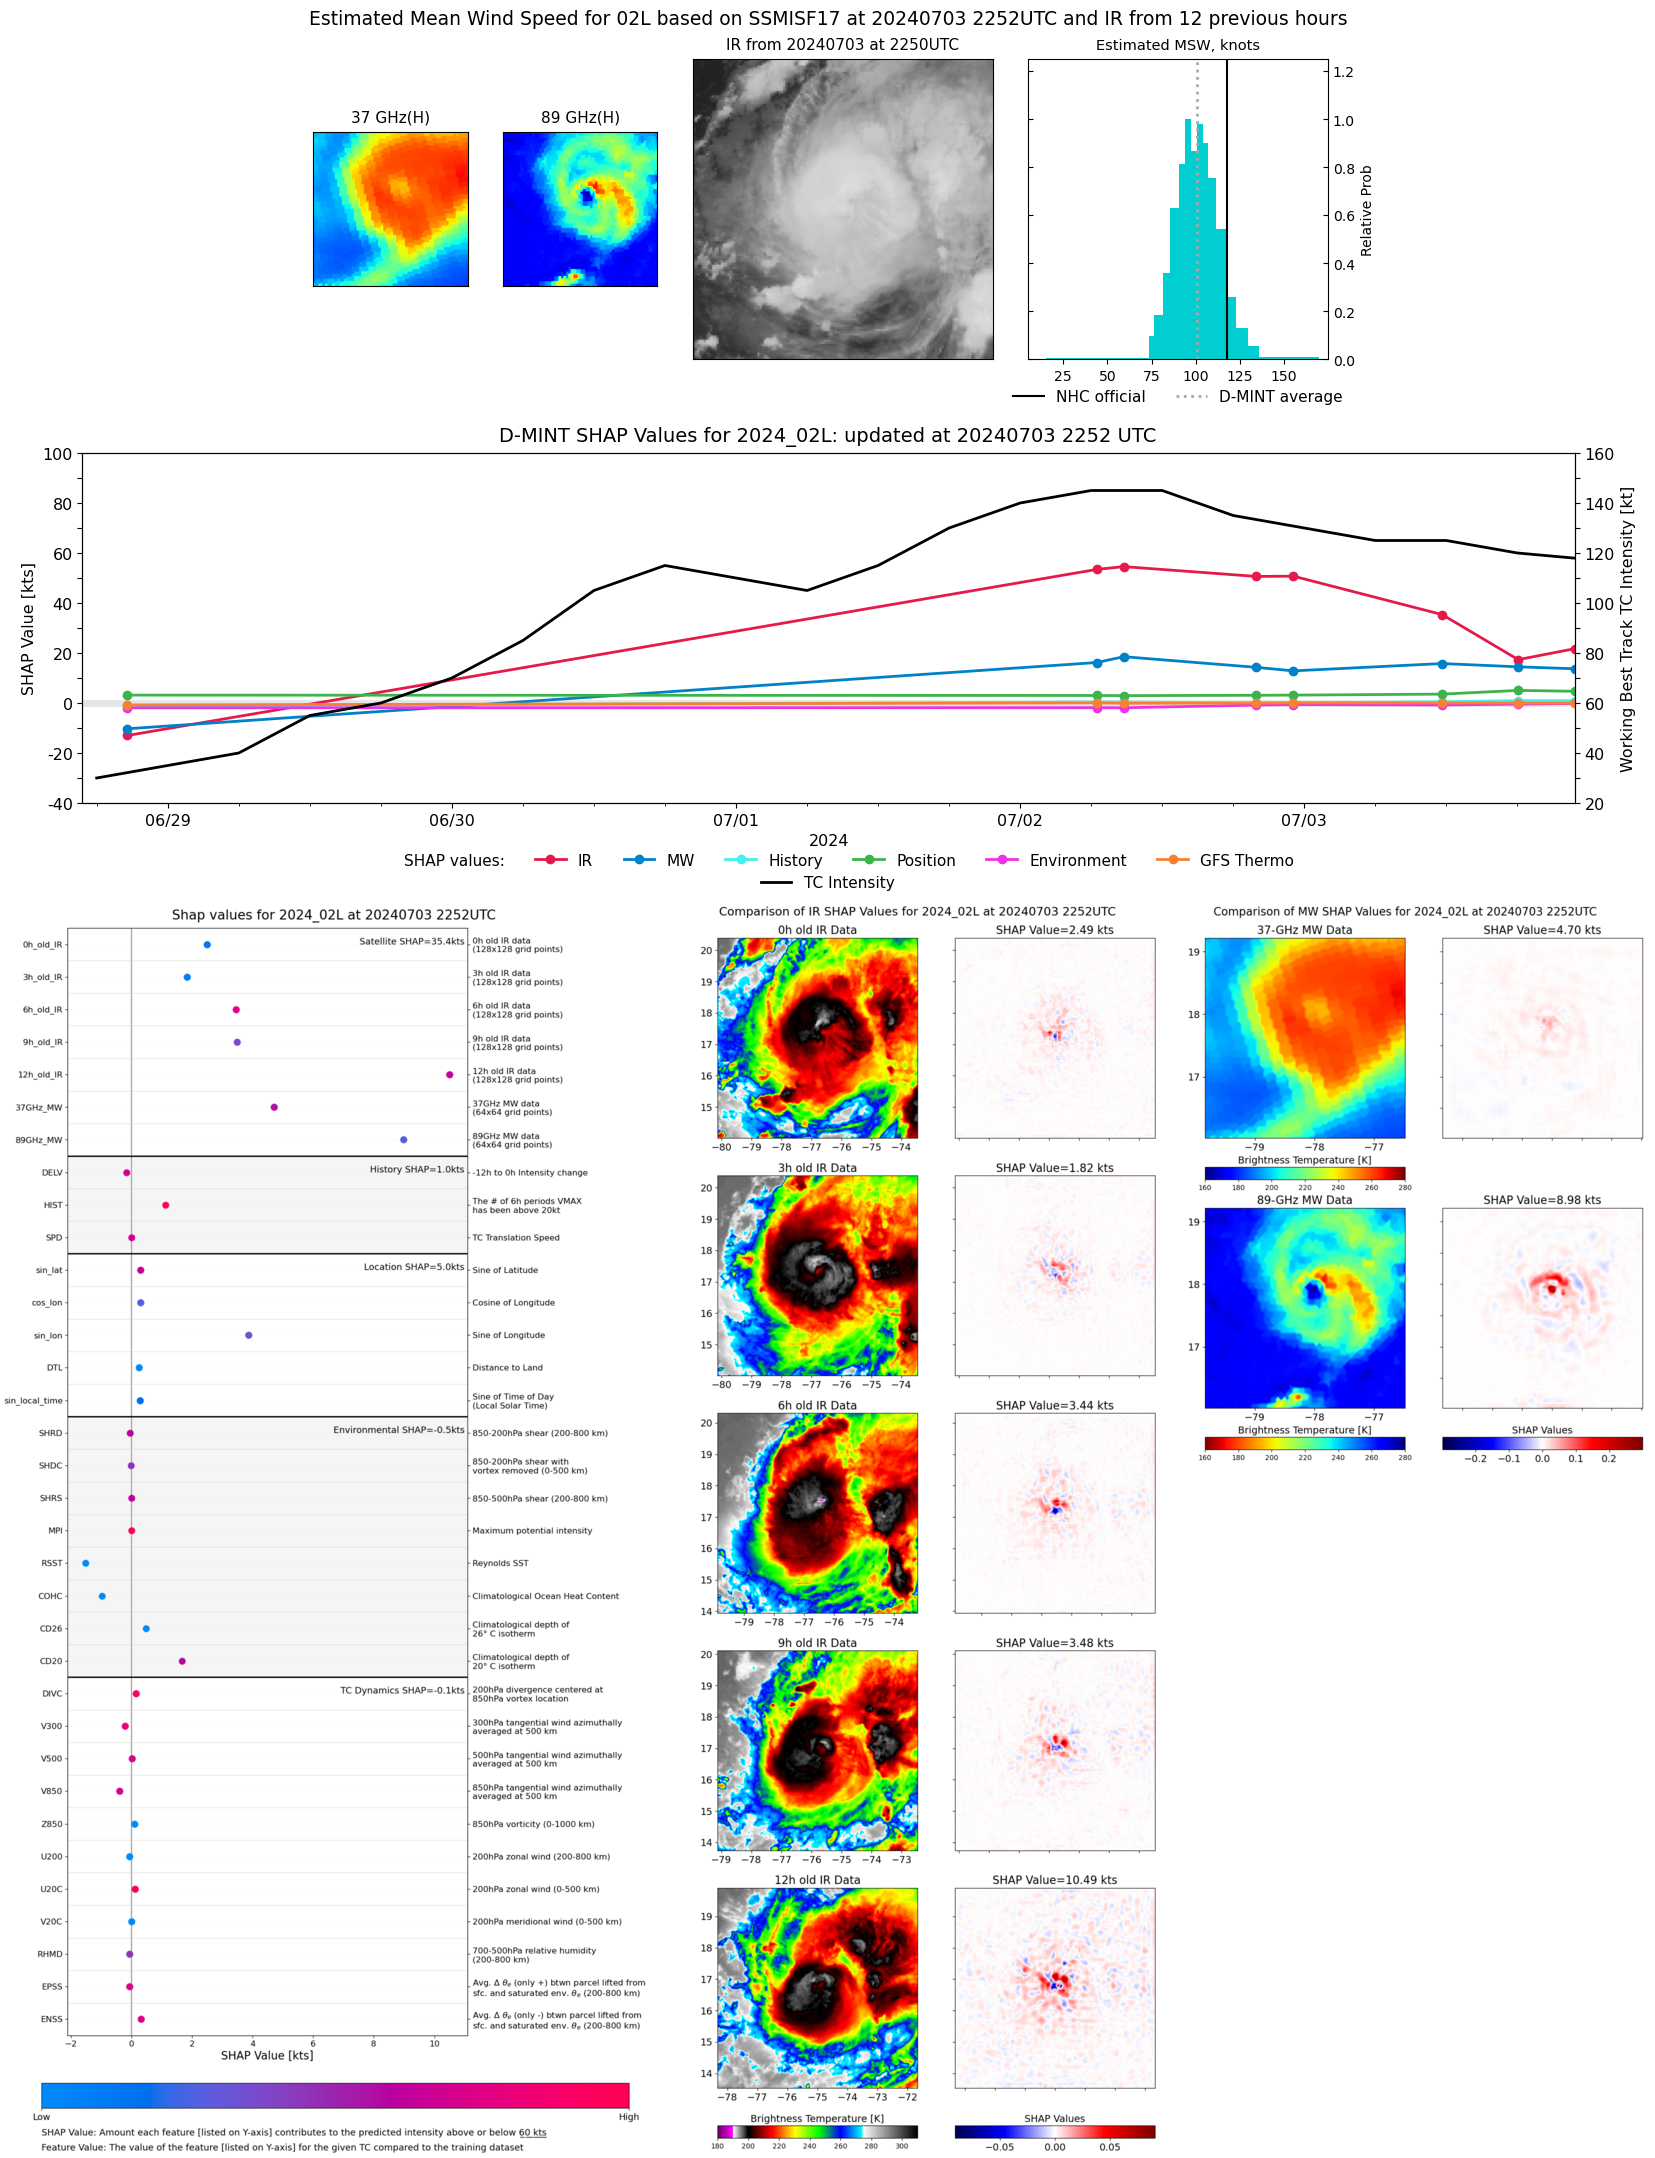 |
| 20240703 | UTC | 20240703 | 951 hPa | 111 kts | 103 kts | 118 kts | |
| 20240703 | 1844 UTC | TROPICS06 | 958 hPa | 99 kts | 92 kts | 106 kts | 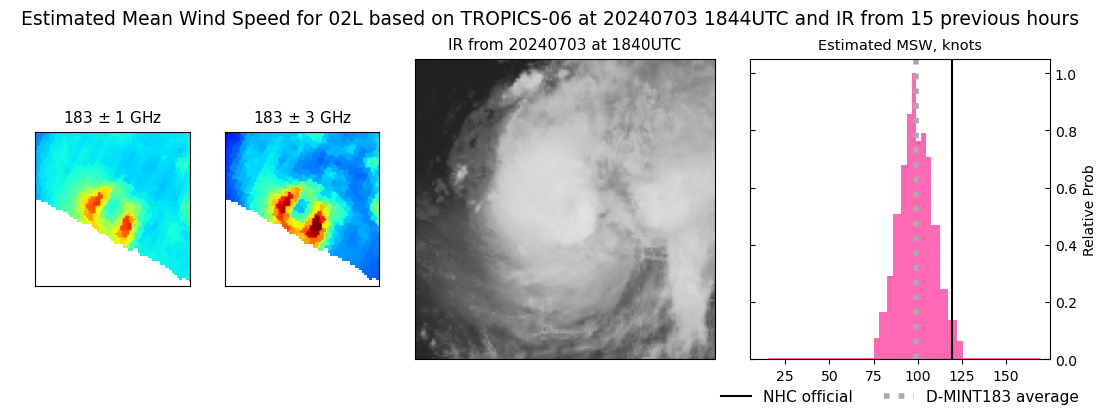 |
| 20240703 | UTC | 20240703 | 951 hPa | 111 kts | 103 kts | 118 kts | |
| 20240703 | 1804 UTC | AMSR2 | 966 hPa | 97 kts | 89 kts | 105 kts | 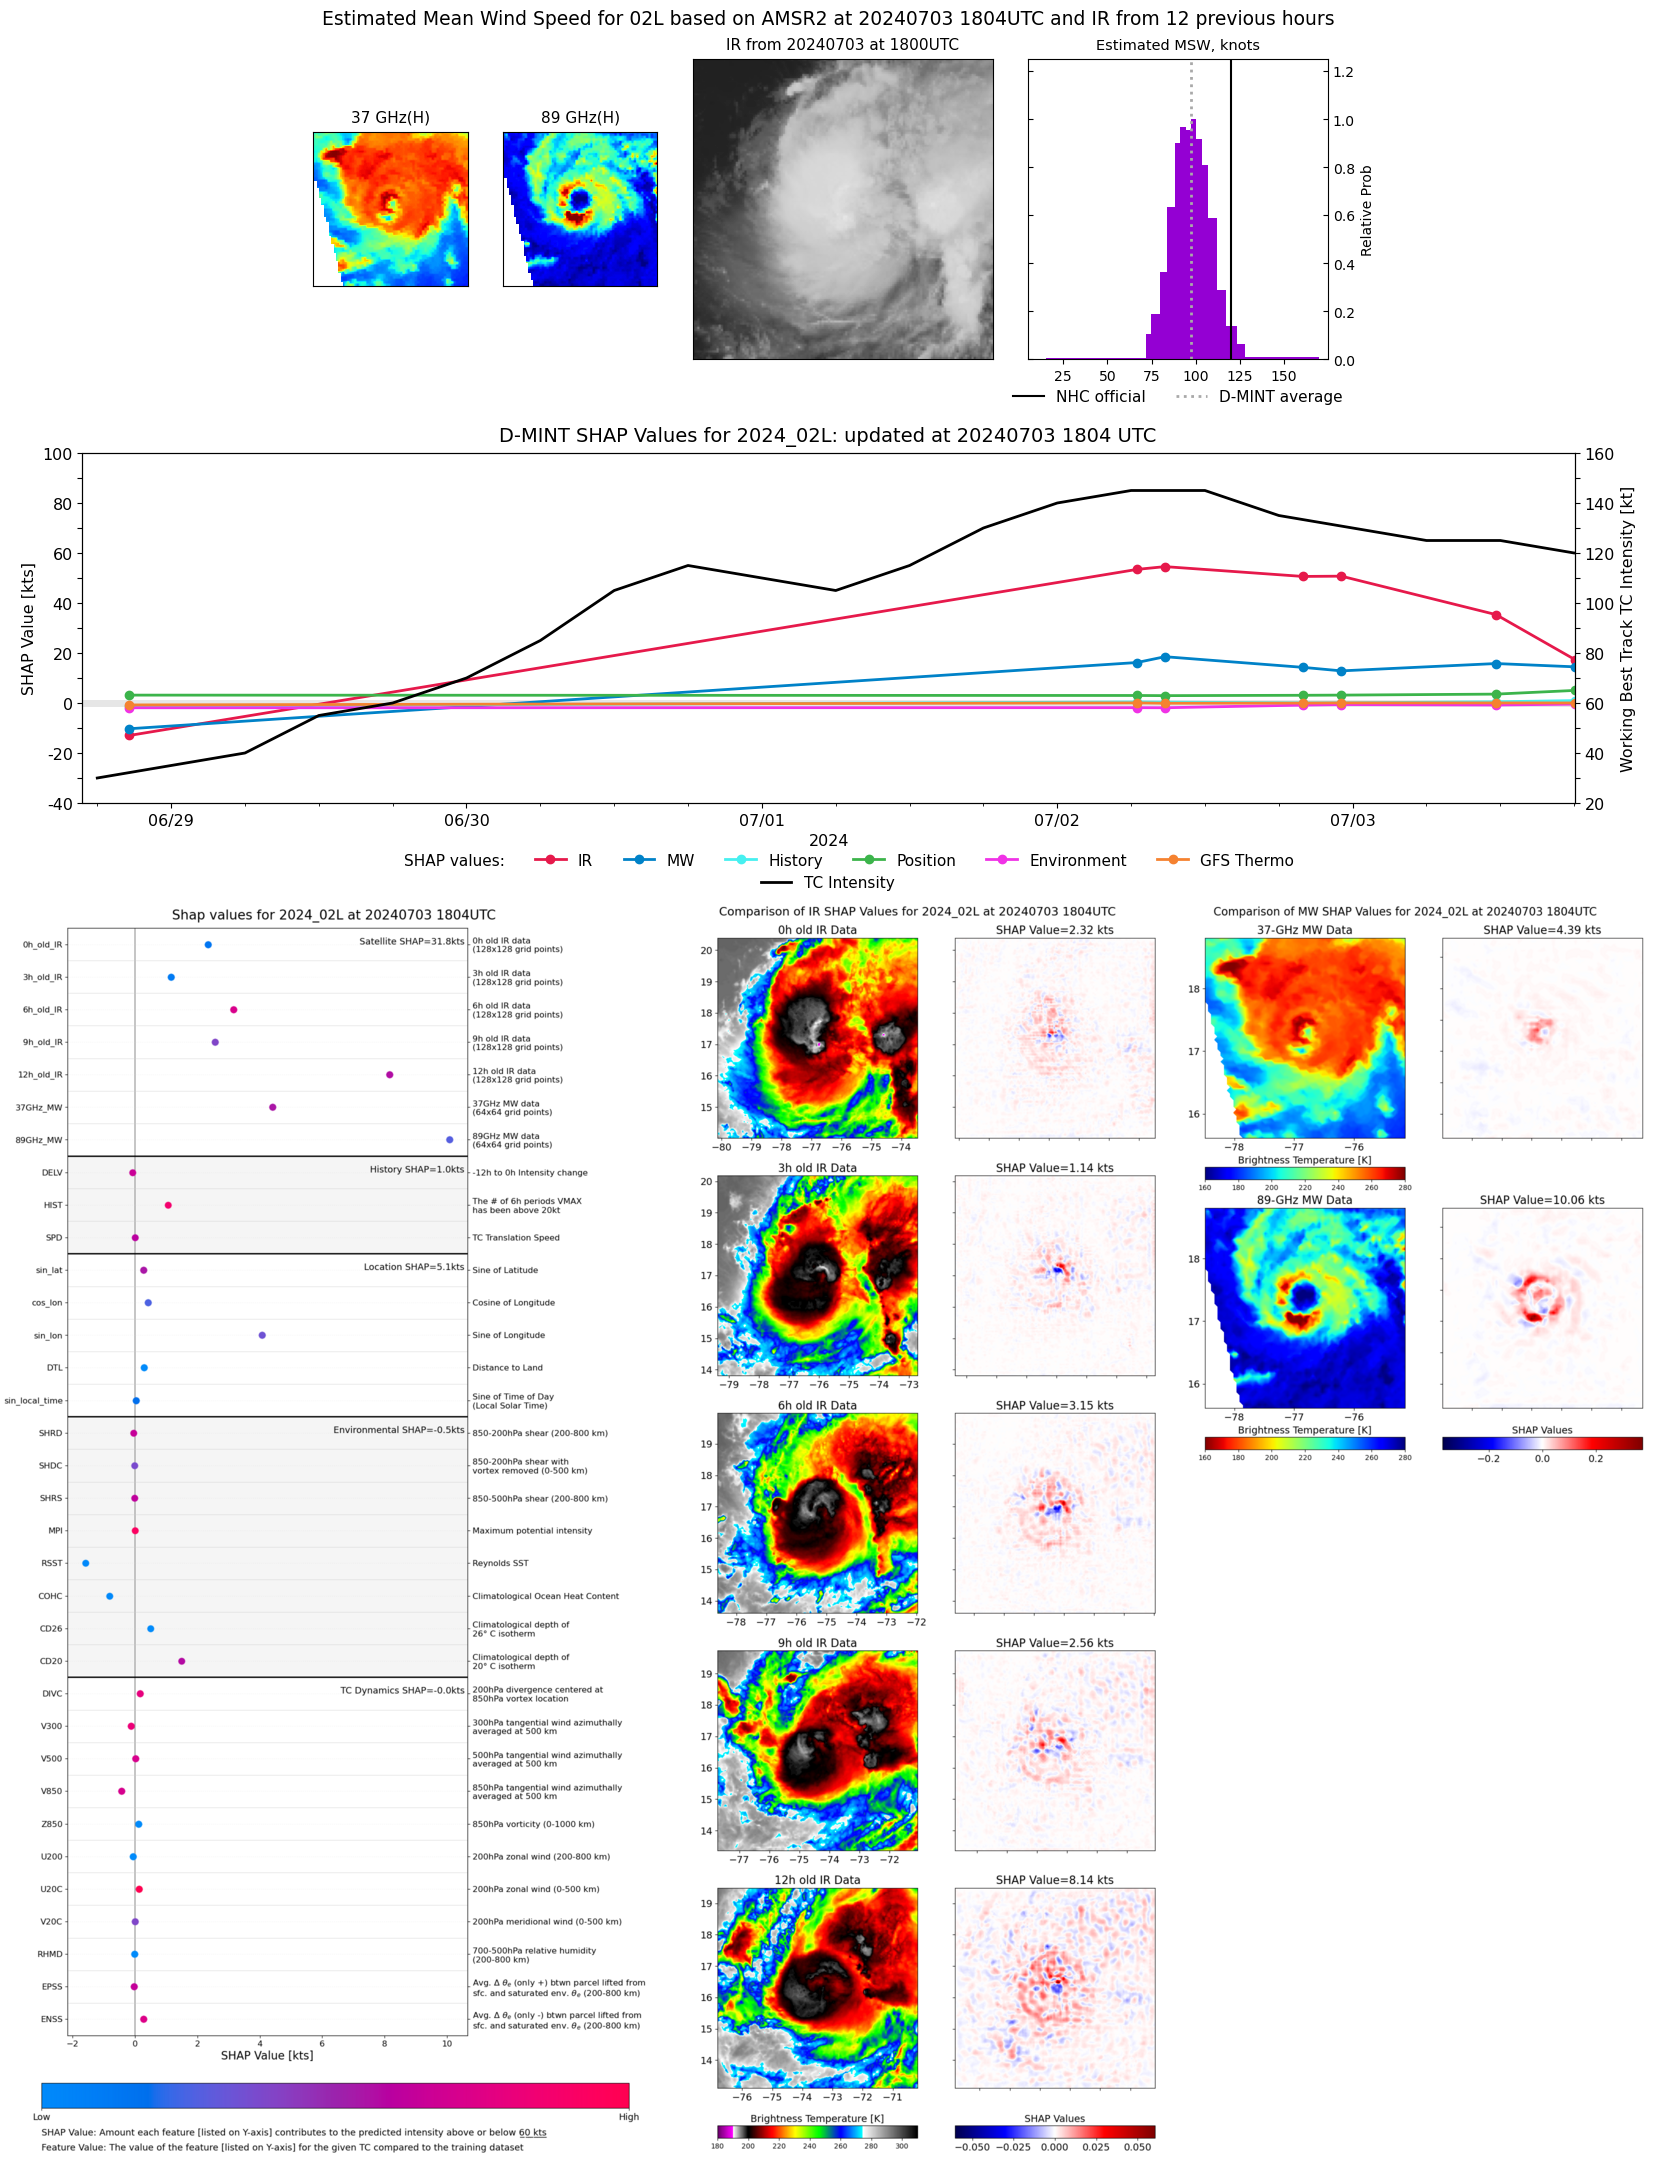 |
| 20240703 | UTC | 20240703 | 951 hPa | 111 kts | 103 kts | 118 kts | |
| 20240703 | 1139 UTC | SSMISF17 | 952 hPa | 117 kts | 110 kts | 125 kts | 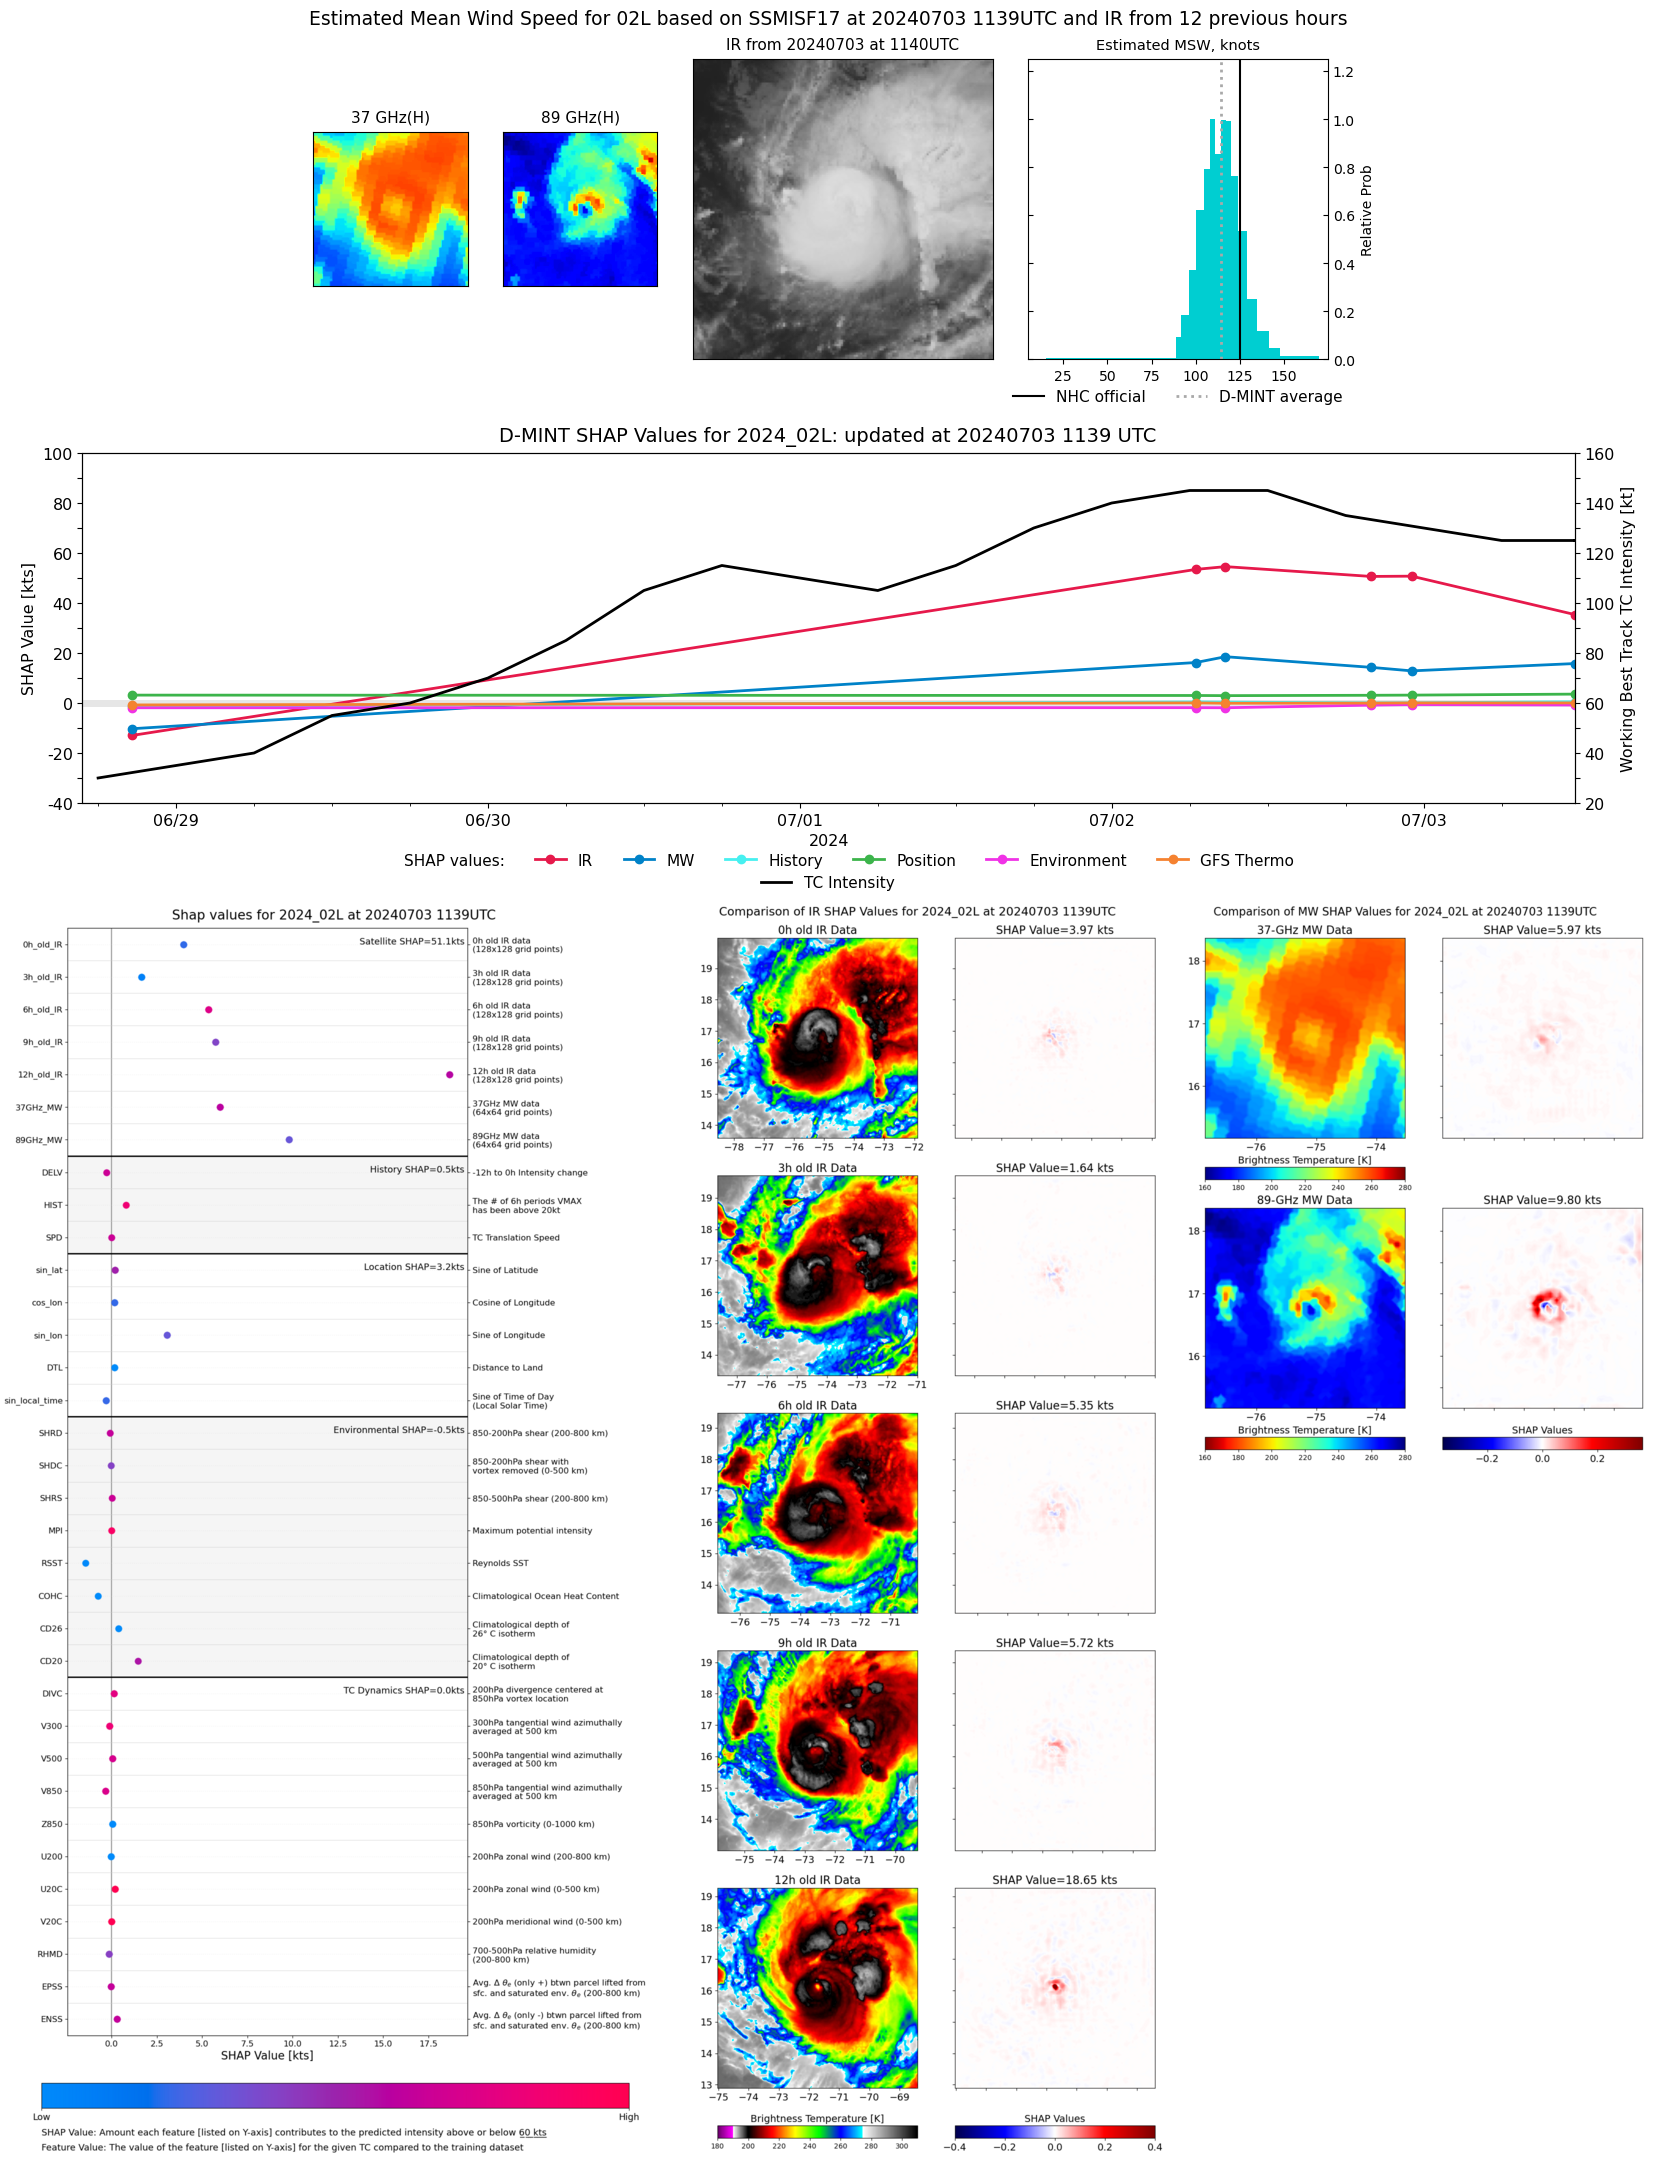 |
| 20240703 | UTC | 20240703 | 951 hPa | 111 kts | 103 kts | 118 kts | |
| 20240703 | 0943 UTC | GMI | 952 hPa | 107 kts | 99 kts | 114 kts | 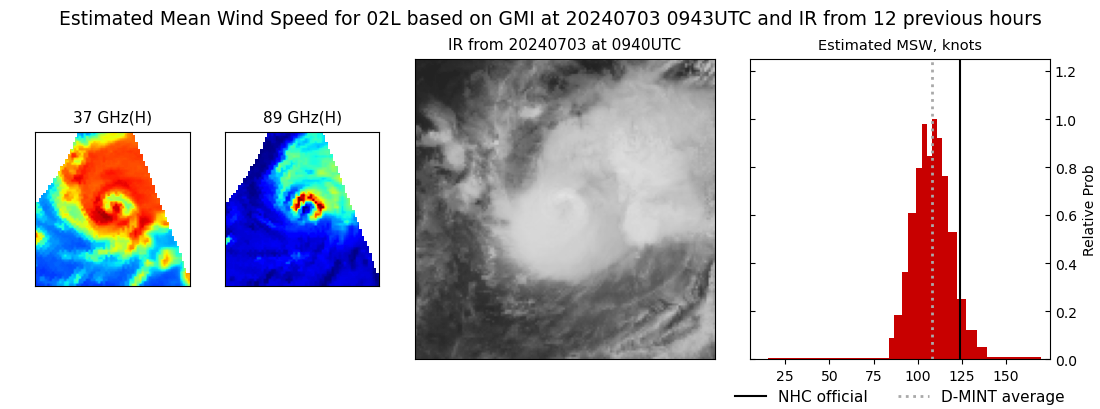 |
| 20240703 | UTC | 20240703 | 951 hPa | 111 kts | 103 kts | 118 kts | |
| 20240703 | 0832 UTC | SSMISF18 | 951 hPa | 111 kts | 103 kts | 118 kts | 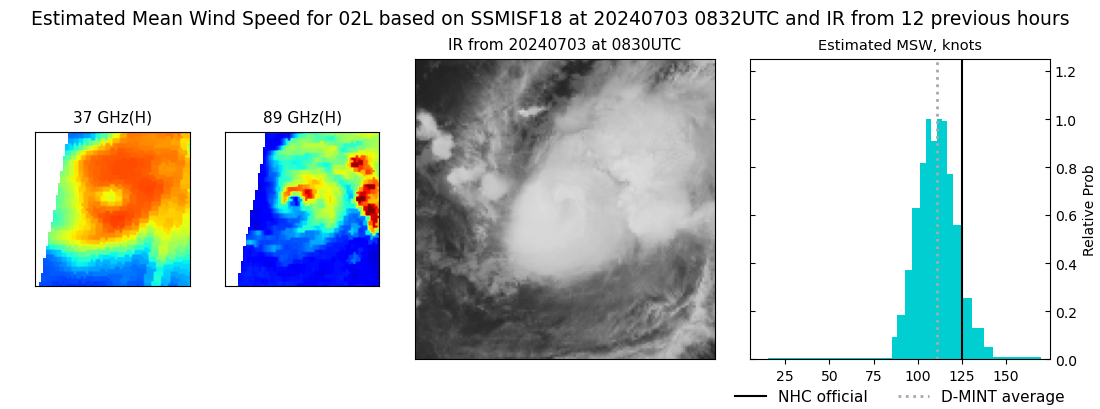 |
| 20240702 | UTC | 20240702 | 930 hPa | 131 kts | 125 kts | 137 kts | |
| 20240702 | 2305 UTC | SSMISF17 | 944 hPa | 126 kts | 118 kts | 133 kts | 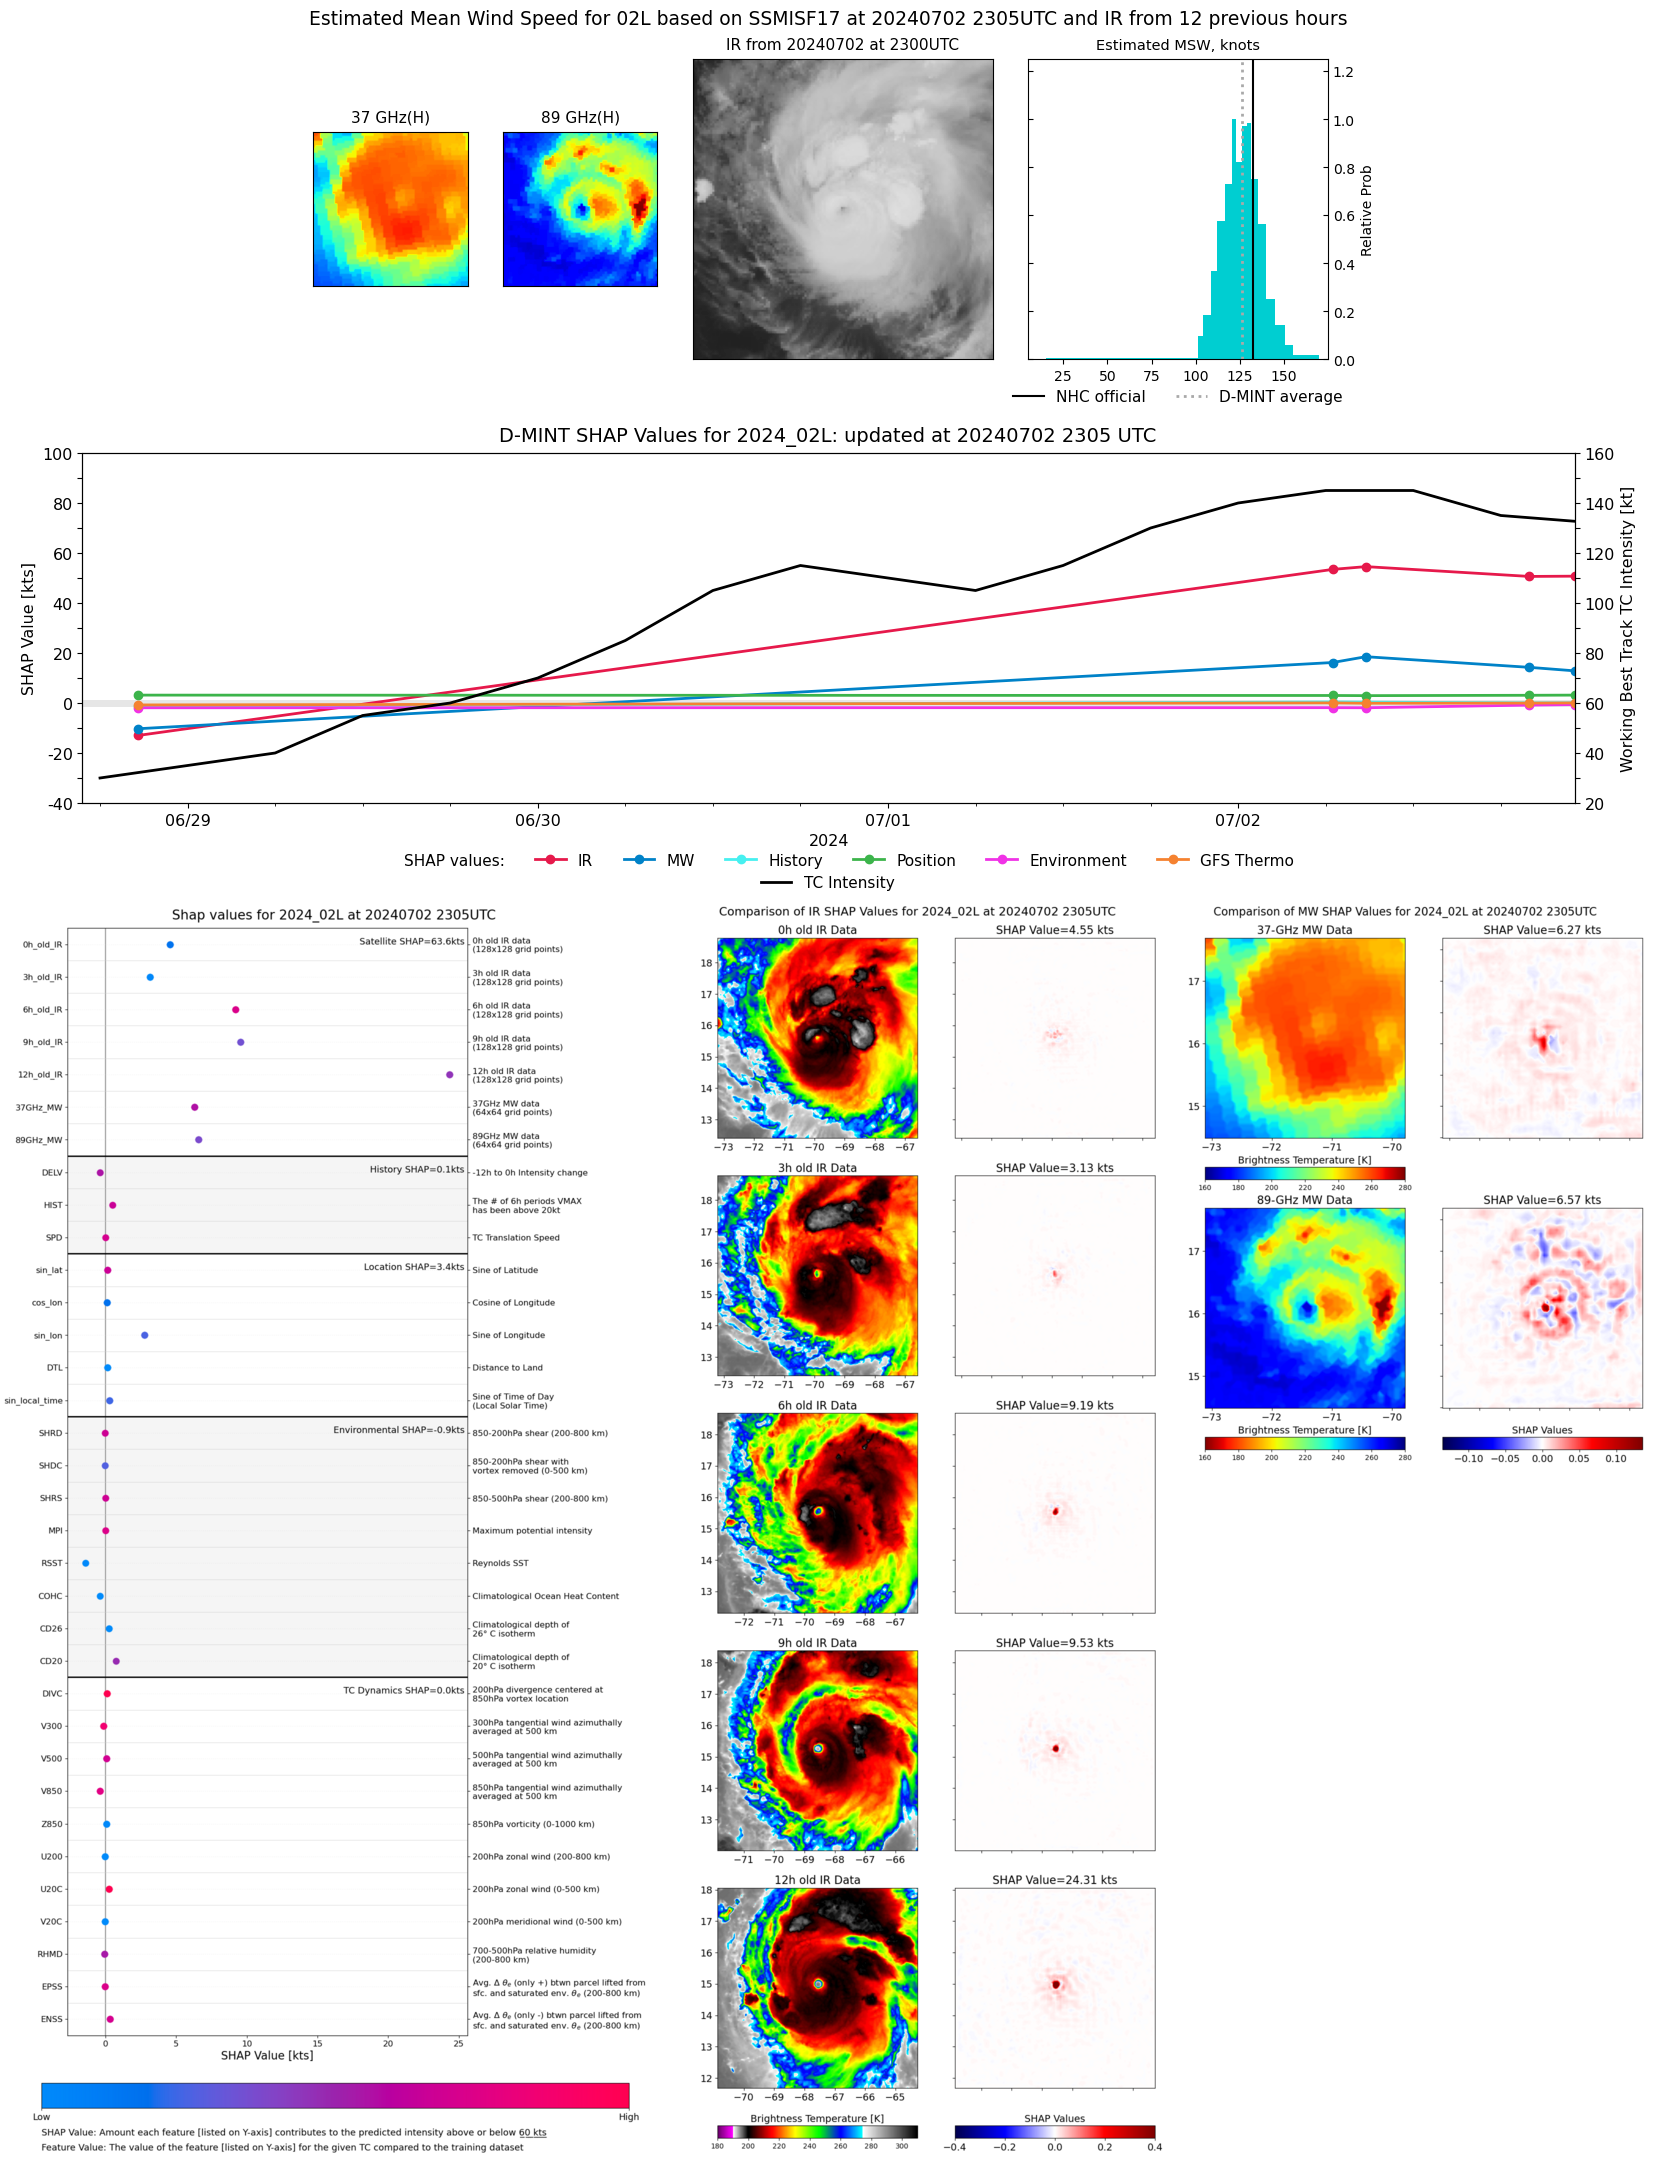 |
| 20240702 | UTC | 20240702 | 930 hPa | 131 kts | 125 kts | 137 kts | |
| 20240702 | 1957 UTC | SSMISF18 | 940 hPa | 127 kts | 119 kts | 134 kts | 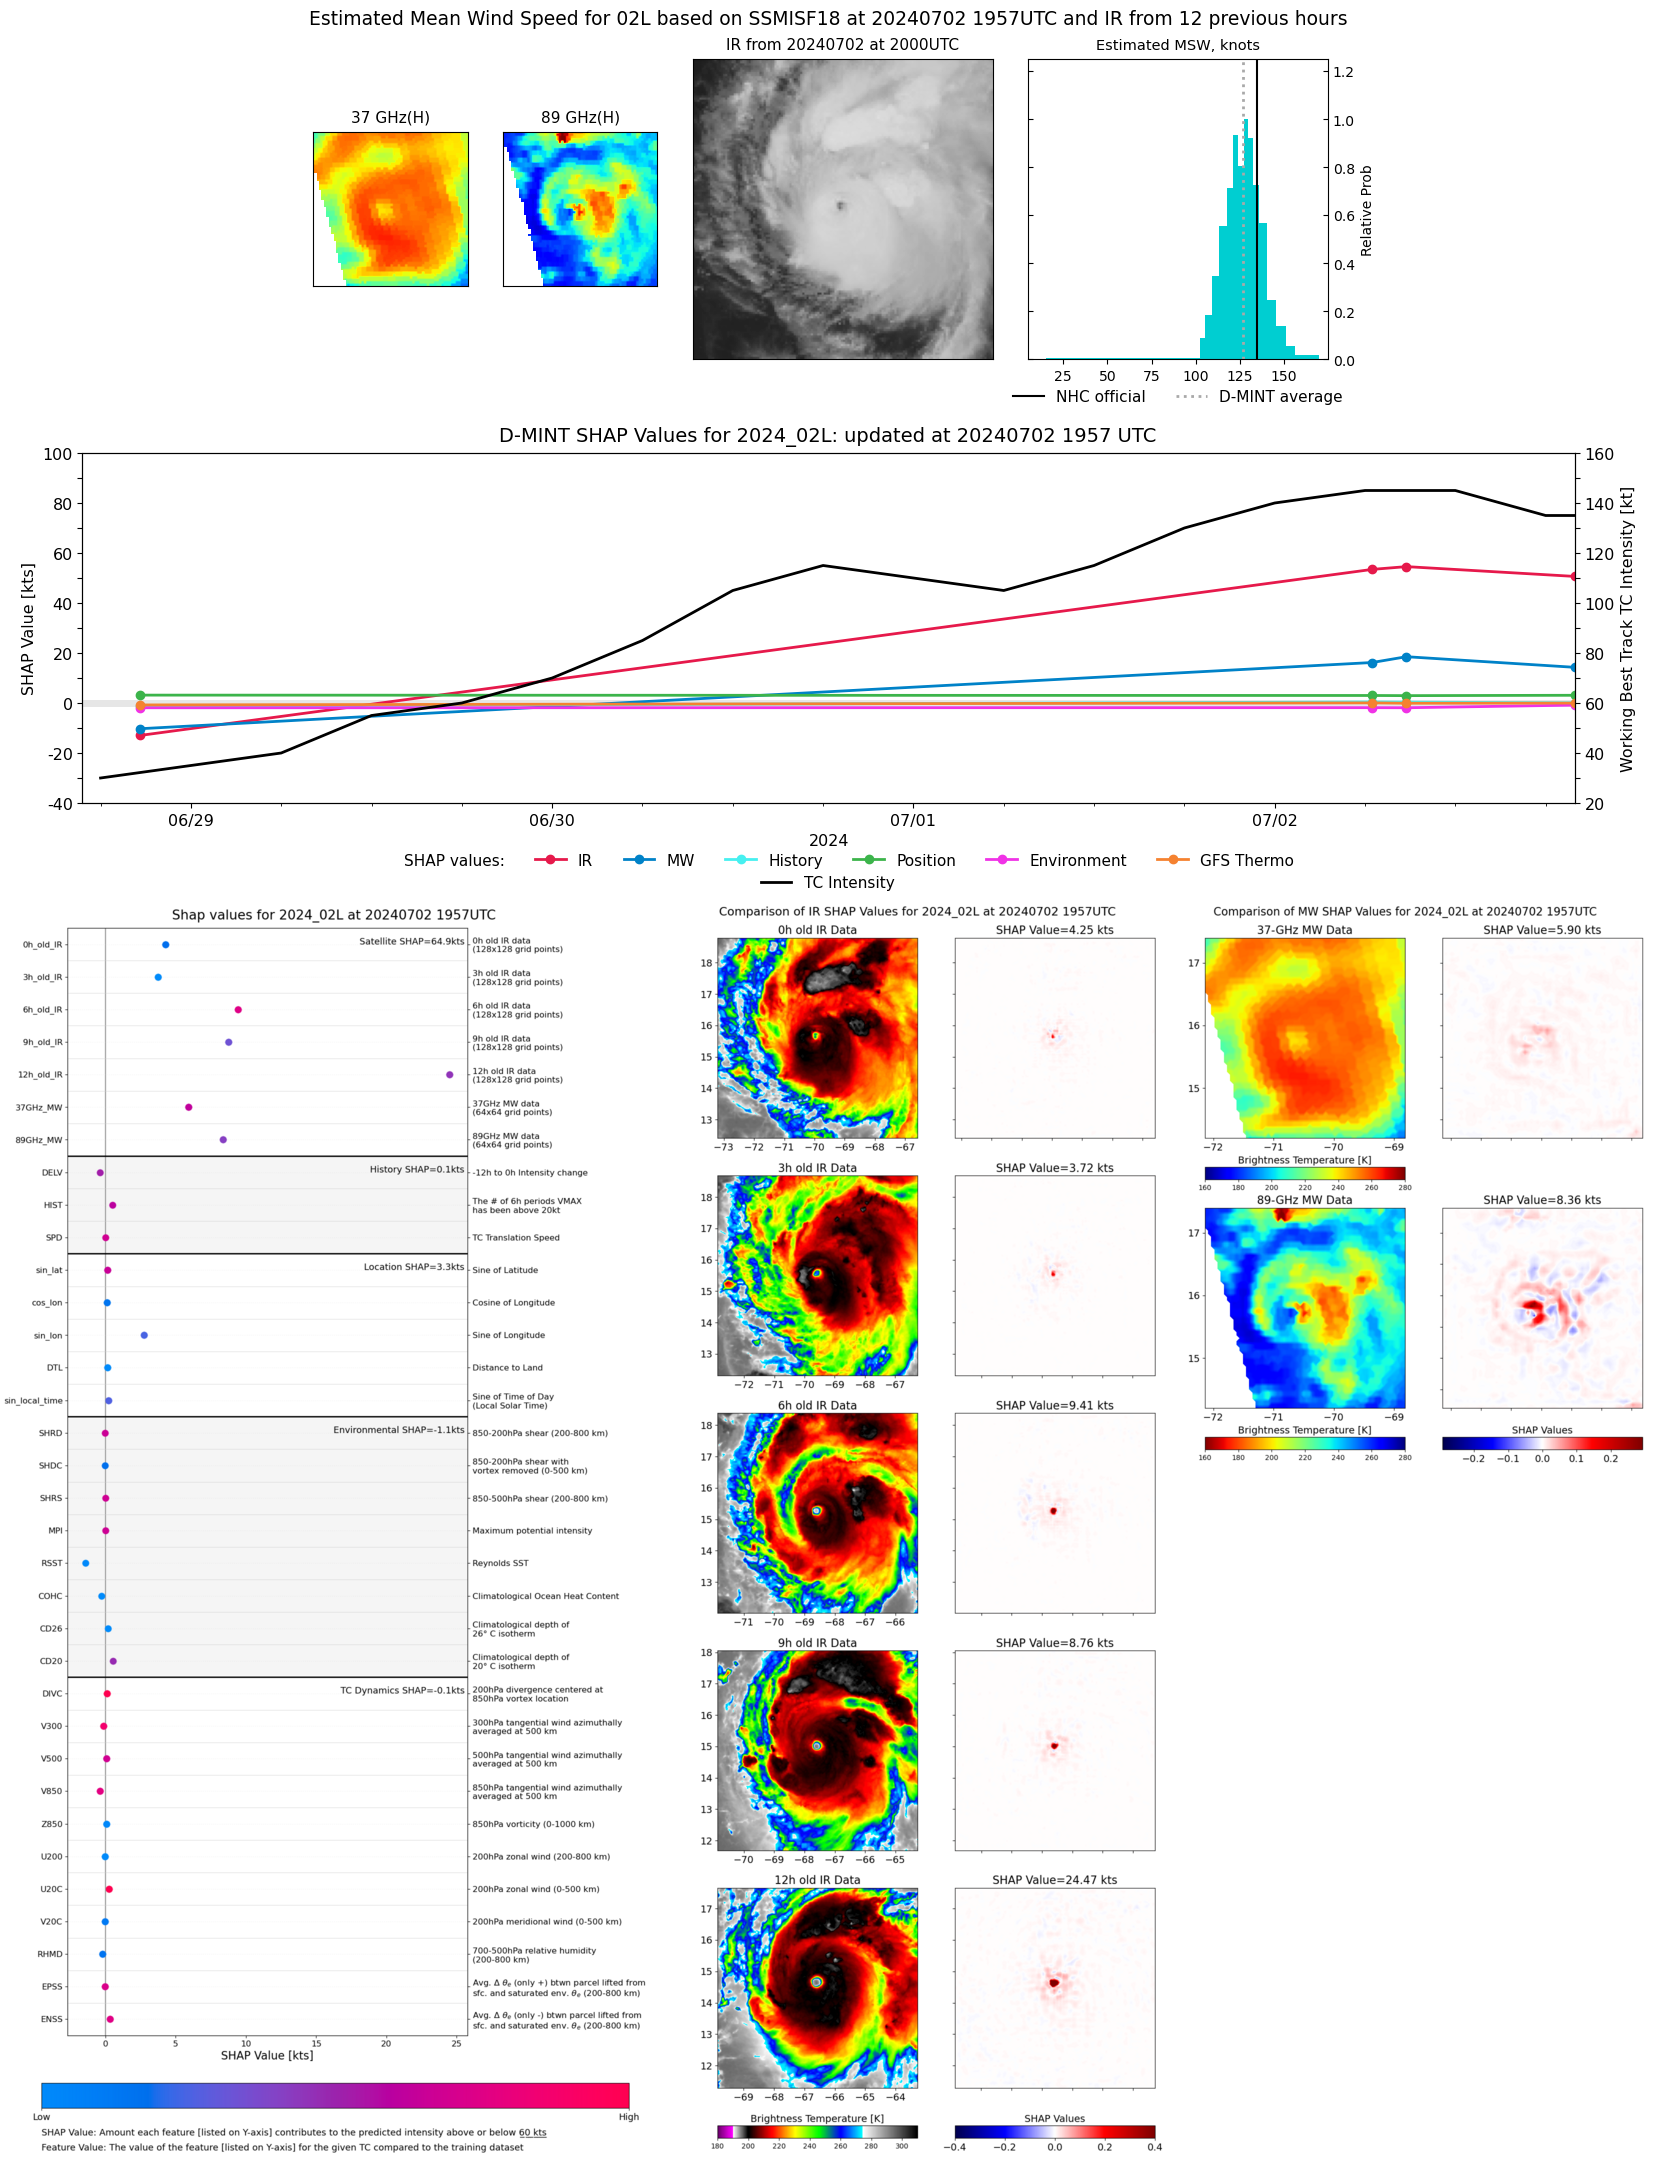 |
| 20240702 | UTC | 20240702 | 930 hPa | 131 kts | 125 kts | 137 kts | |
| 20240702 | 1907 UTC | TROPICS06 | 946 hPa | 118 kts | 112 kts | 124 kts | 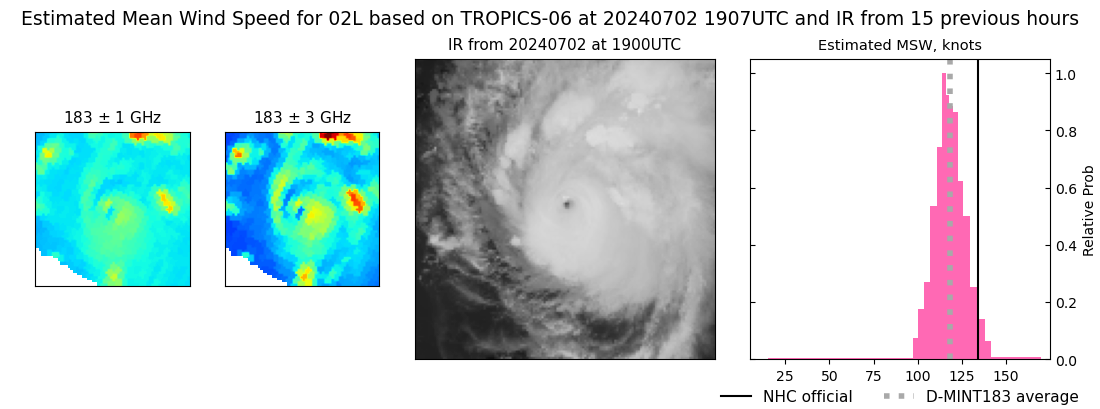 |
| 20240702 | UTC | 20240702 | 930 hPa | 131 kts | 125 kts | 137 kts | |
| 20240702 | 1044 UTC | TROPICS06 | 932 hPa | 143 kts | 138 kts | 149 kts | 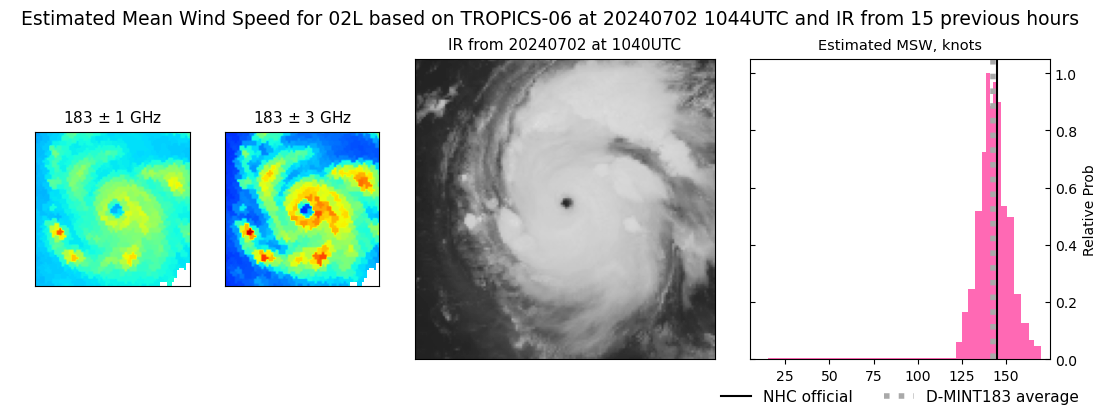 |
| 20240702 | UTC | 20240702 | 930 hPa | 131 kts | 125 kts | 137 kts | |
| 20240702 | 0845 UTC | SSMISF18 | 930 hPa | 134 kts | 127 kts | 141 kts | 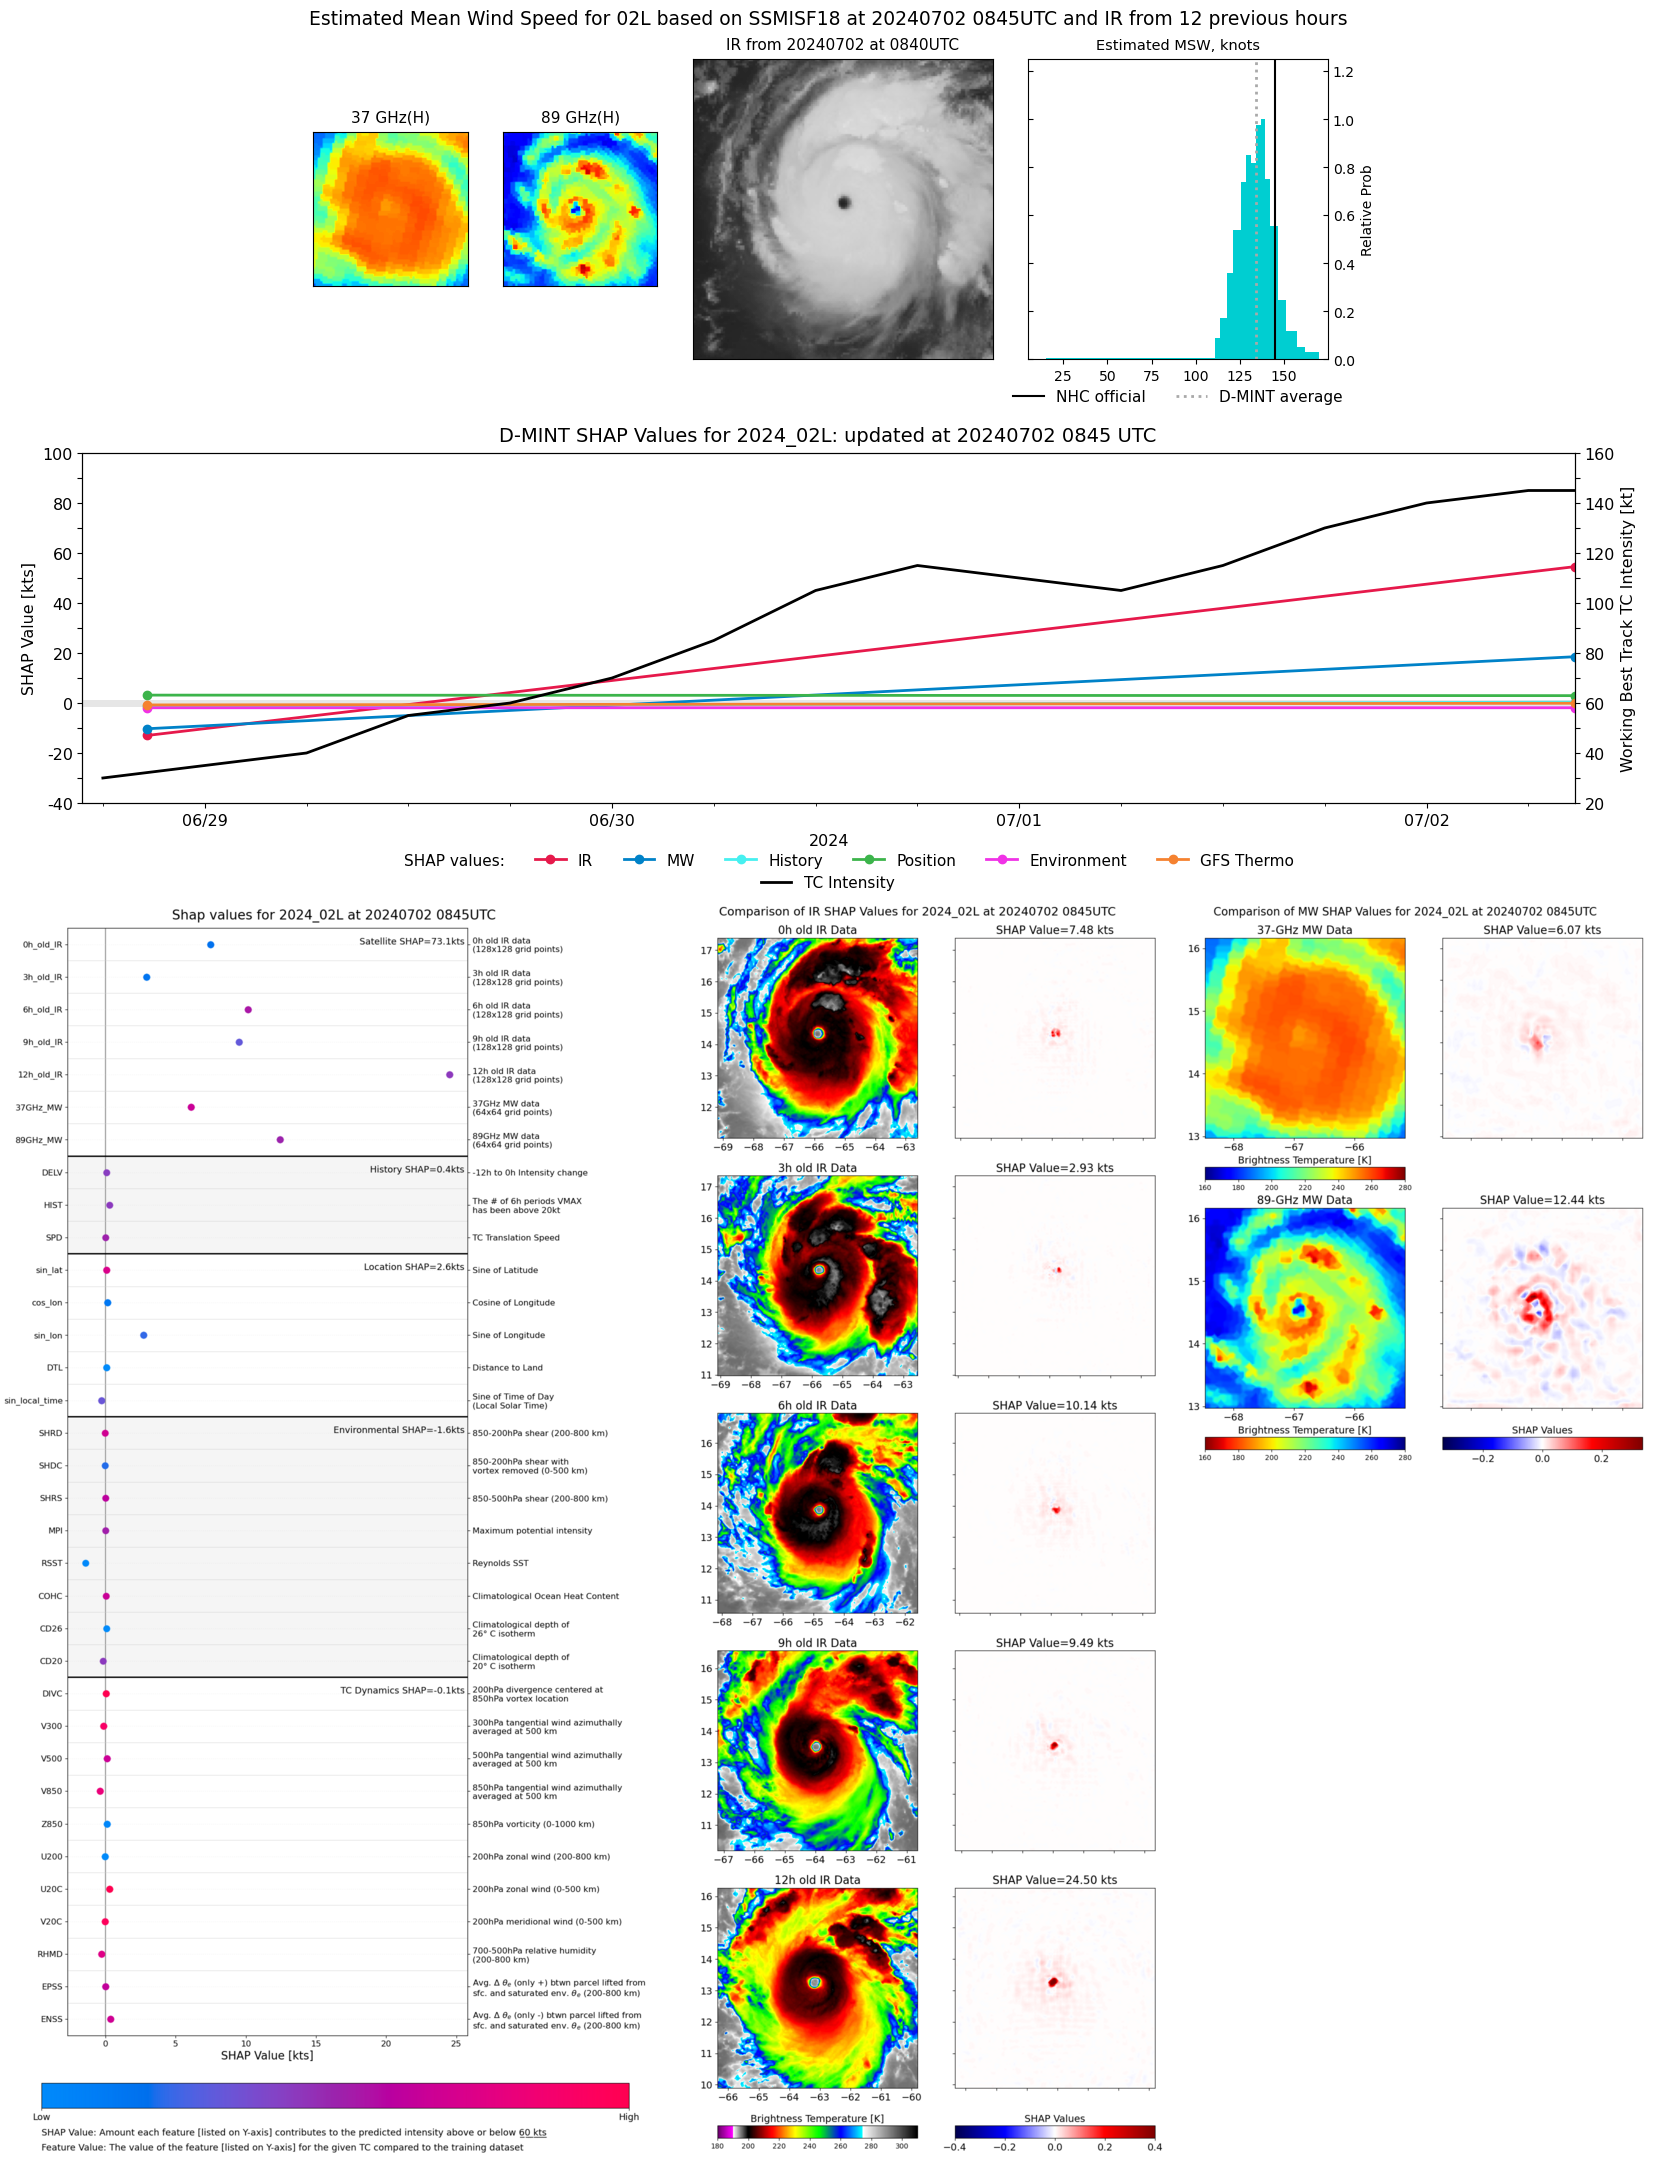 |
| 20240702 | UTC | 20240702 | 930 hPa | 131 kts | 125 kts | 137 kts | |
| 20240702 | 0629 UTC | AMSR2 | 930 hPa | 131 kts | 125 kts | 137 kts | 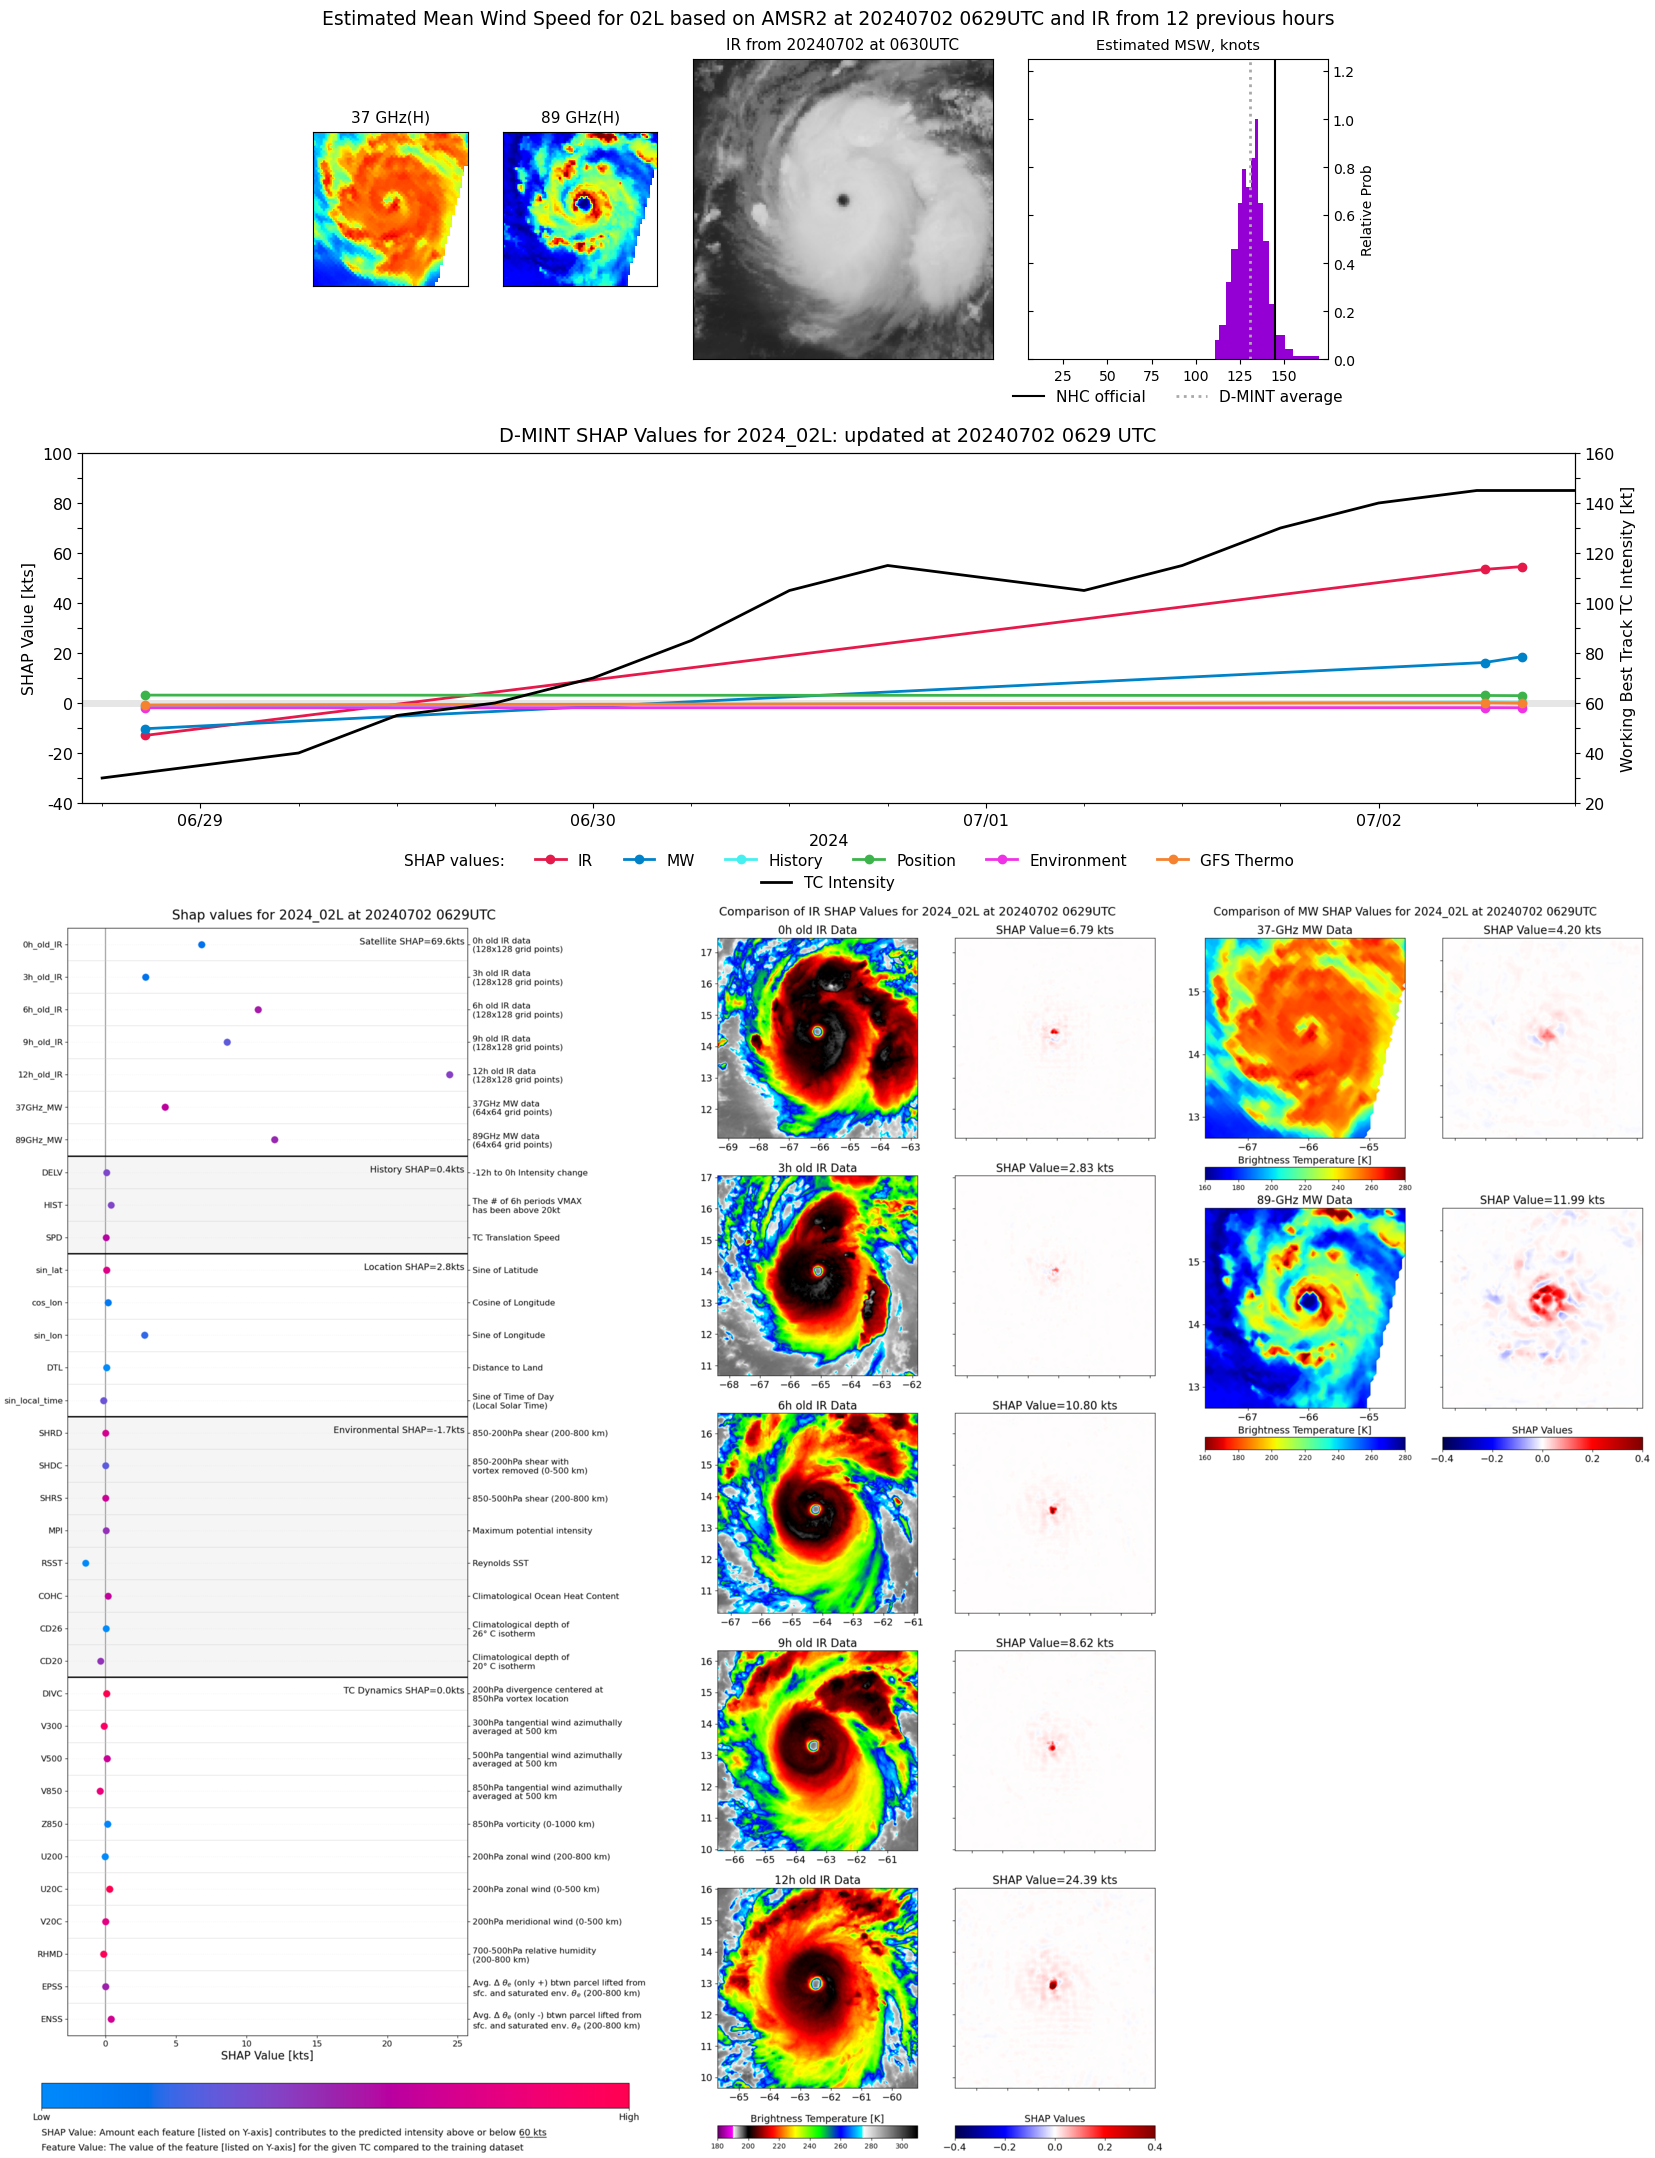 |
| 20240701 | UTC | 20240701 | 953 hPa | 111 kts | 105 kts | 118 kts | |
| 20240701 | 1041 UTC | TROPICS05 | 950 hPa | 118 kts | 112 kts | 124 kts | 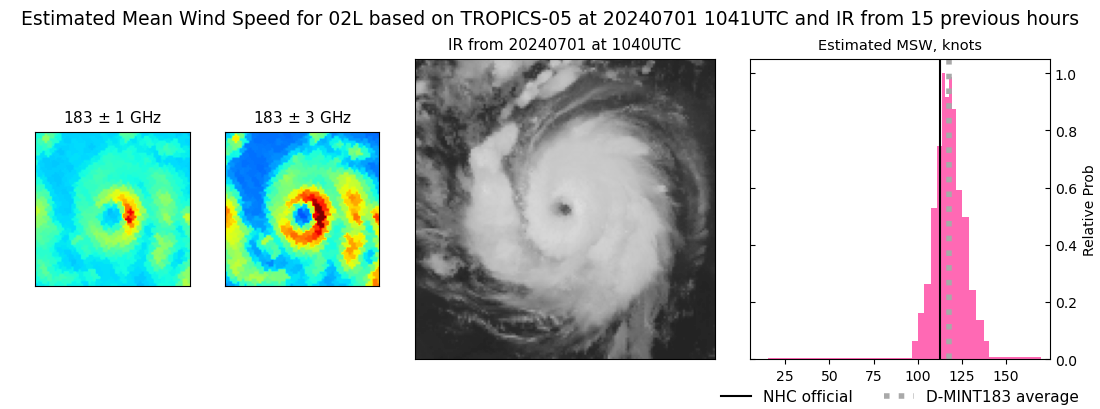 |
| 20240701 | UTC | 20240701 | 953 hPa | 111 kts | 105 kts | 118 kts | |
| 20240701 | 1027 UTC | SSMISF17 | 953 hPa | 111 kts | 105 kts | 118 kts | 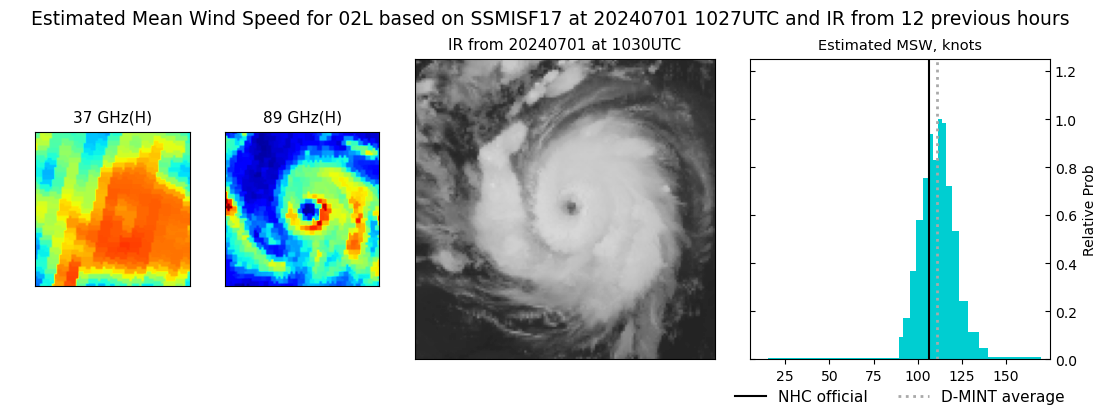 |
| 20240630 | UTC | 20240630 | 986 hPa | 75 kts | 68 kts | 82 kts | |
| 20240630 | 2149 UTC | SSMISF17 | 943 hPa | 118 kts | 111 kts | 125 kts | 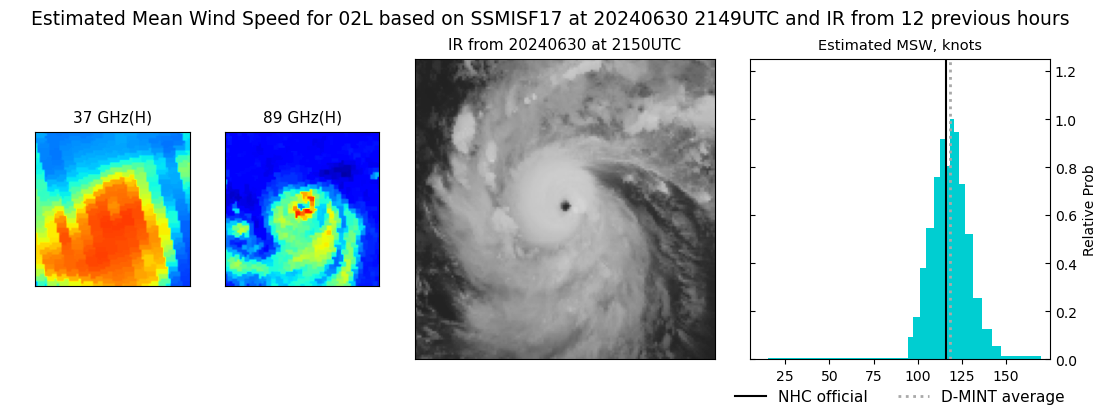 |
| 20240630 | UTC | 20240630 | 986 hPa | 75 kts | 68 kts | 82 kts | |
| 20240630 | 1955 UTC | TROPICS06 | 951 hPa | 116 kts | 109 kts | 122 kts | 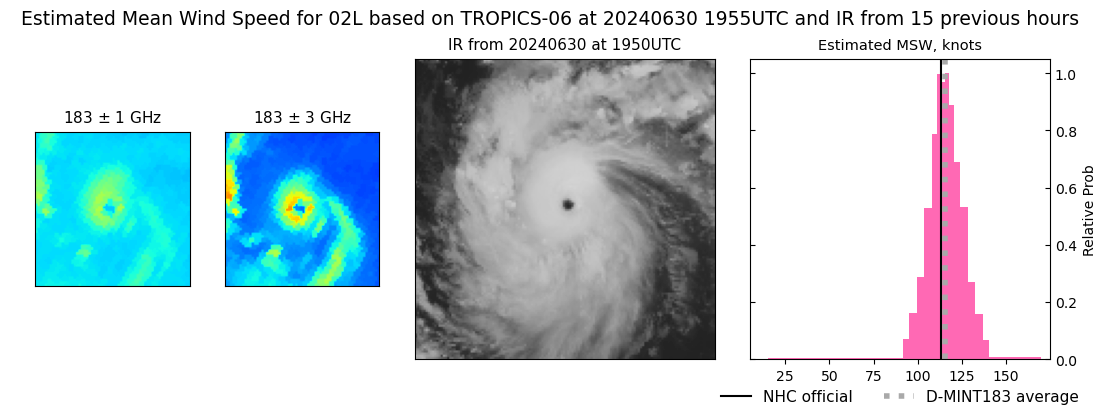 |
| 20240630 | UTC | 20240630 | 986 hPa | 75 kts | 68 kts | 82 kts | |
| 20240630 | 1649 UTC | ATMS | 949 hPa | 113 kts | 107 kts | 120 kts | 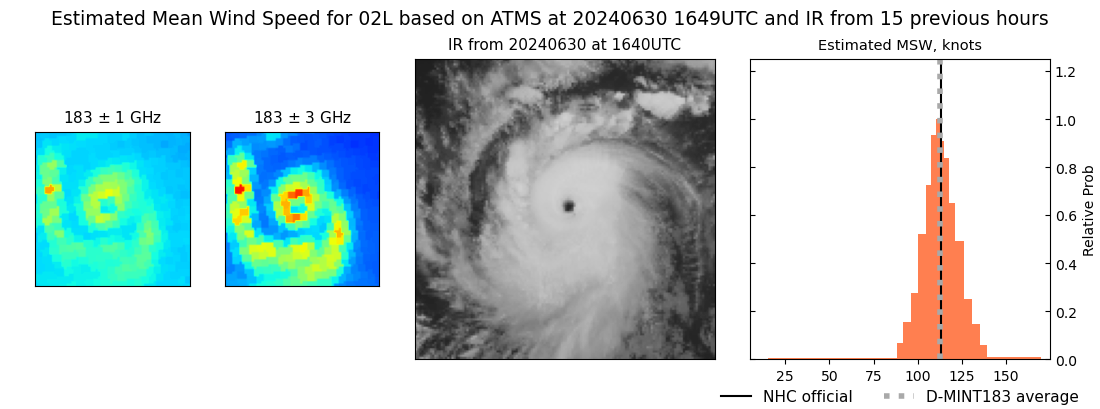 |
| 20240630 | UTC | 20240630 | 986 hPa | 75 kts | 68 kts | 82 kts | |
| 20240630 | 0729 UTC | SSMISF18 | 986 hPa | 75 kts | 68 kts | 82 kts | 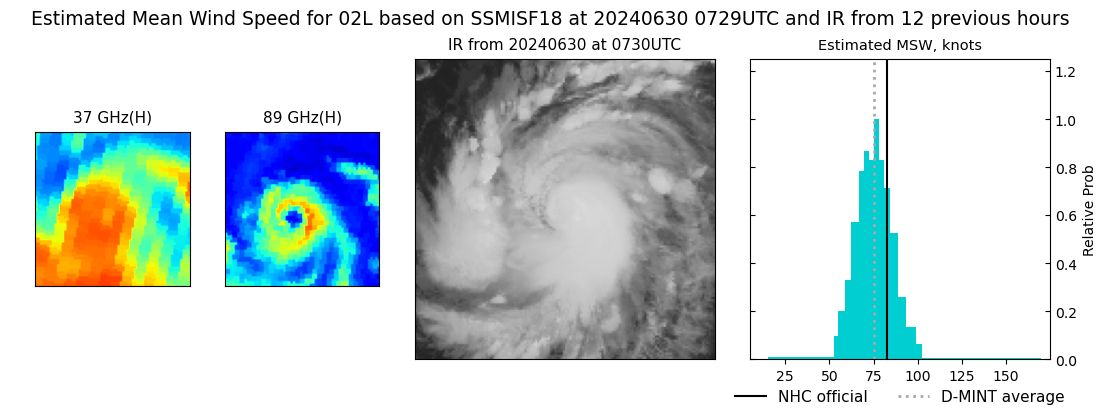 |
| 20240629 | UTC | 20240629 | 1007 hPa | 35 kts | 32 kts | 39 kts | |
| 20240629 | 1853 UTC | SSMISF18 | 999 hPa | 61 kts | 54 kts | 68 kts | 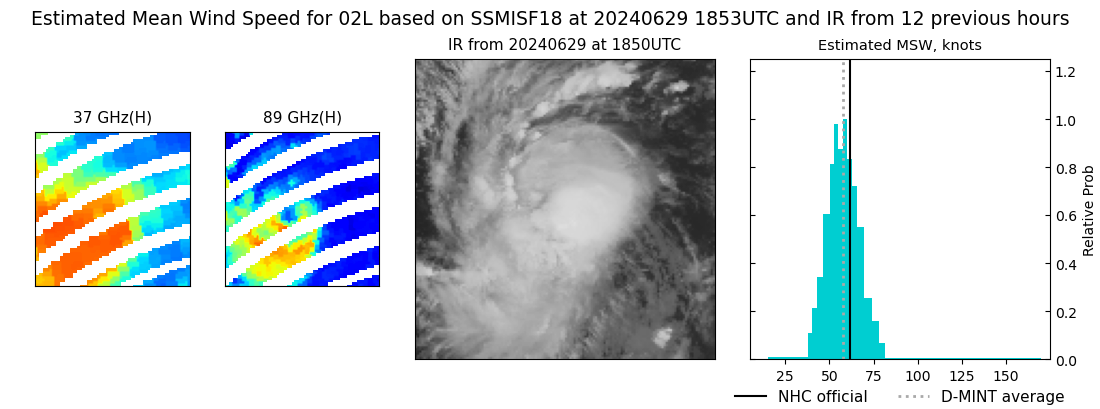 |
| 20240629 | UTC | 20240629 | 1007 hPa | 35 kts | 32 kts | 39 kts | |
| 20240629 | 1707 UTC | ATMS | 1001 hPa | 51 kts | 46 kts | 56 kts |  |
| 20240629 | UTC | 20240629 | 1007 hPa | 35 kts | 32 kts | 39 kts | |
| 20240629 | 1647 UTC | AMSR2 | 998 hPa | 58 kts | 53 kts | 64 kts | 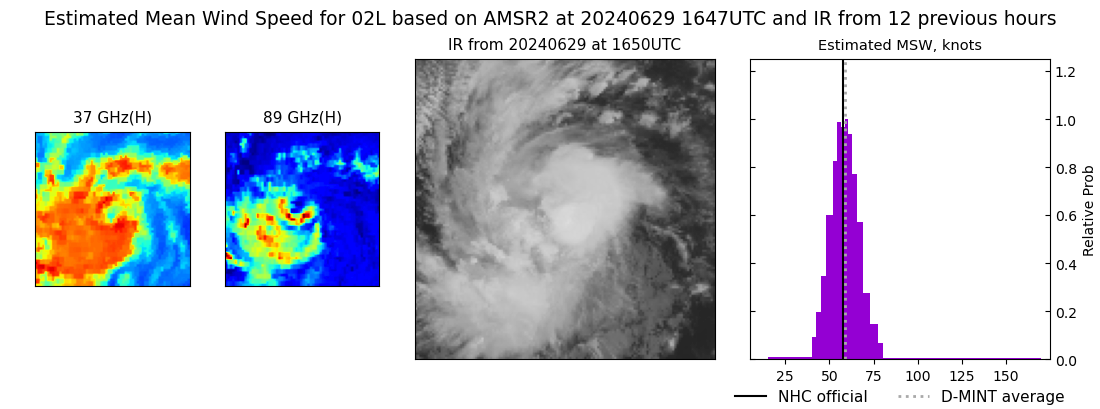 |
| 20240629 | UTC | 20240629 | 1007 hPa | 35 kts | 32 kts | 39 kts | |
| 20240629 | 1616 UTC | ATMS | 991 hPa | 59 kts | 54 kts | 64 kts | 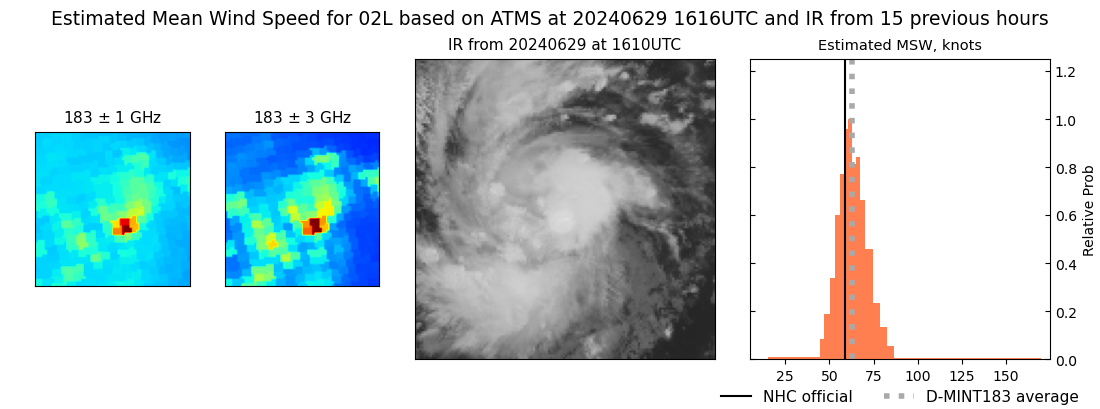 |
| 20240629 | UTC | 20240629 | 1007 hPa | 35 kts | 32 kts | 39 kts | |
| 20240629 | 1013 UTC | TROPICS06 | 993 hPa | 51 kts | 47 kts | 56 kts | 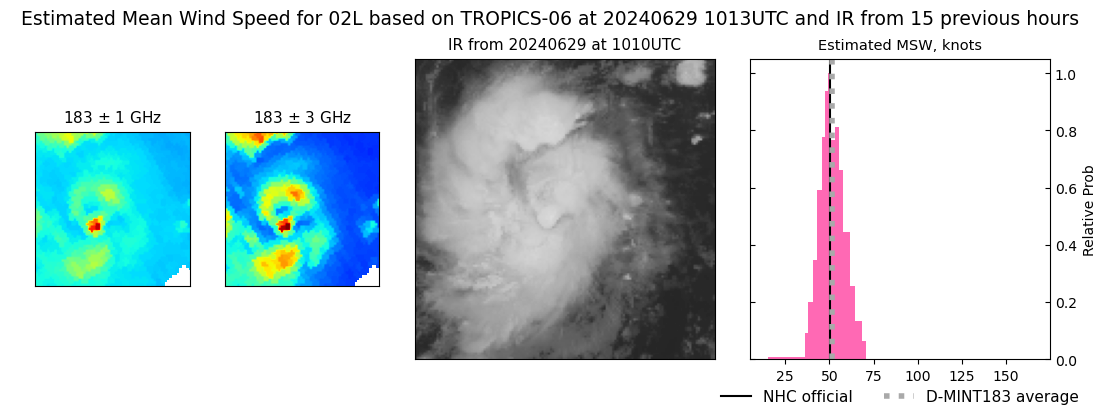 |
| 20240629 | UTC | 20240629 | 1007 hPa | 35 kts | 32 kts | 39 kts | |
| 20240629 | 0752 UTC | TROPICS03 | 1000 hPa | 47 kts | 43 kts | 53 kts | 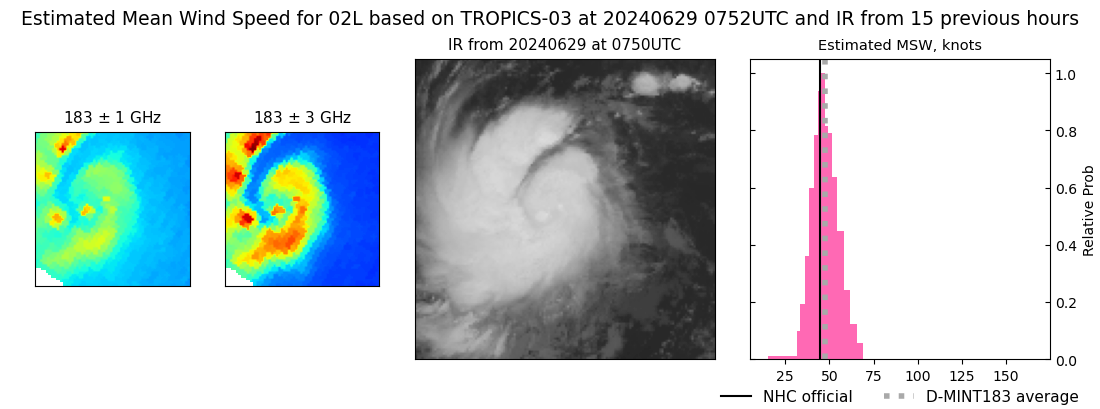 |
| 20240629 | UTC | 20240629 | 1007 hPa | 35 kts | 32 kts | 39 kts | |
| 20240629 | 0445 UTC | ATMS | 1004 hPa | 41 kts | 37 kts | 46 kts | 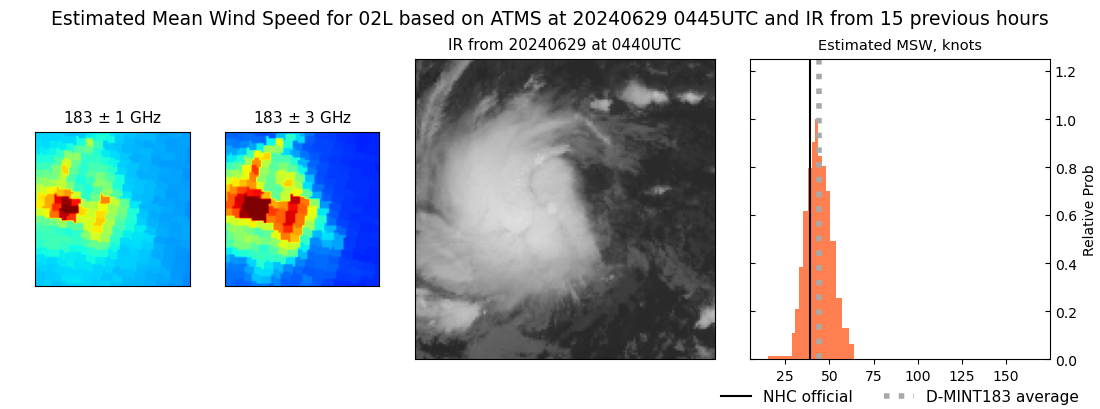 |
| 20240629 | UTC | 20240629 | 1007 hPa | 35 kts | 32 kts | 39 kts | |
| 20240629 | 0420 UTC | AMSR2 | 1007 hPa | 35 kts | 32 kts | 39 kts | 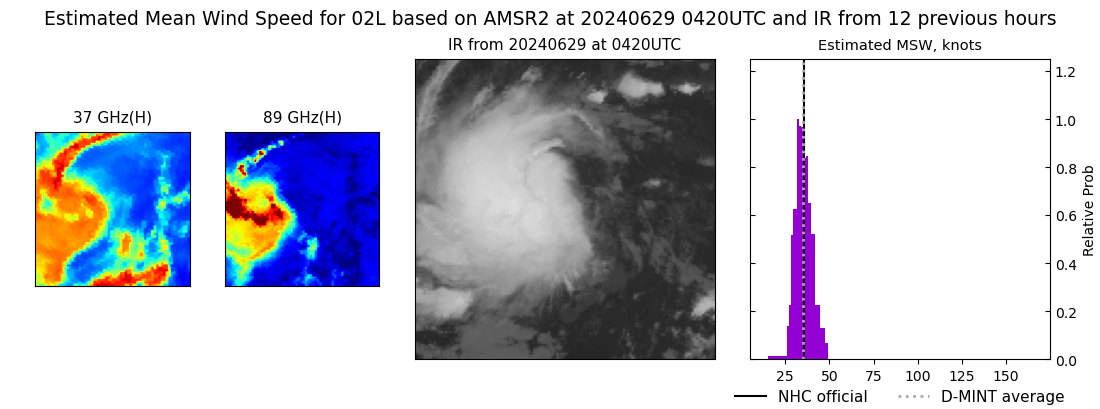 |
| 20240628 | UTC | 20240628 | 1004 hPa | 34 kts | 31 kts | 38 kts | |
| 20240628 | 2146 UTC | TROPICS03 | 1004 hPa | 35 kts | 31 kts | 40 kts | 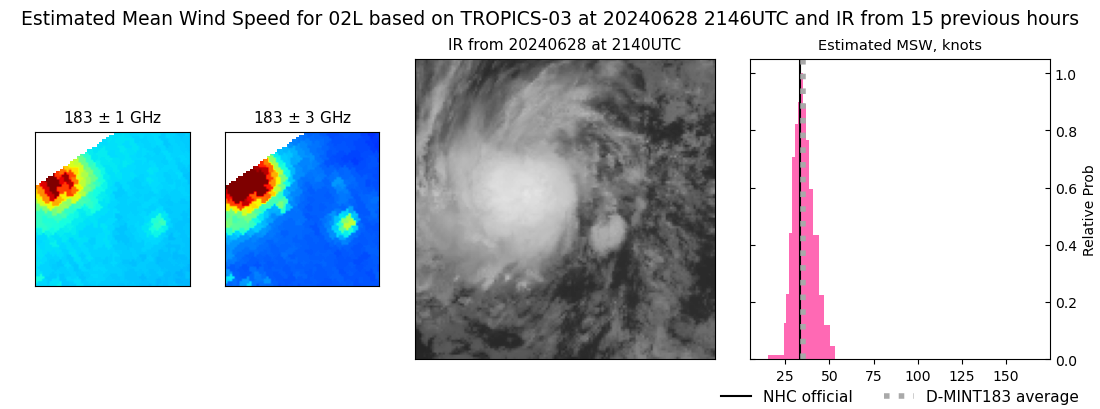 |
| 20240628 | UTC | 20240628 | 1004 hPa | 34 kts | 31 kts | 38 kts | |
| 20240628 | 2036 UTC | SSMISF17 | 1007 hPa | 36 kts | 32 kts | 40 kts | 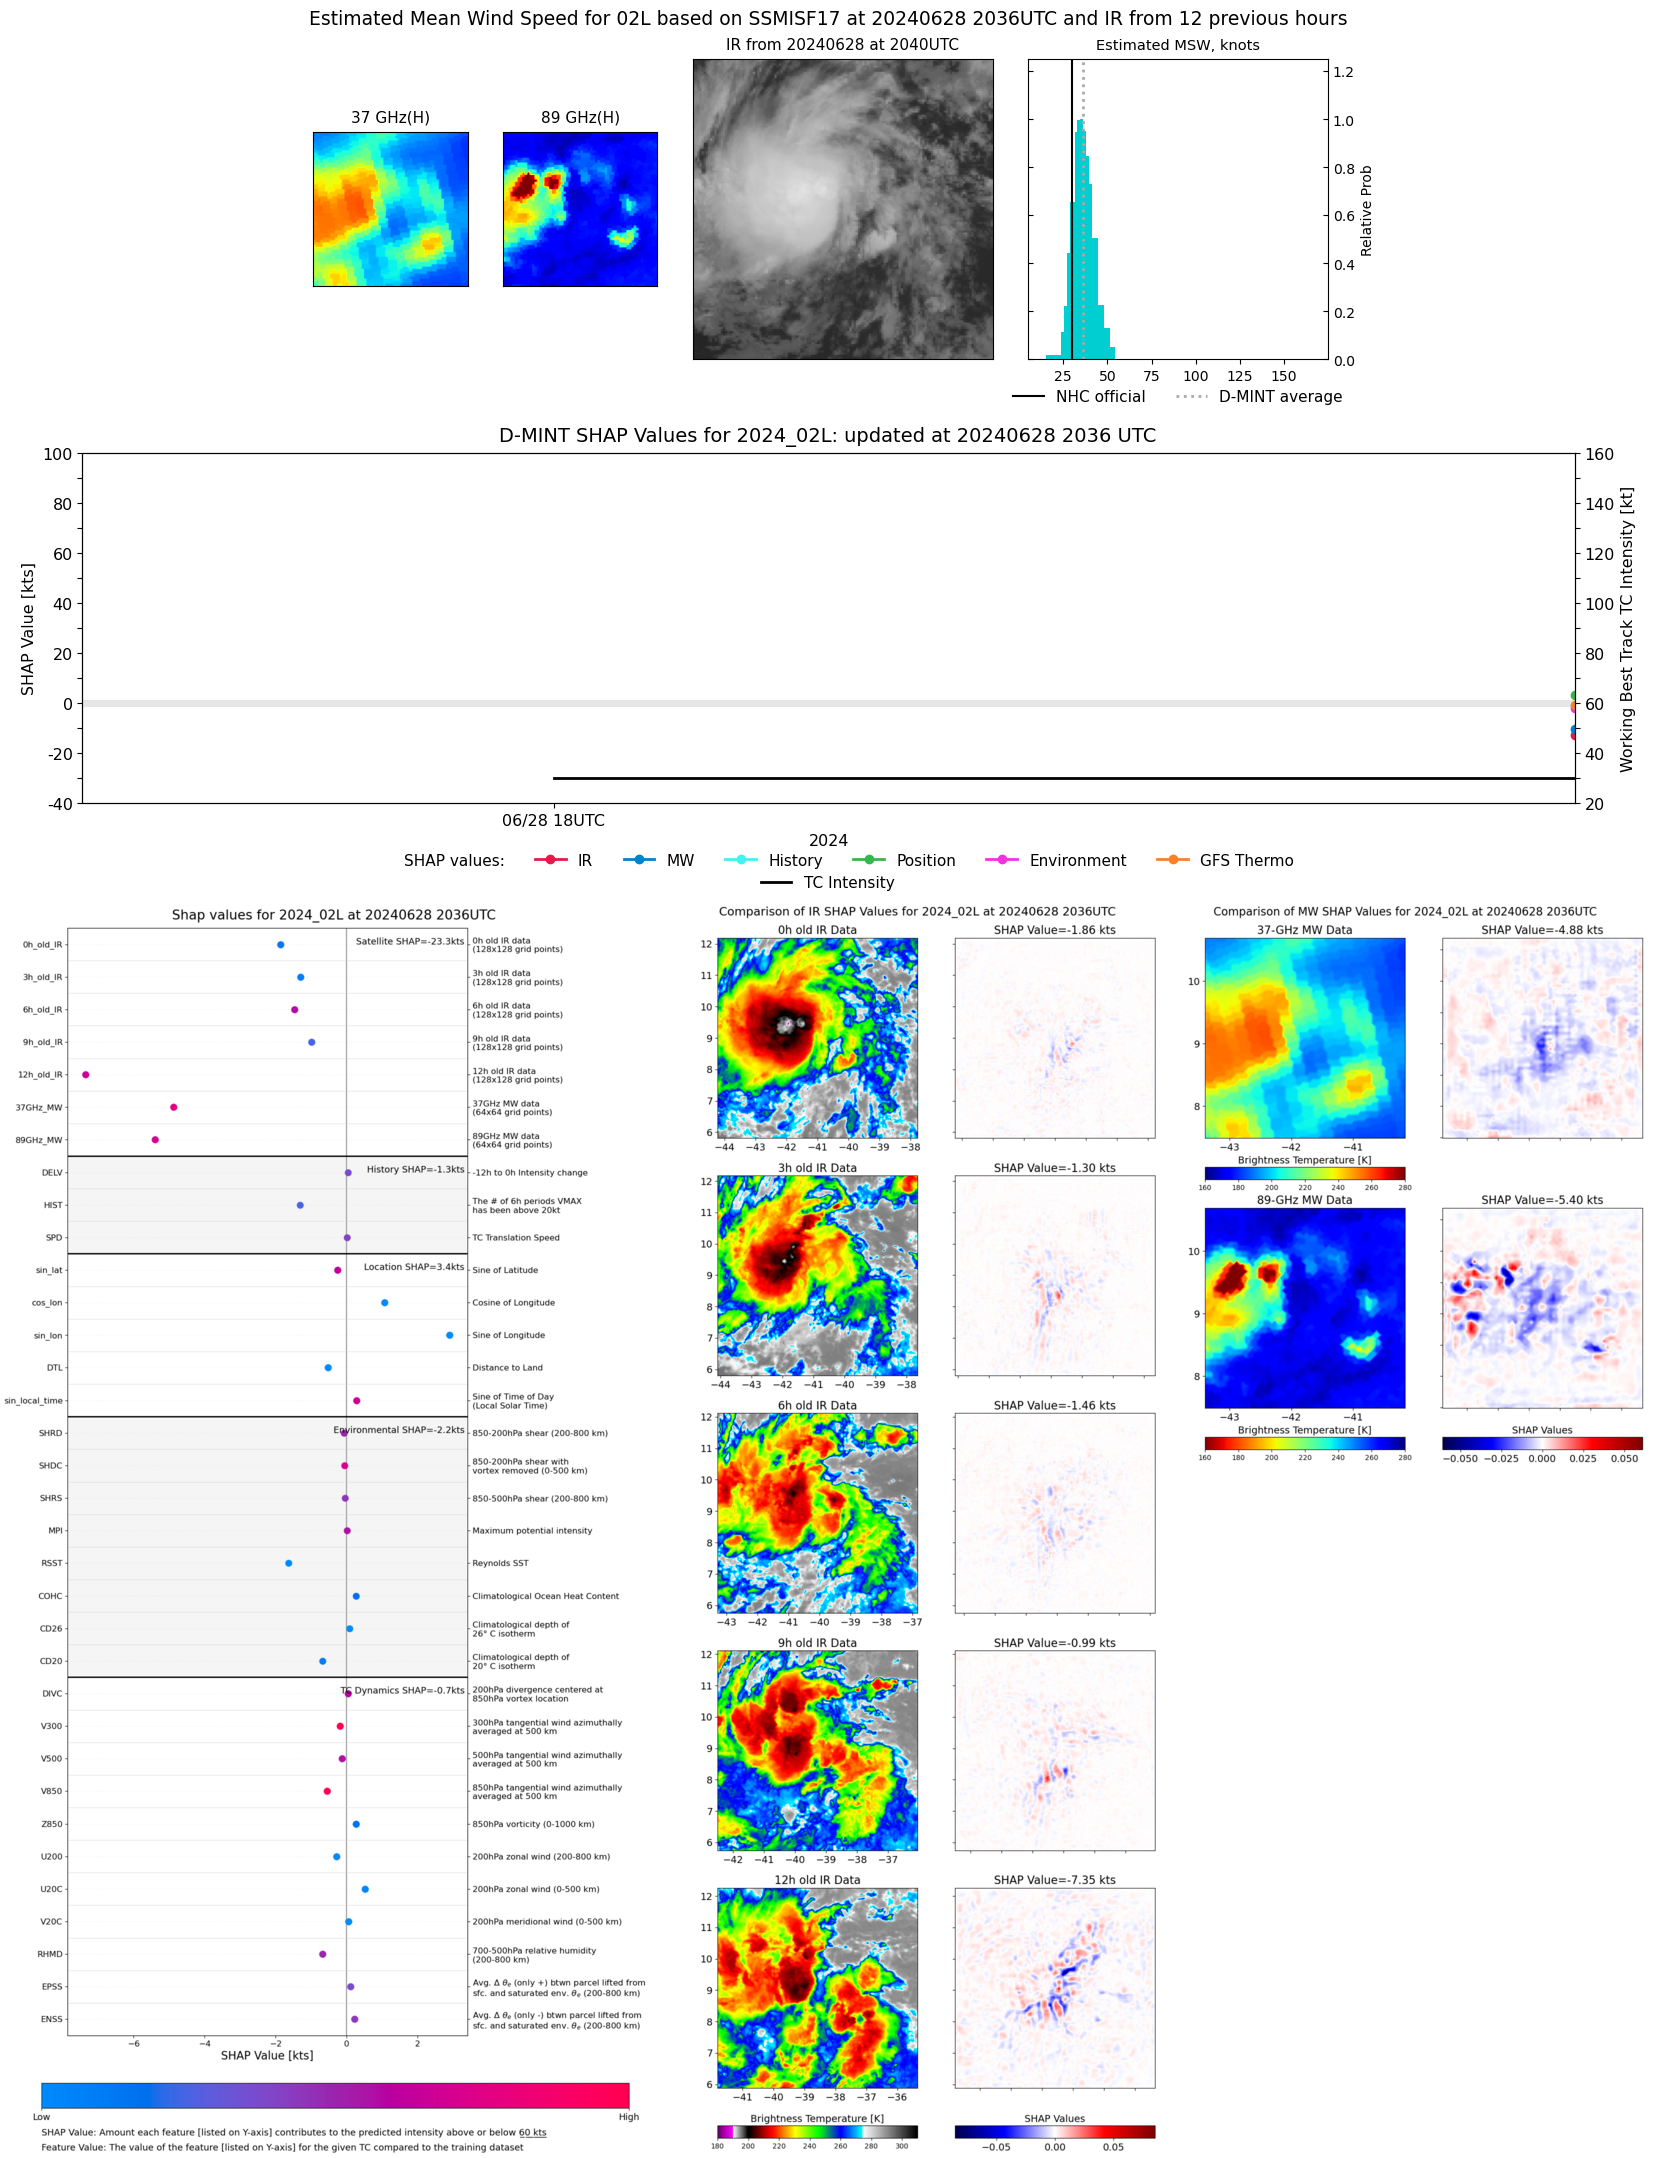 |
| 20240628 | UTC | 20240628 | 1004 hPa | 34 kts | 31 kts | 38 kts | |
| 20240628 | 2011 UTC | TROPICS05 | 1004 hPa | 34 kts | 31 kts | 38 kts | 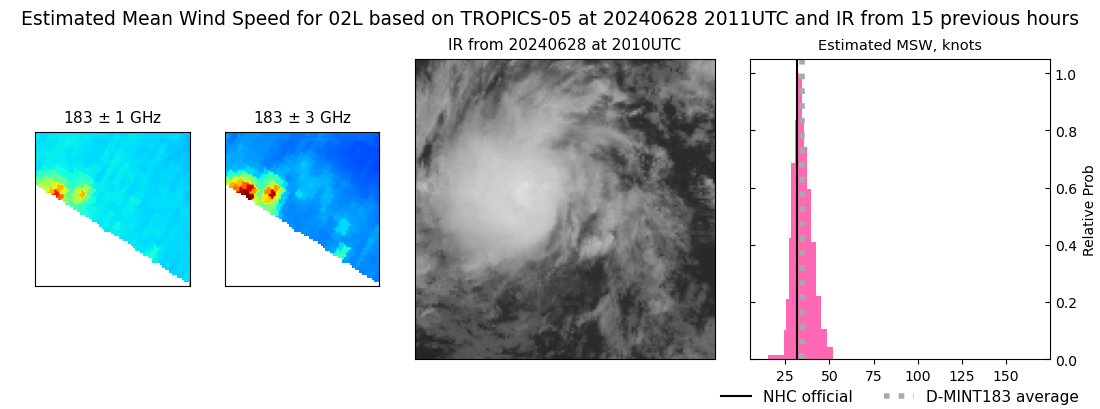 |
| 20240628 | 1604 UTC | AMSR2 | NaN hPa | 33 kts | 29 kts | 37 kts |  |
| 20240628 | 0841 UTC | GMI | NaN hPa | 30 kts | 27 kts | 33 kts |  |
| 20240628 | 0617 UTC | SSMISF18 | NaN hPa | 31 kts | 28 kts | 35 kts |  |
| 20240627 | 2107 UTC | GMI | NaN hPa | 27 kts | 24 kts | 30 kts |  |
| 20240627 | 2049 UTC | SSMISF17 | NaN hPa | 30 kts | 26 kts | 33 kts |  |
| 20240627 | 1521 UTC | AMSR2 | NaN hPa | 23 kts | 21 kts | 26 kts |  |
| 20240627 | 0835 UTC | SSMISF16 | NaN hPa | 25 kts | 22 kts | 28 kts |  |