|
||

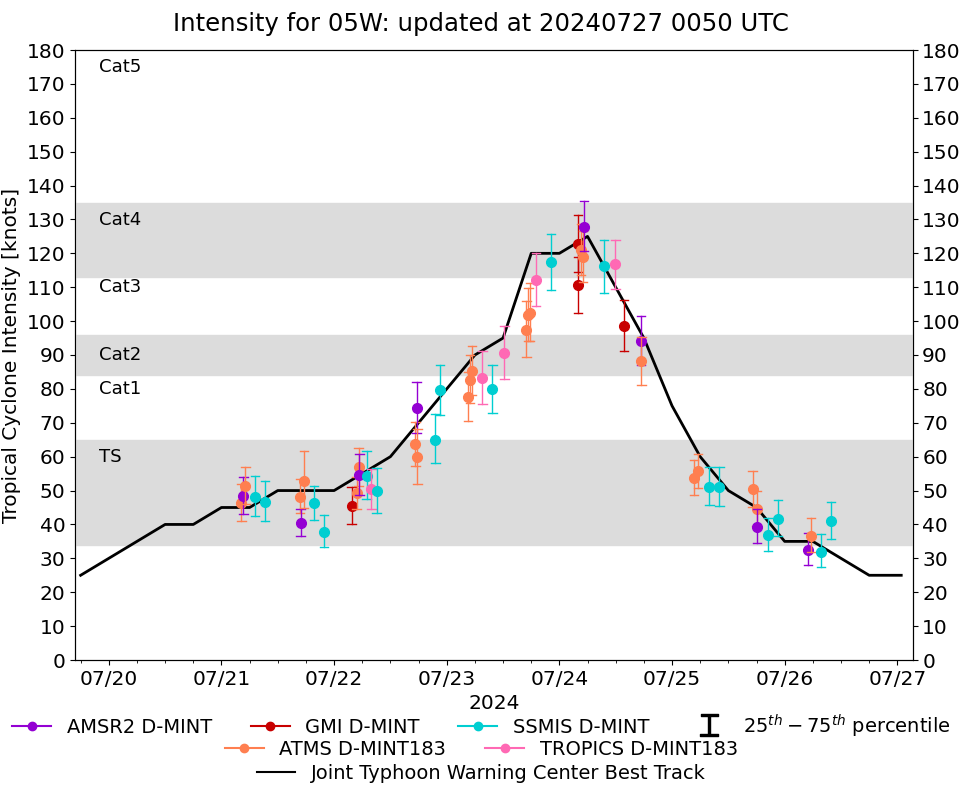 |
D-MINT HISTORY FILE for 2024_05W
| Date | Time | MW Sensor | MSLP | Vmax (30th-70th percentile average) | Vmax 25th percentile | Vmax 75th percentile | Image |
| 20240726 | 0953 UTC | SSMISF16 | 982 hPa | 41 kts | 36 kts | 47 kts | 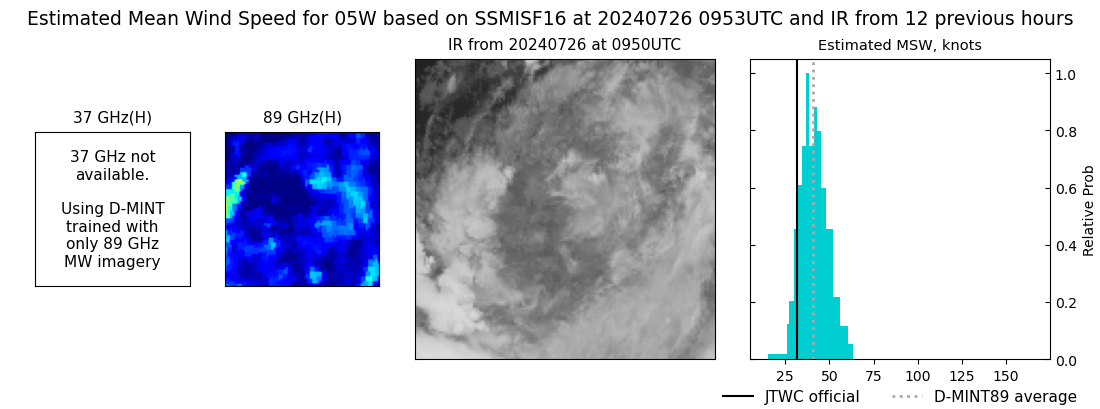 |
| 20240726 | 0745 UTC | SSMISF18 | 985 hPa | 32 kts | 27 kts | 37 kts | 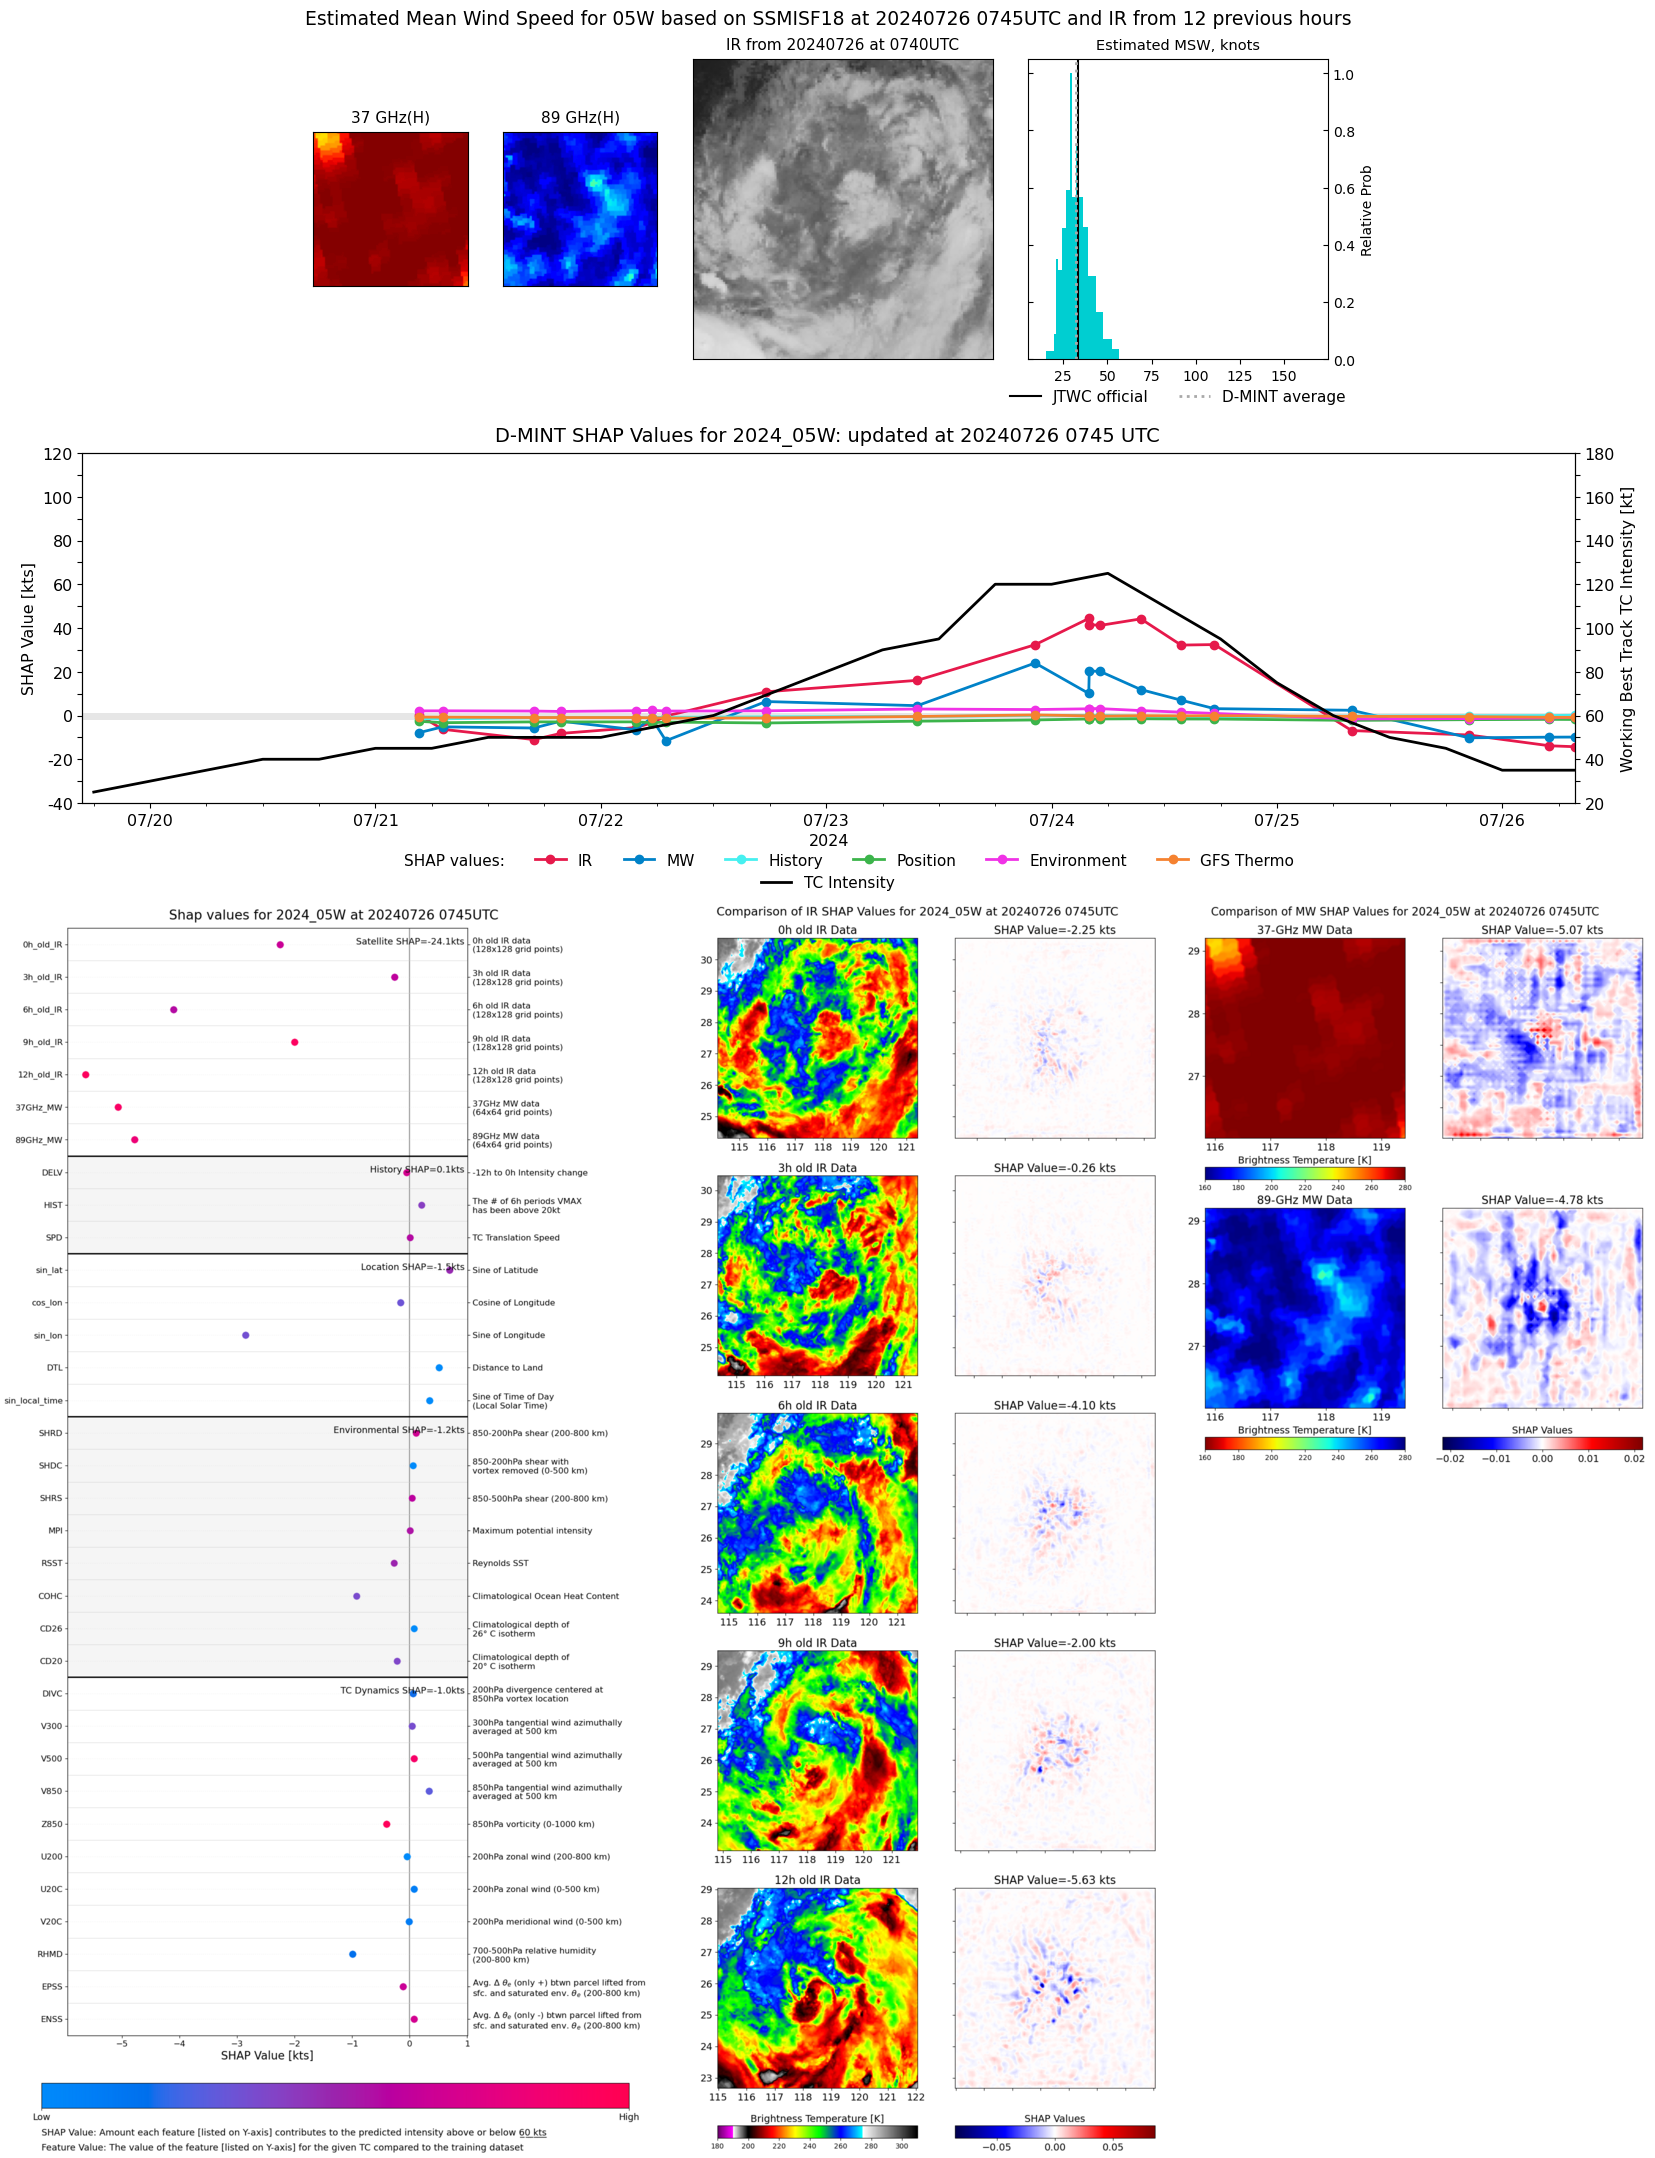 |
| 20240726 | 0540 UTC | ATMS-NPP | 985 hPa | 36 kts | 32 kts | 42 kts | 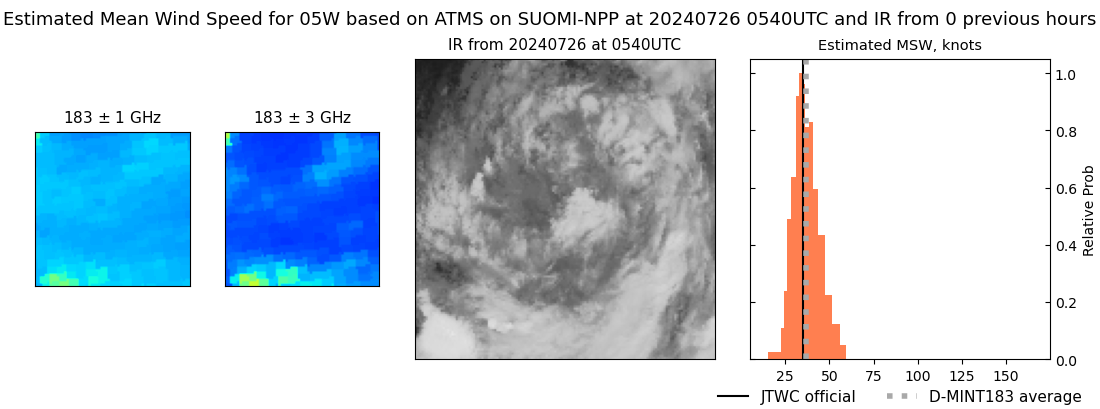 |
| 20240726 | 0502 UTC | AMSR2 | 985 hPa | 32 kts | 28 kts | 38 kts | 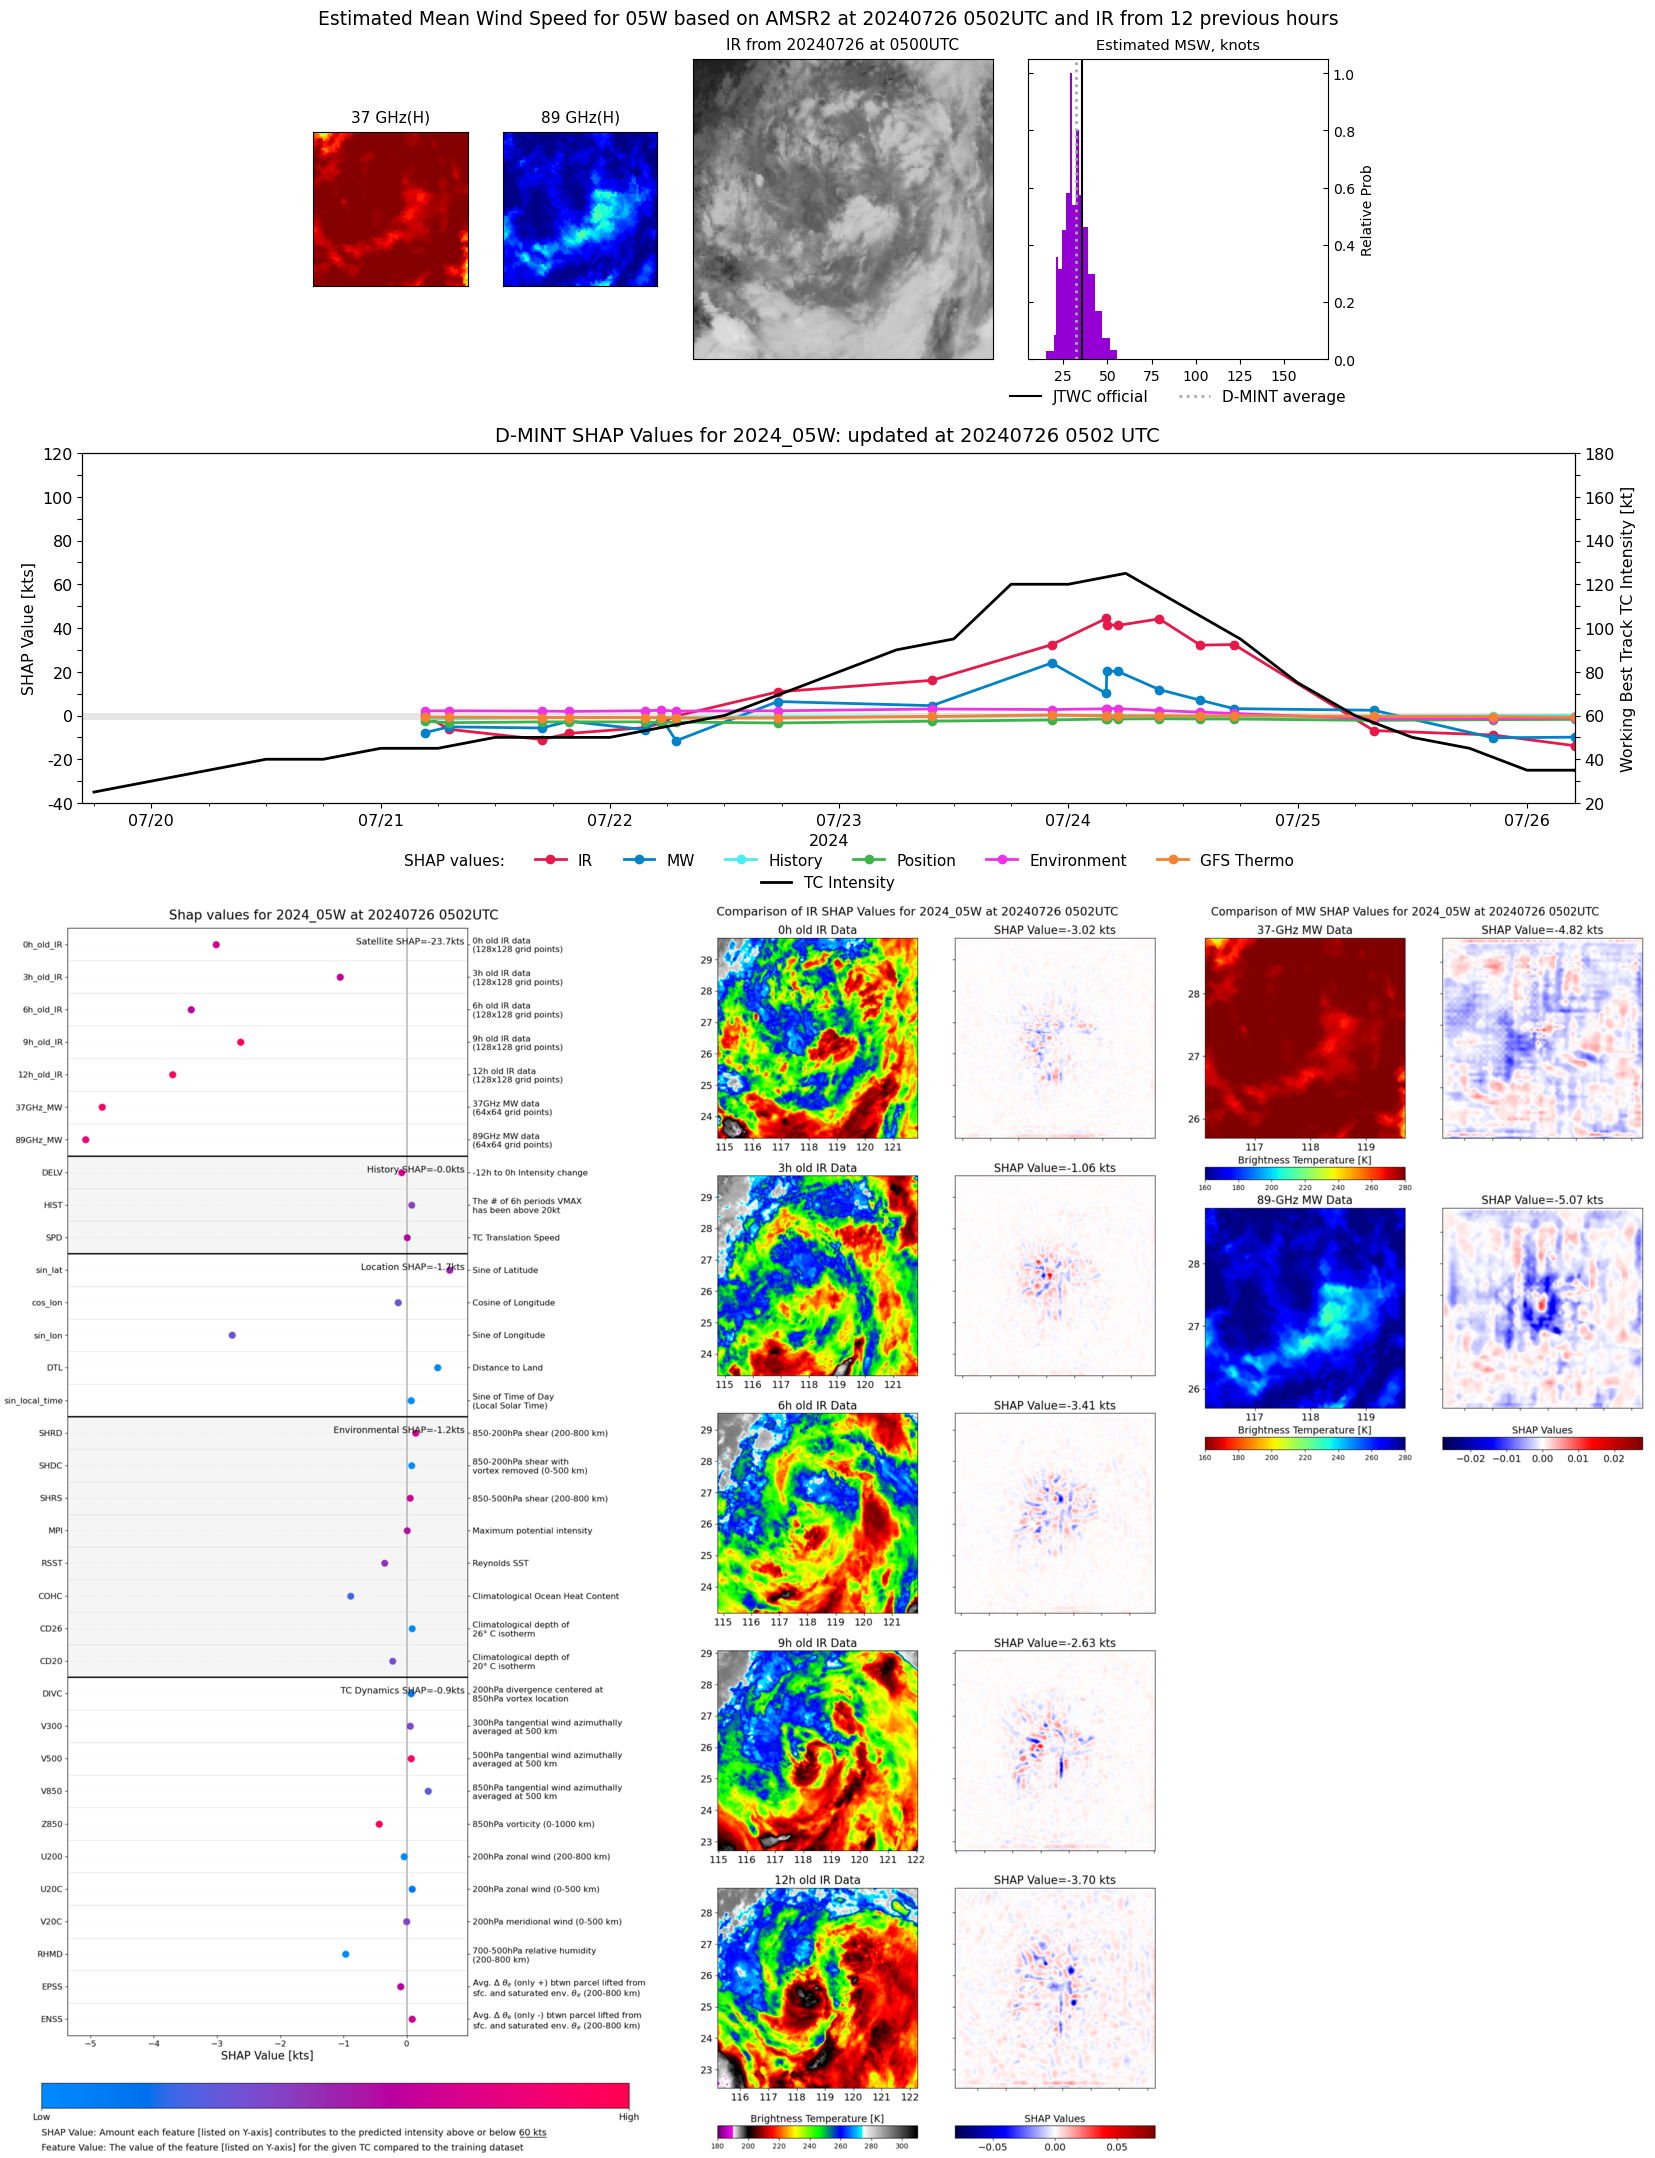 |
| 20240725 | 2235 UTC | SSMISF16 | 983 hPa | 42 kts | 36 kts | 47 kts | 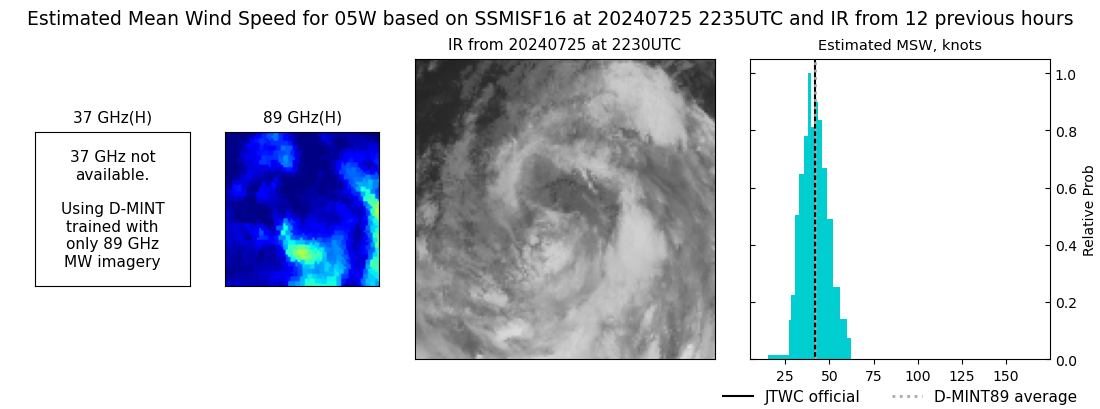 |
| 20240725 | 2027 UTC | SSMISF18 | 980 hPa | 37 kts | 32 kts | 42 kts |  |
| 20240725 | 1804 UTC | AMSR2 | 983 hPa | 39 kts | 35 kts | 45 kts |  |
| 20240725 | 1801 UTC | ATMS-N21 | 974 hPa | 44 kts | 40 kts | 50 kts | 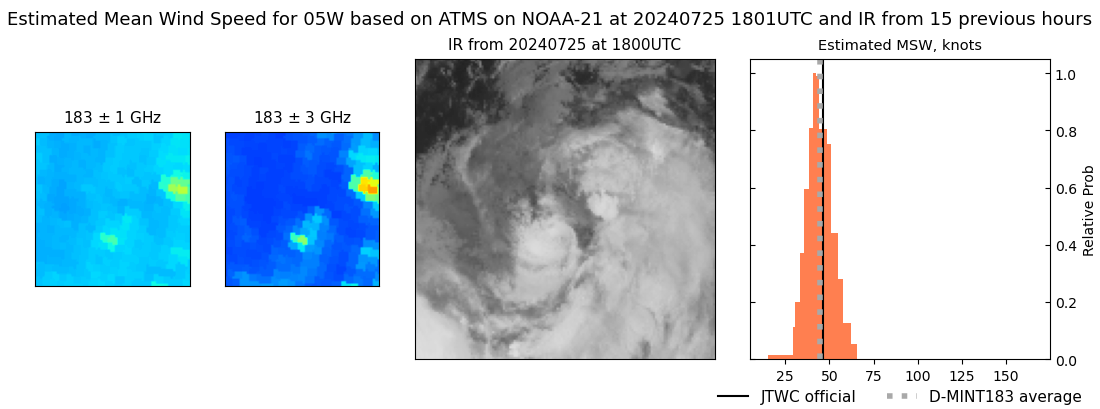 |
| 20240725 | 1710 UTC | ATMS-N20 | 976 hPa | 50 kts | 45 kts | 56 kts | 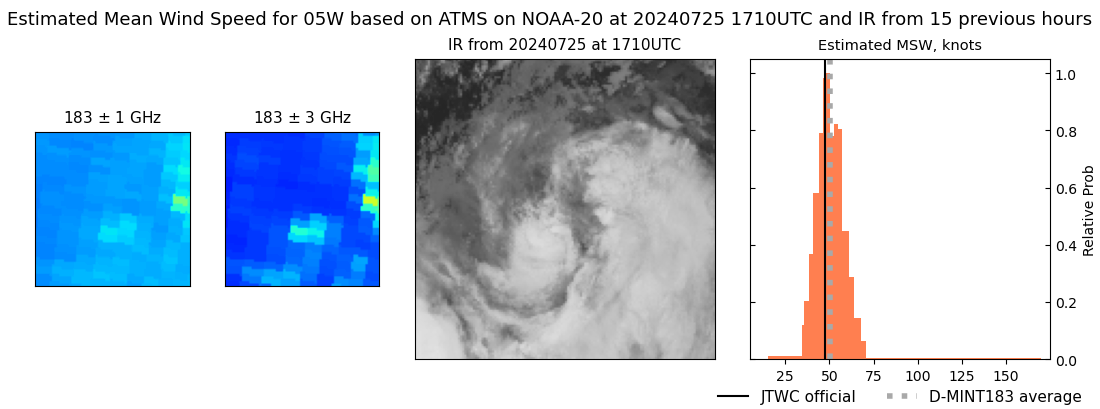 |
| 20240725 | 1006 UTC | SSMISF16 | 978 hPa | 51 kts | 45 kts | 57 kts |  |
| 20240725 | 0758 UTC | SSMISF18 | 978 hPa | 51 kts | 46 kts | 57 kts | 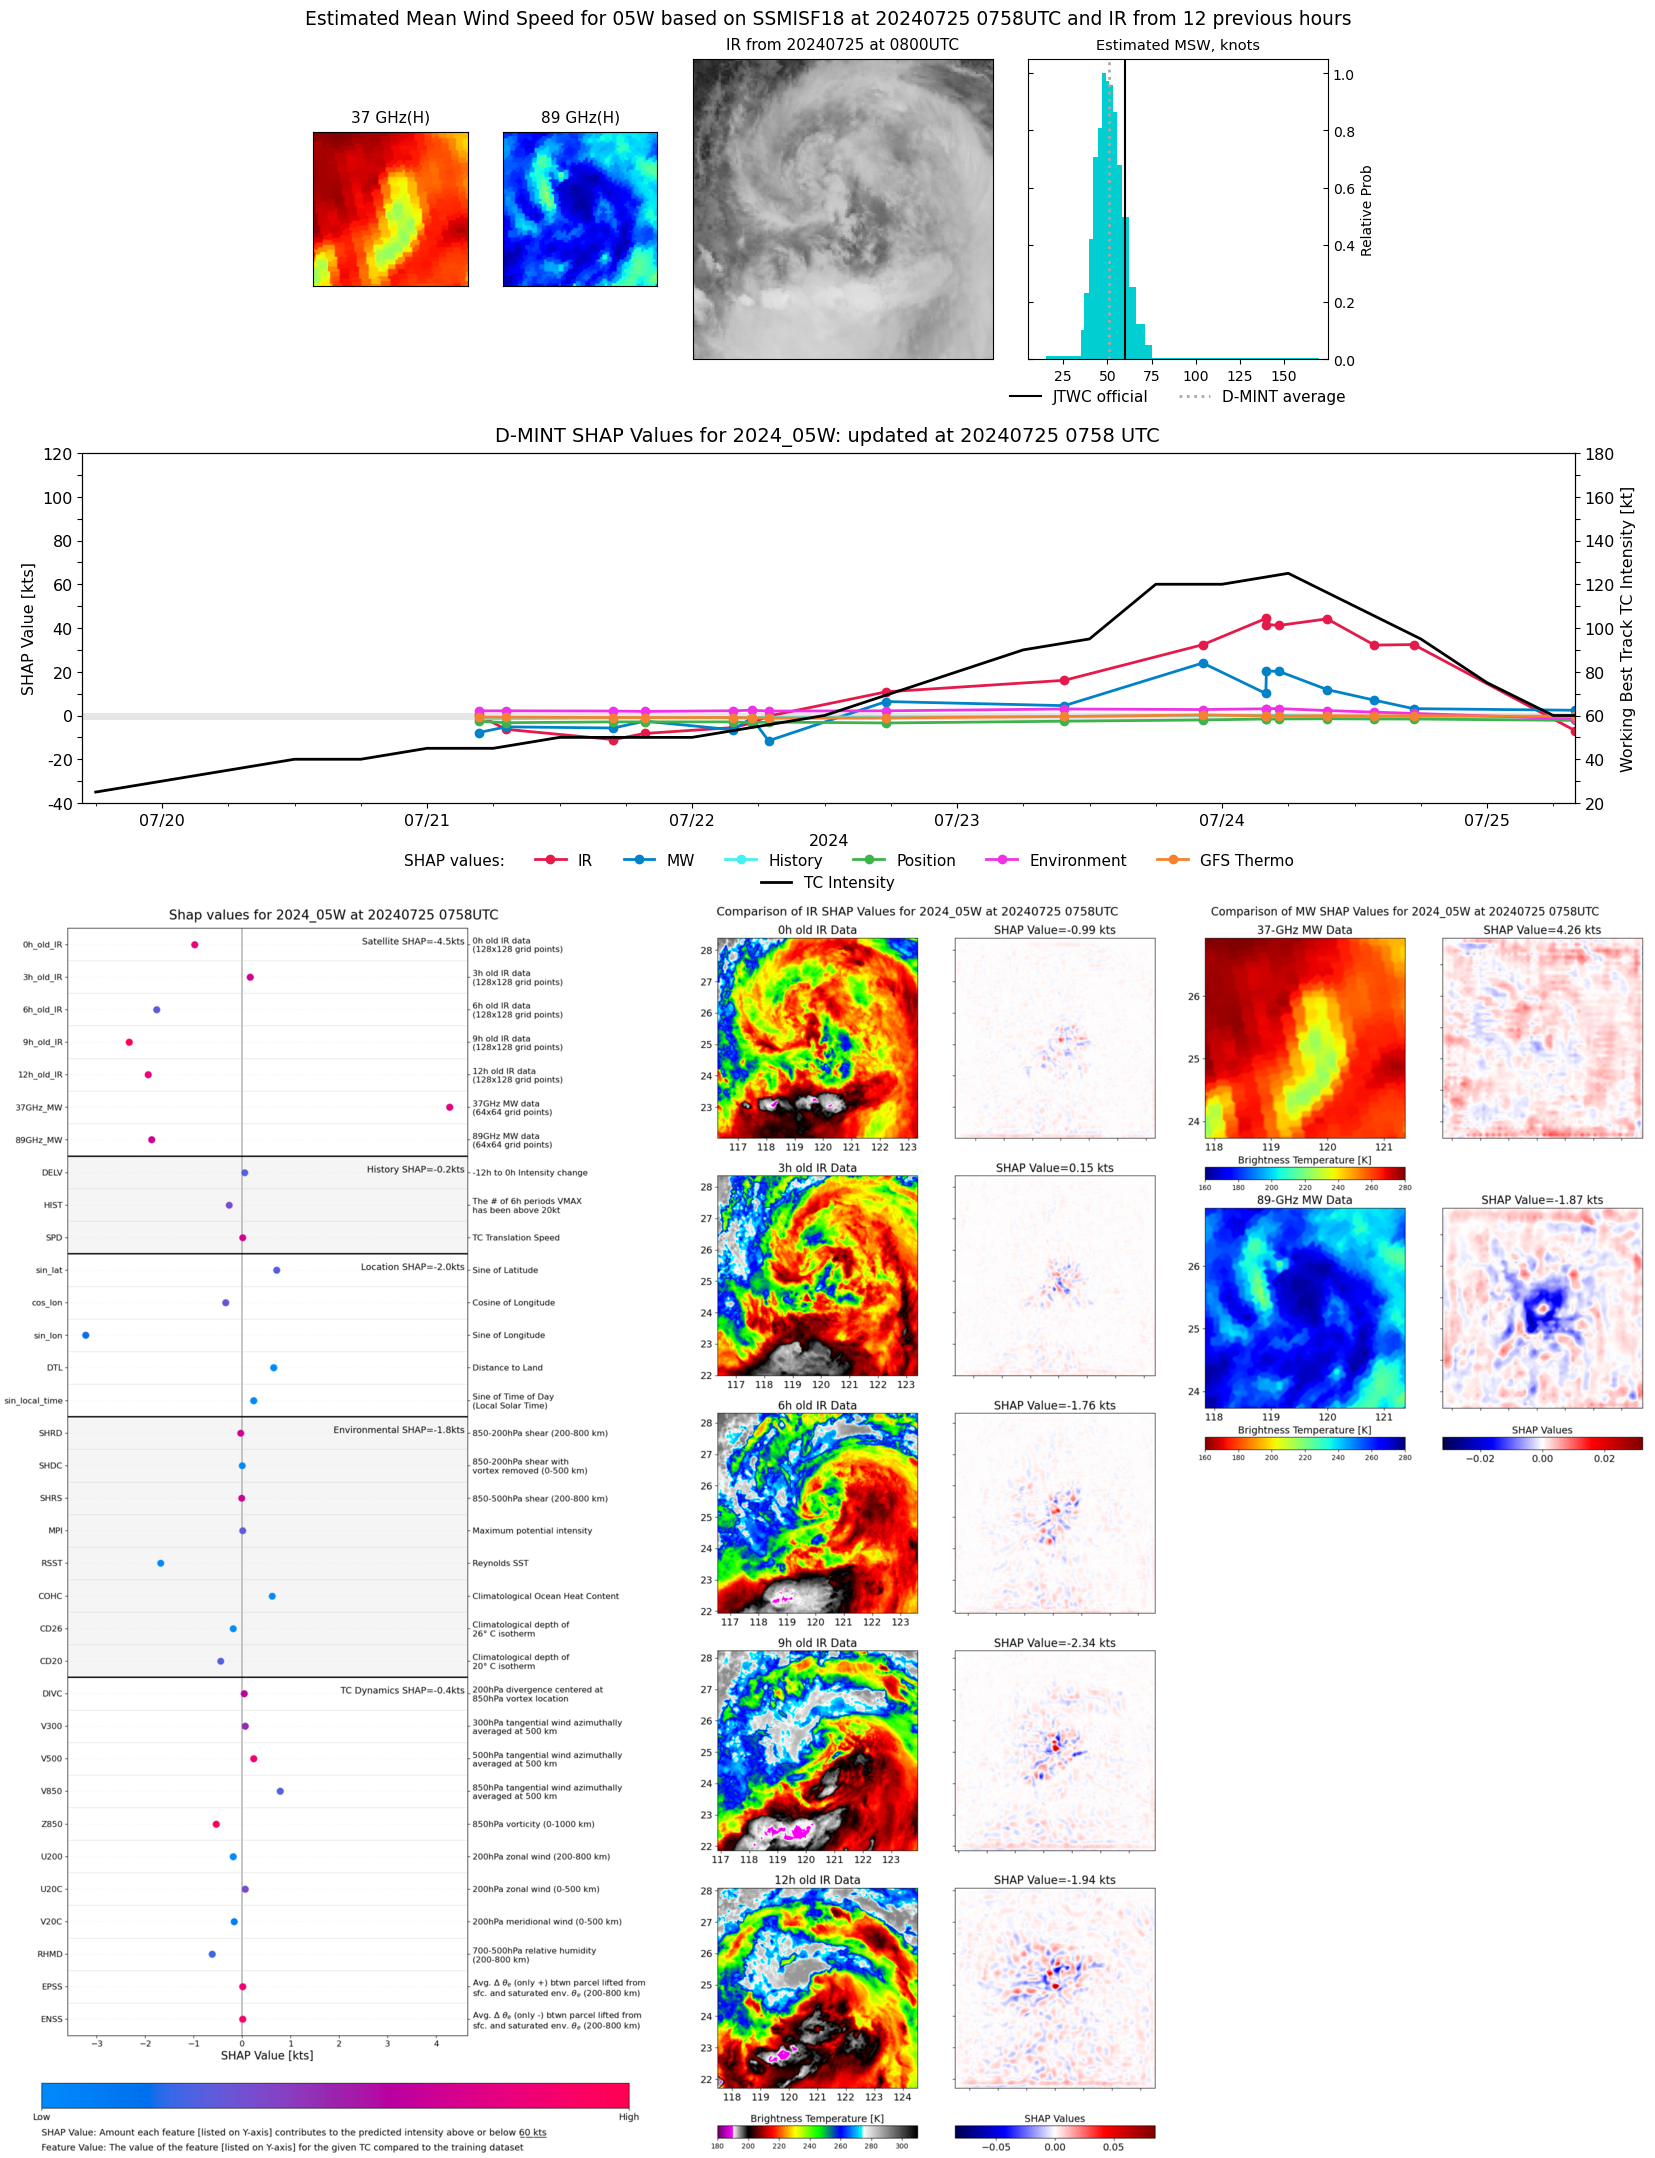 |
| 20240725 | 0534 UTC | ATMS-N21 | 971 hPa | 56 kts | 51 kts | 61 kts | 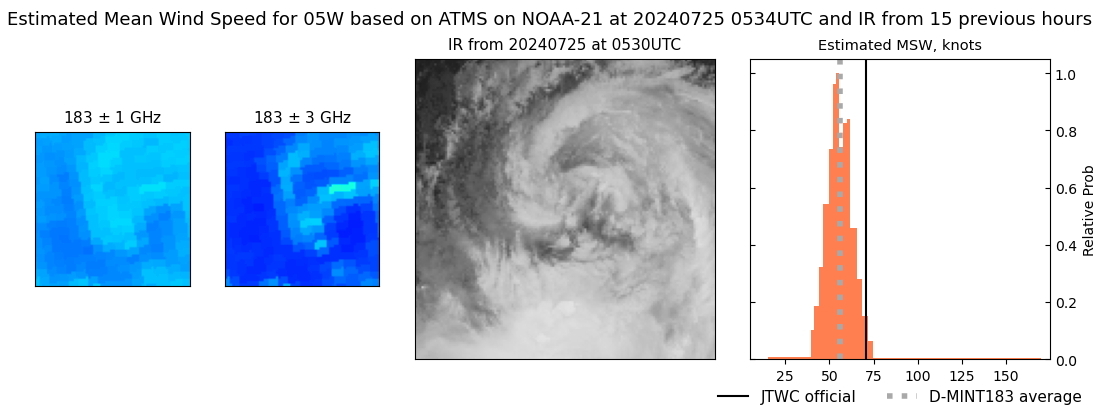 |
| 20240725 | 0443 UTC | ATMS-N20 | 971 hPa | 54 kts | 49 kts | 59 kts | 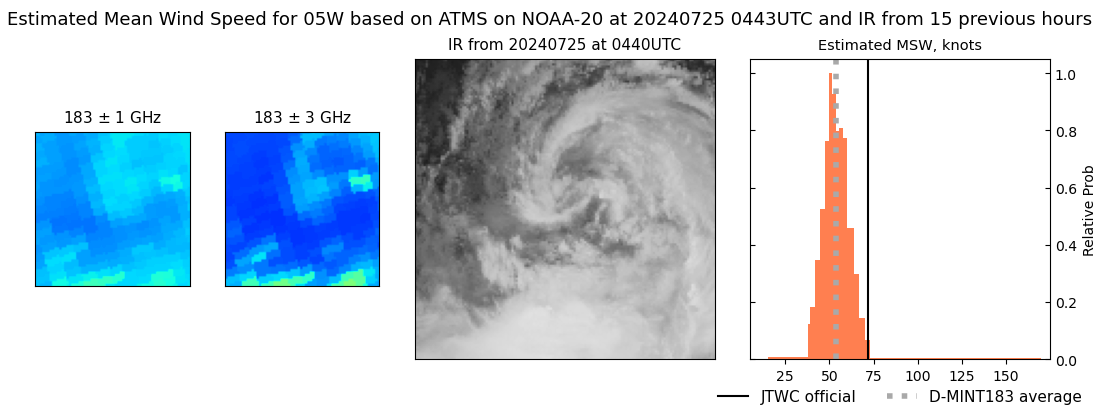 |
| 20240724 | 1729 UTC | ATMS-N20 | 947 hPa | 88 kts | 81 kts | 95 kts | 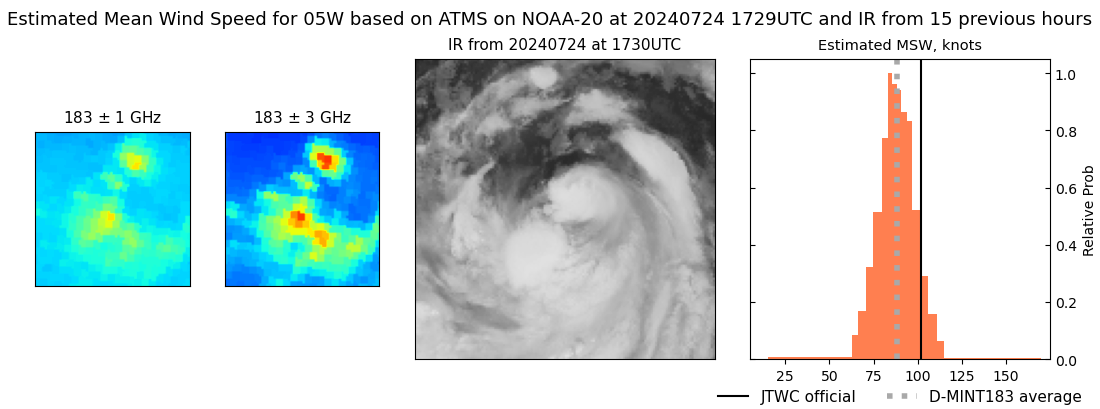 |
| 20240724 | 1721 UTC | AMSR2 | 945 hPa | 94 kts | 87 kts | 101 kts | 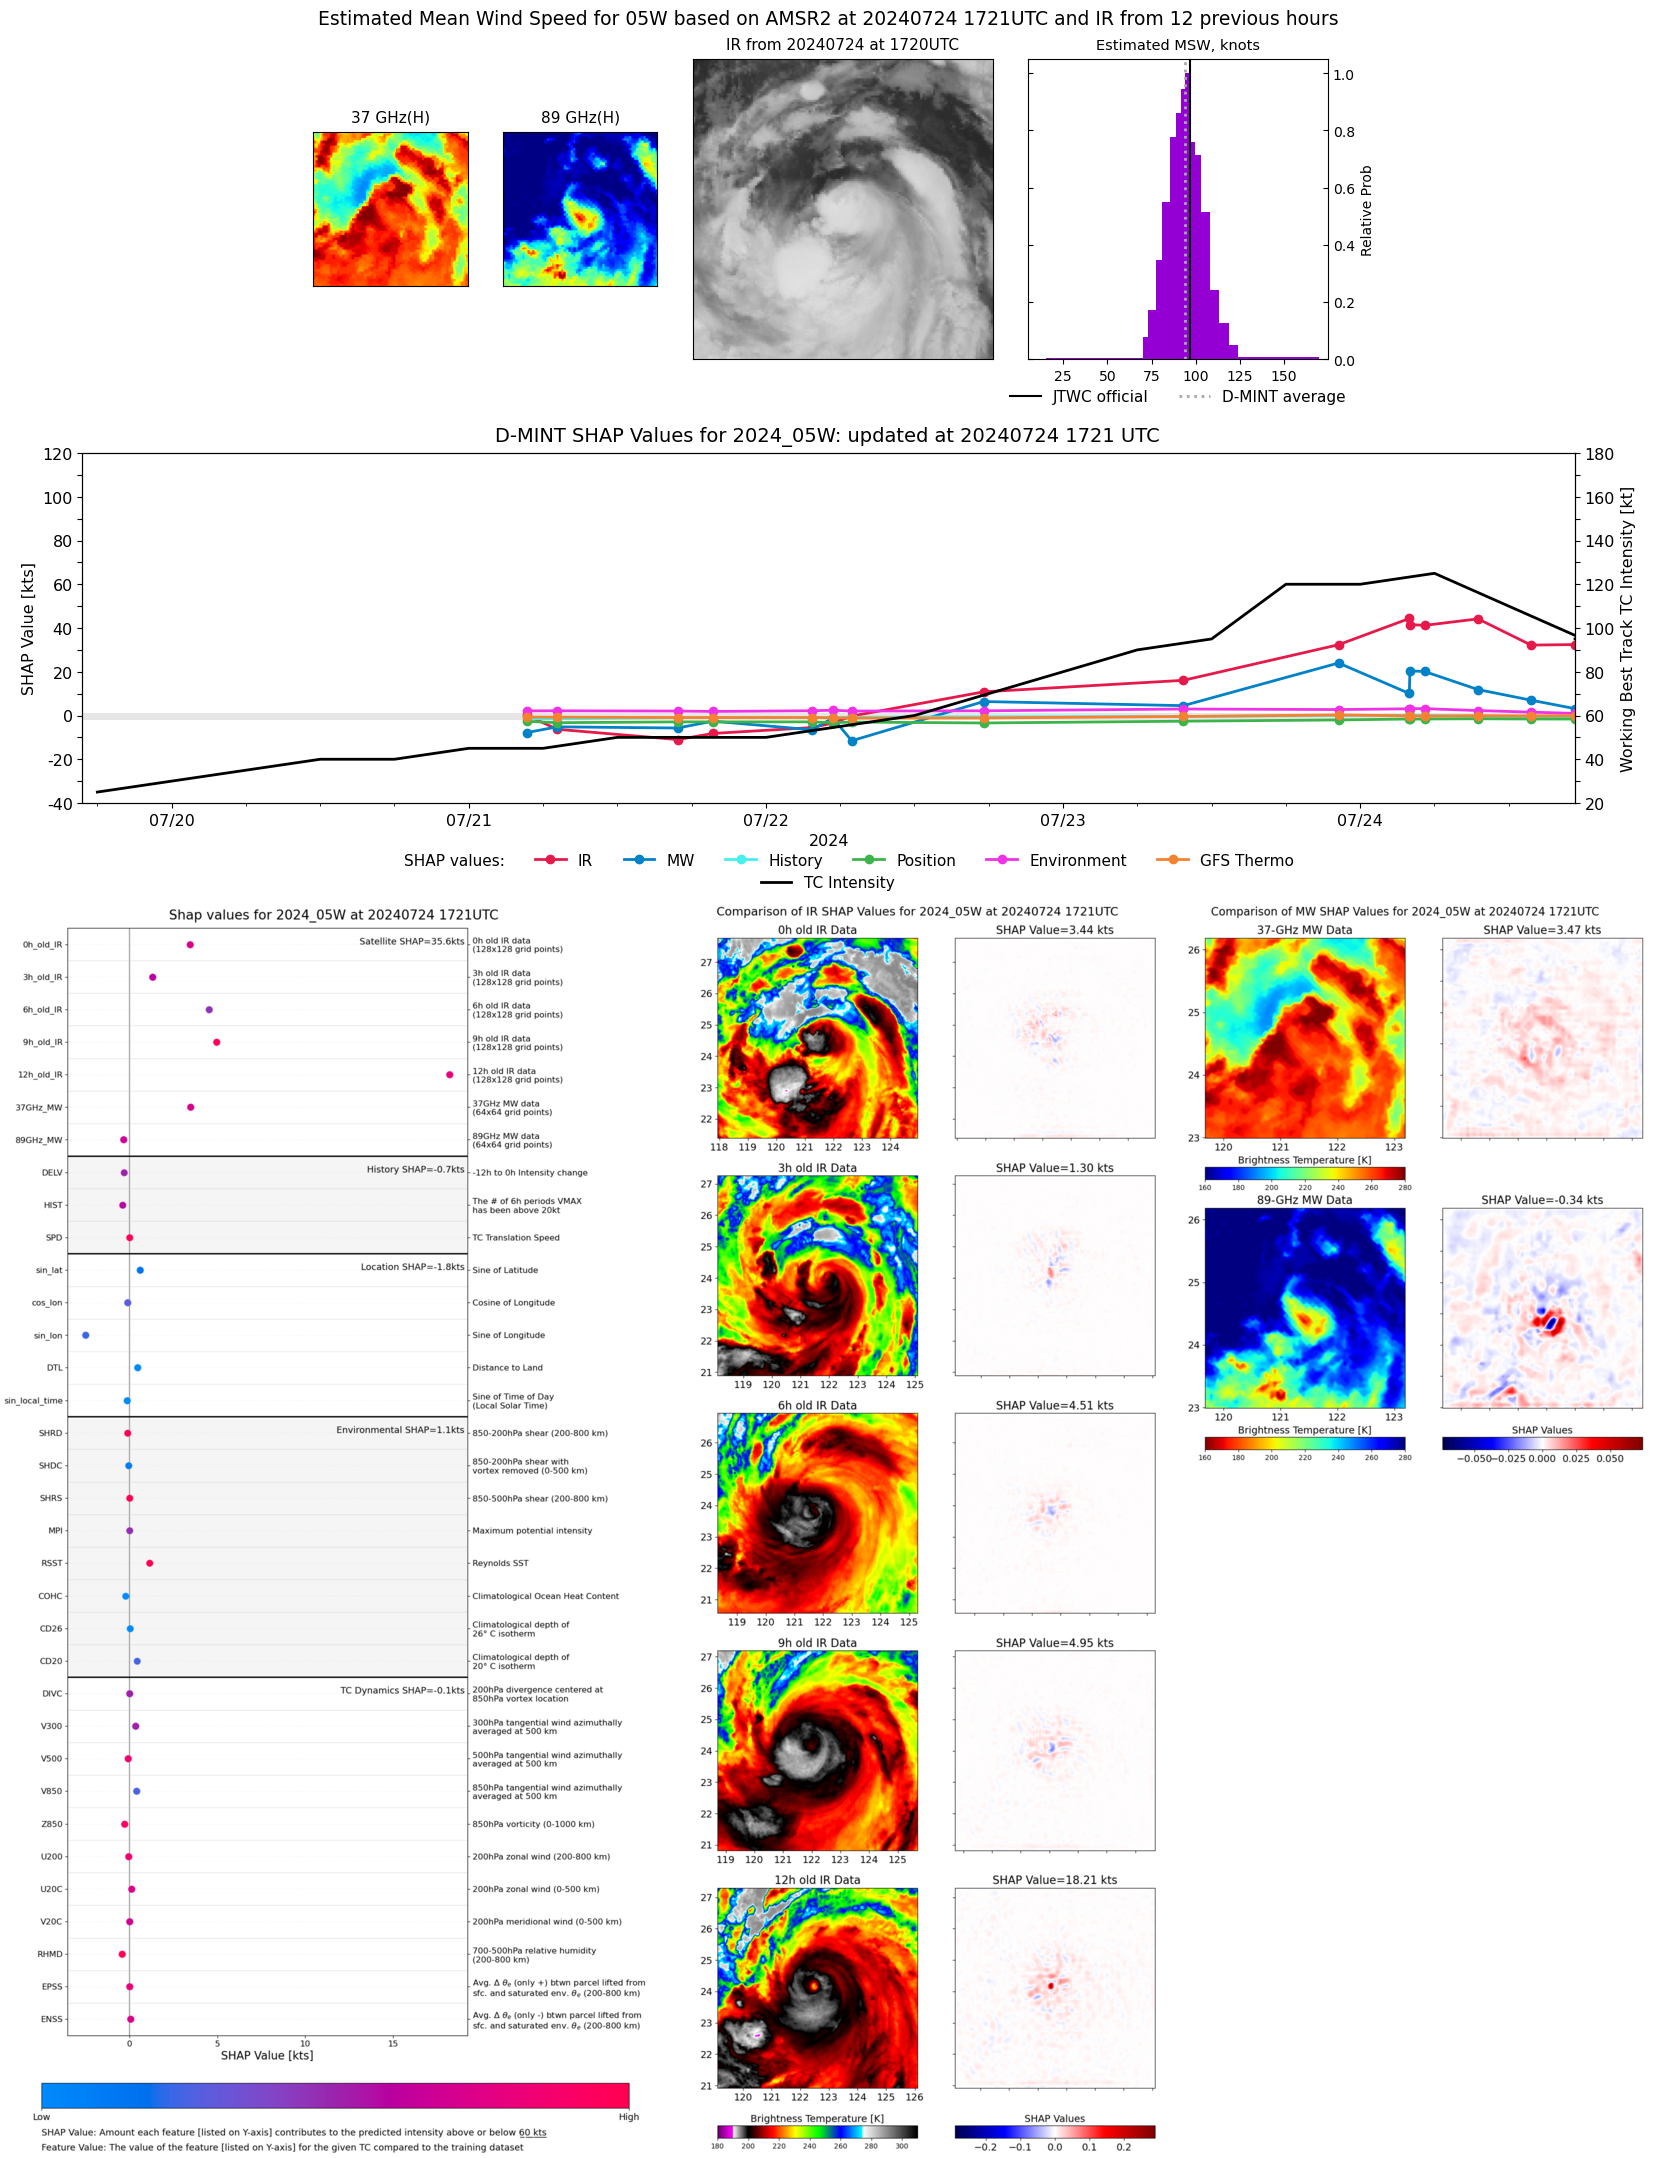 |
| 20240724 | 1348 UTC | GMI | 941 hPa | 99 kts | 91 kts | 106 kts | 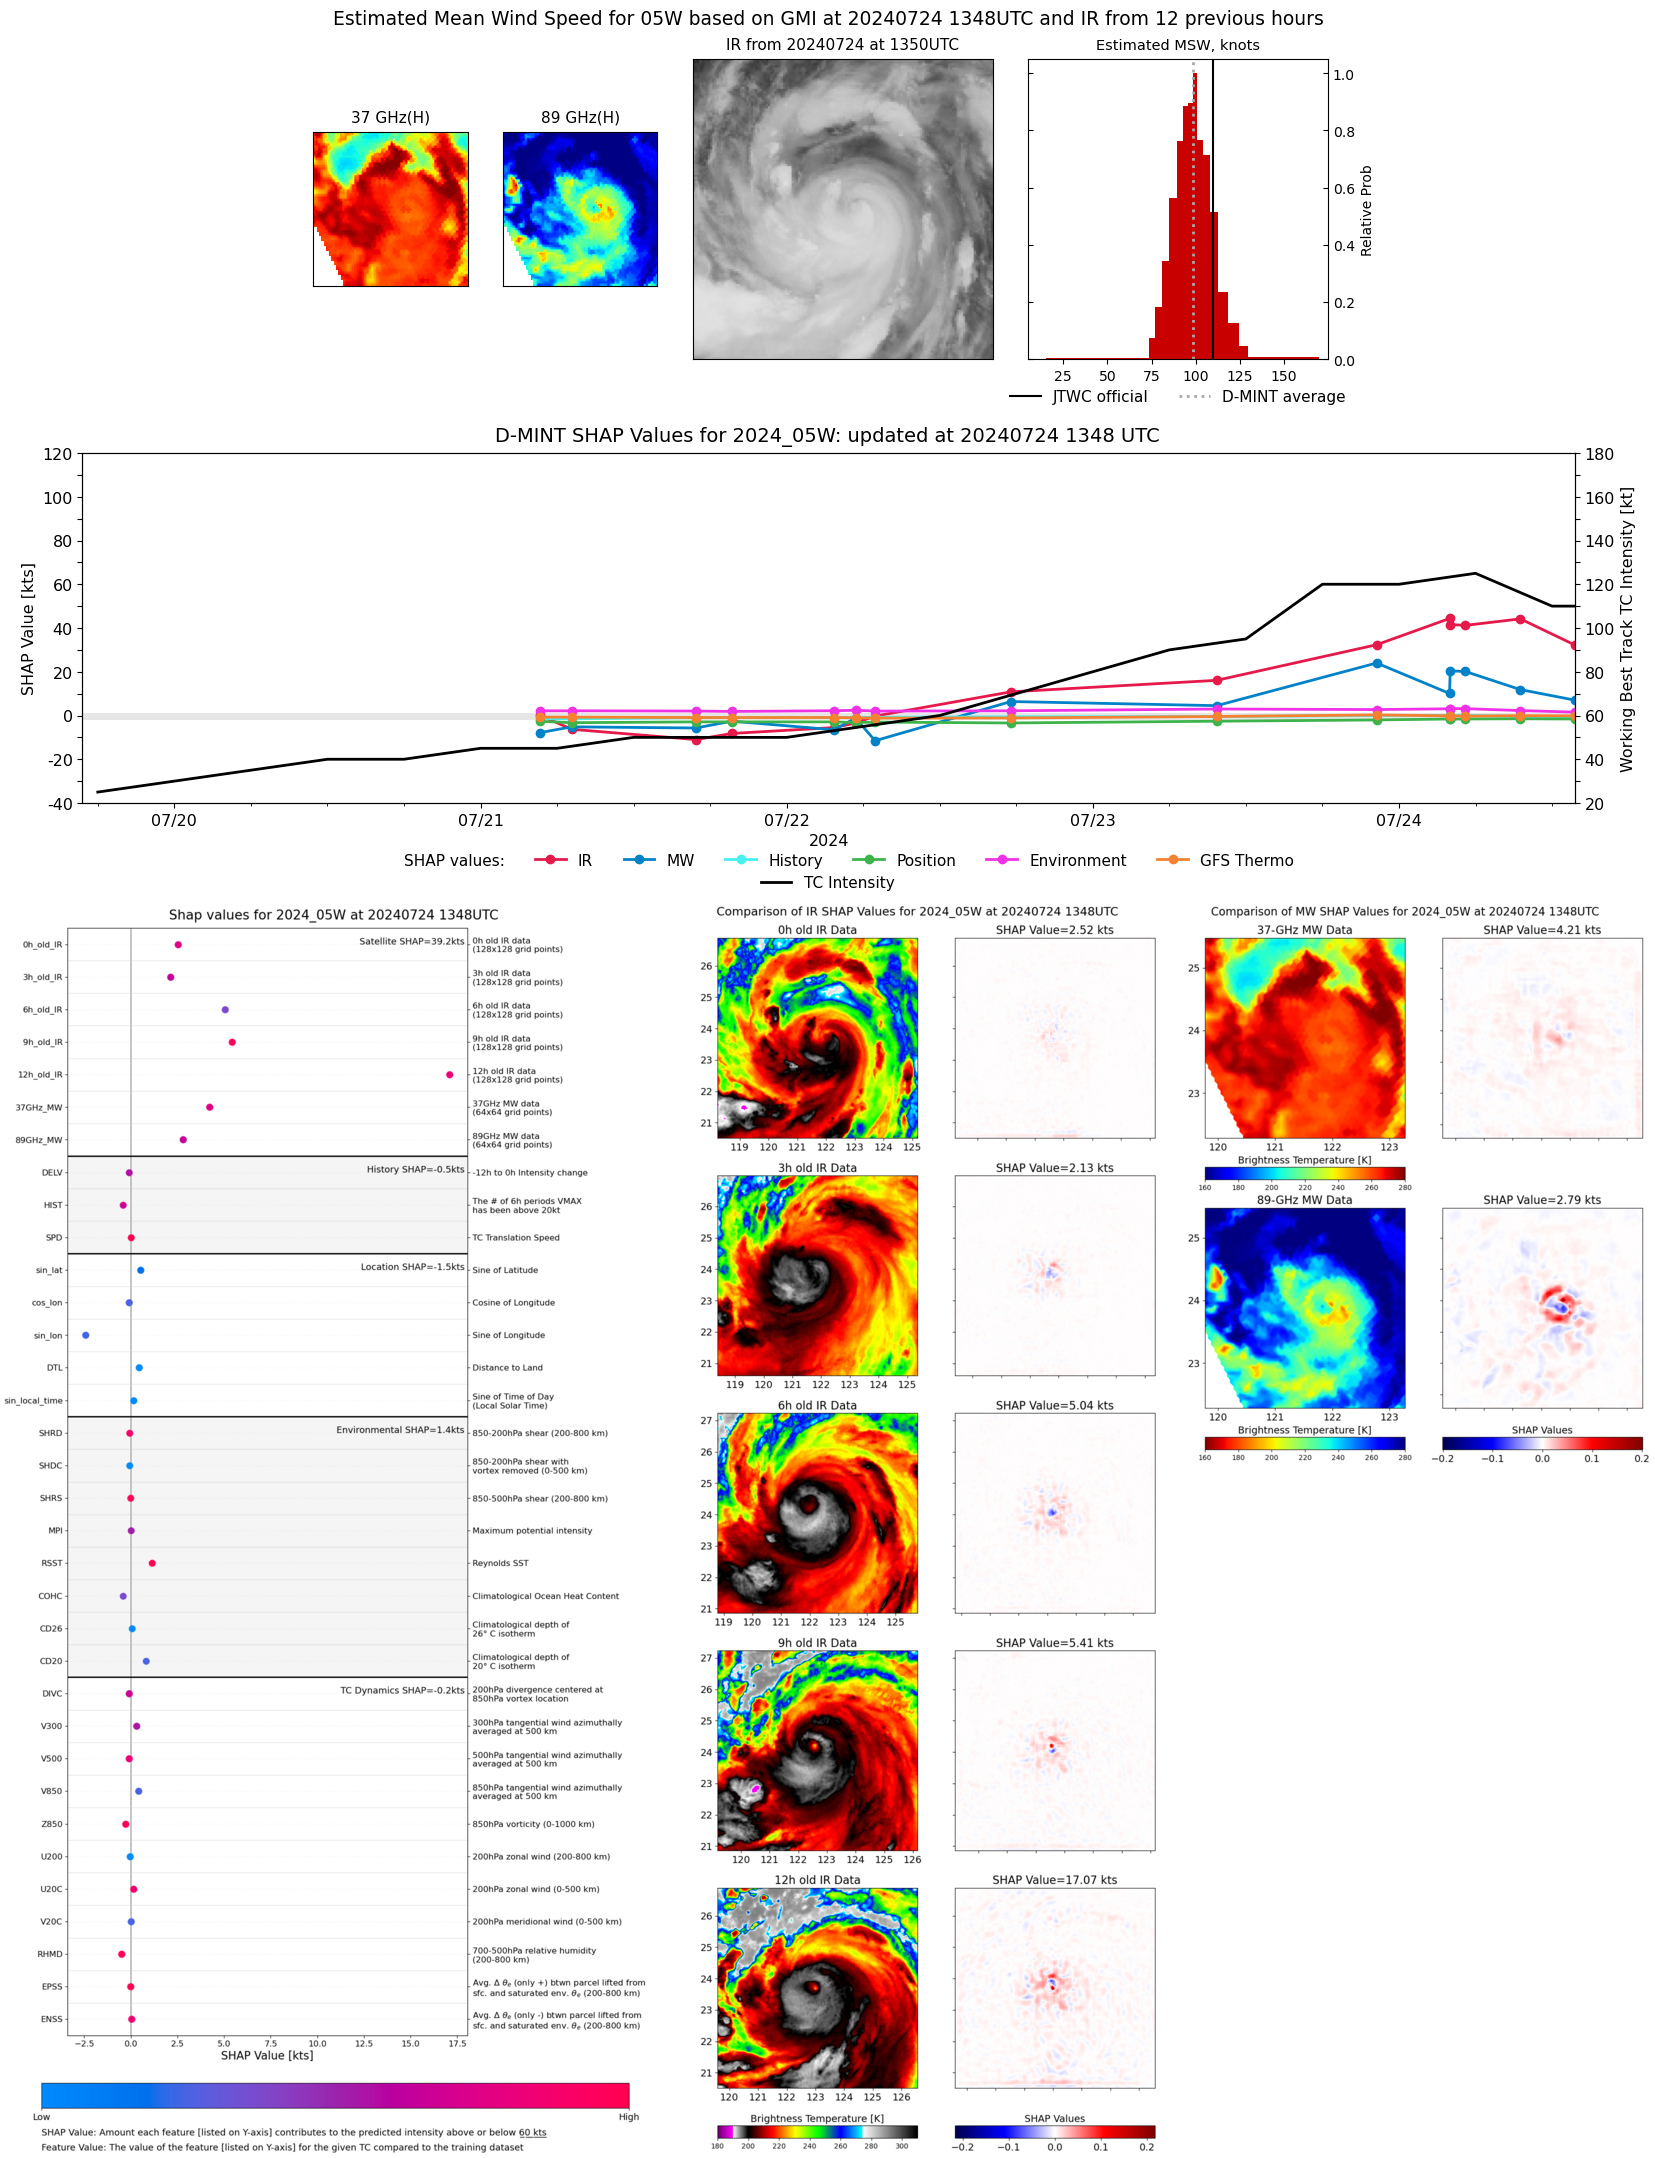 |
| 20240724 | 1155 UTC | TROPICS06 | 927 hPa | 117 kts | 110 kts | 124 kts | 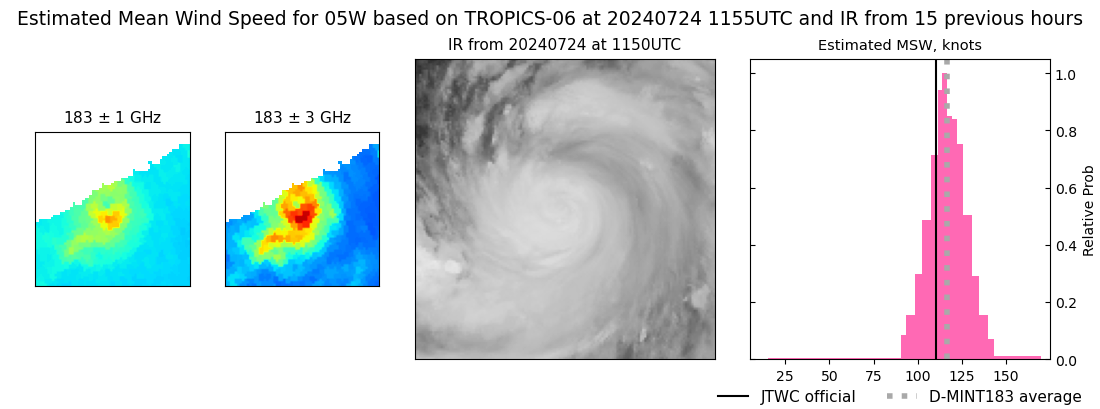 |
| 20240724 | 0931 UTC | SSMISF17 | 931 hPa | 116 kts | 108 kts | 124 kts | 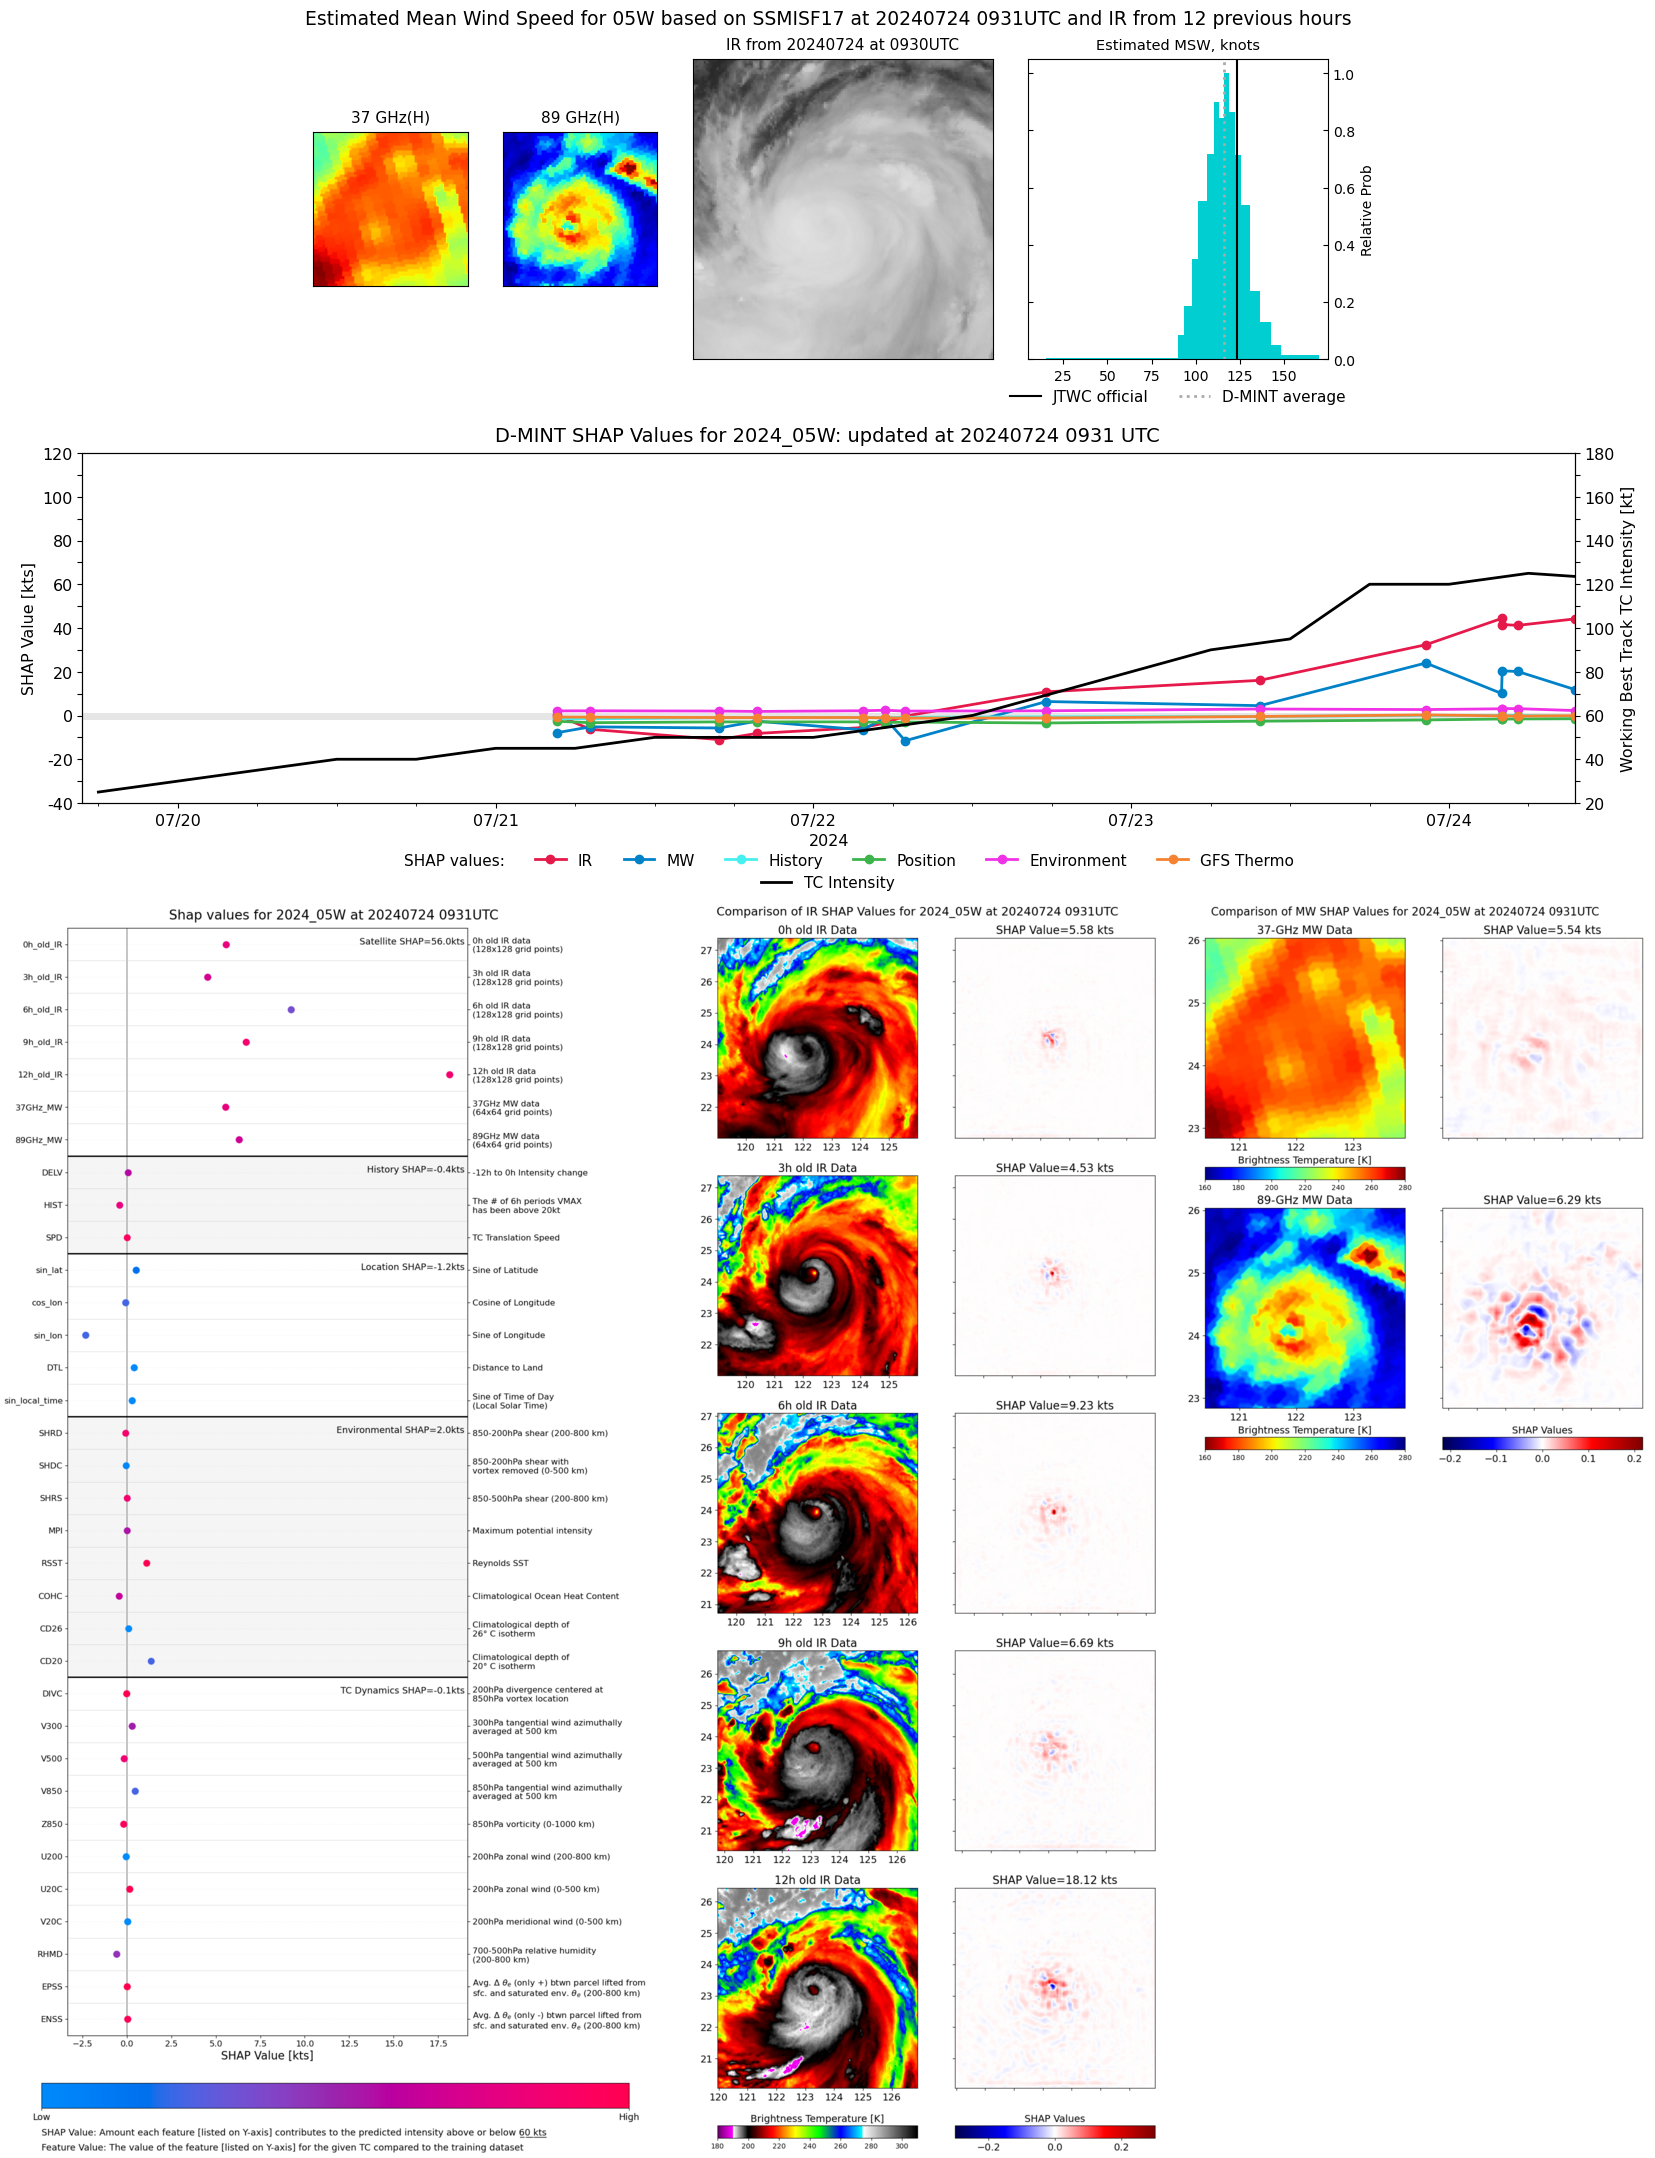 |
| 20240724 | 0512 UTC | AMSR2 | 930 hPa | 128 kts | 121 kts | 135 kts | 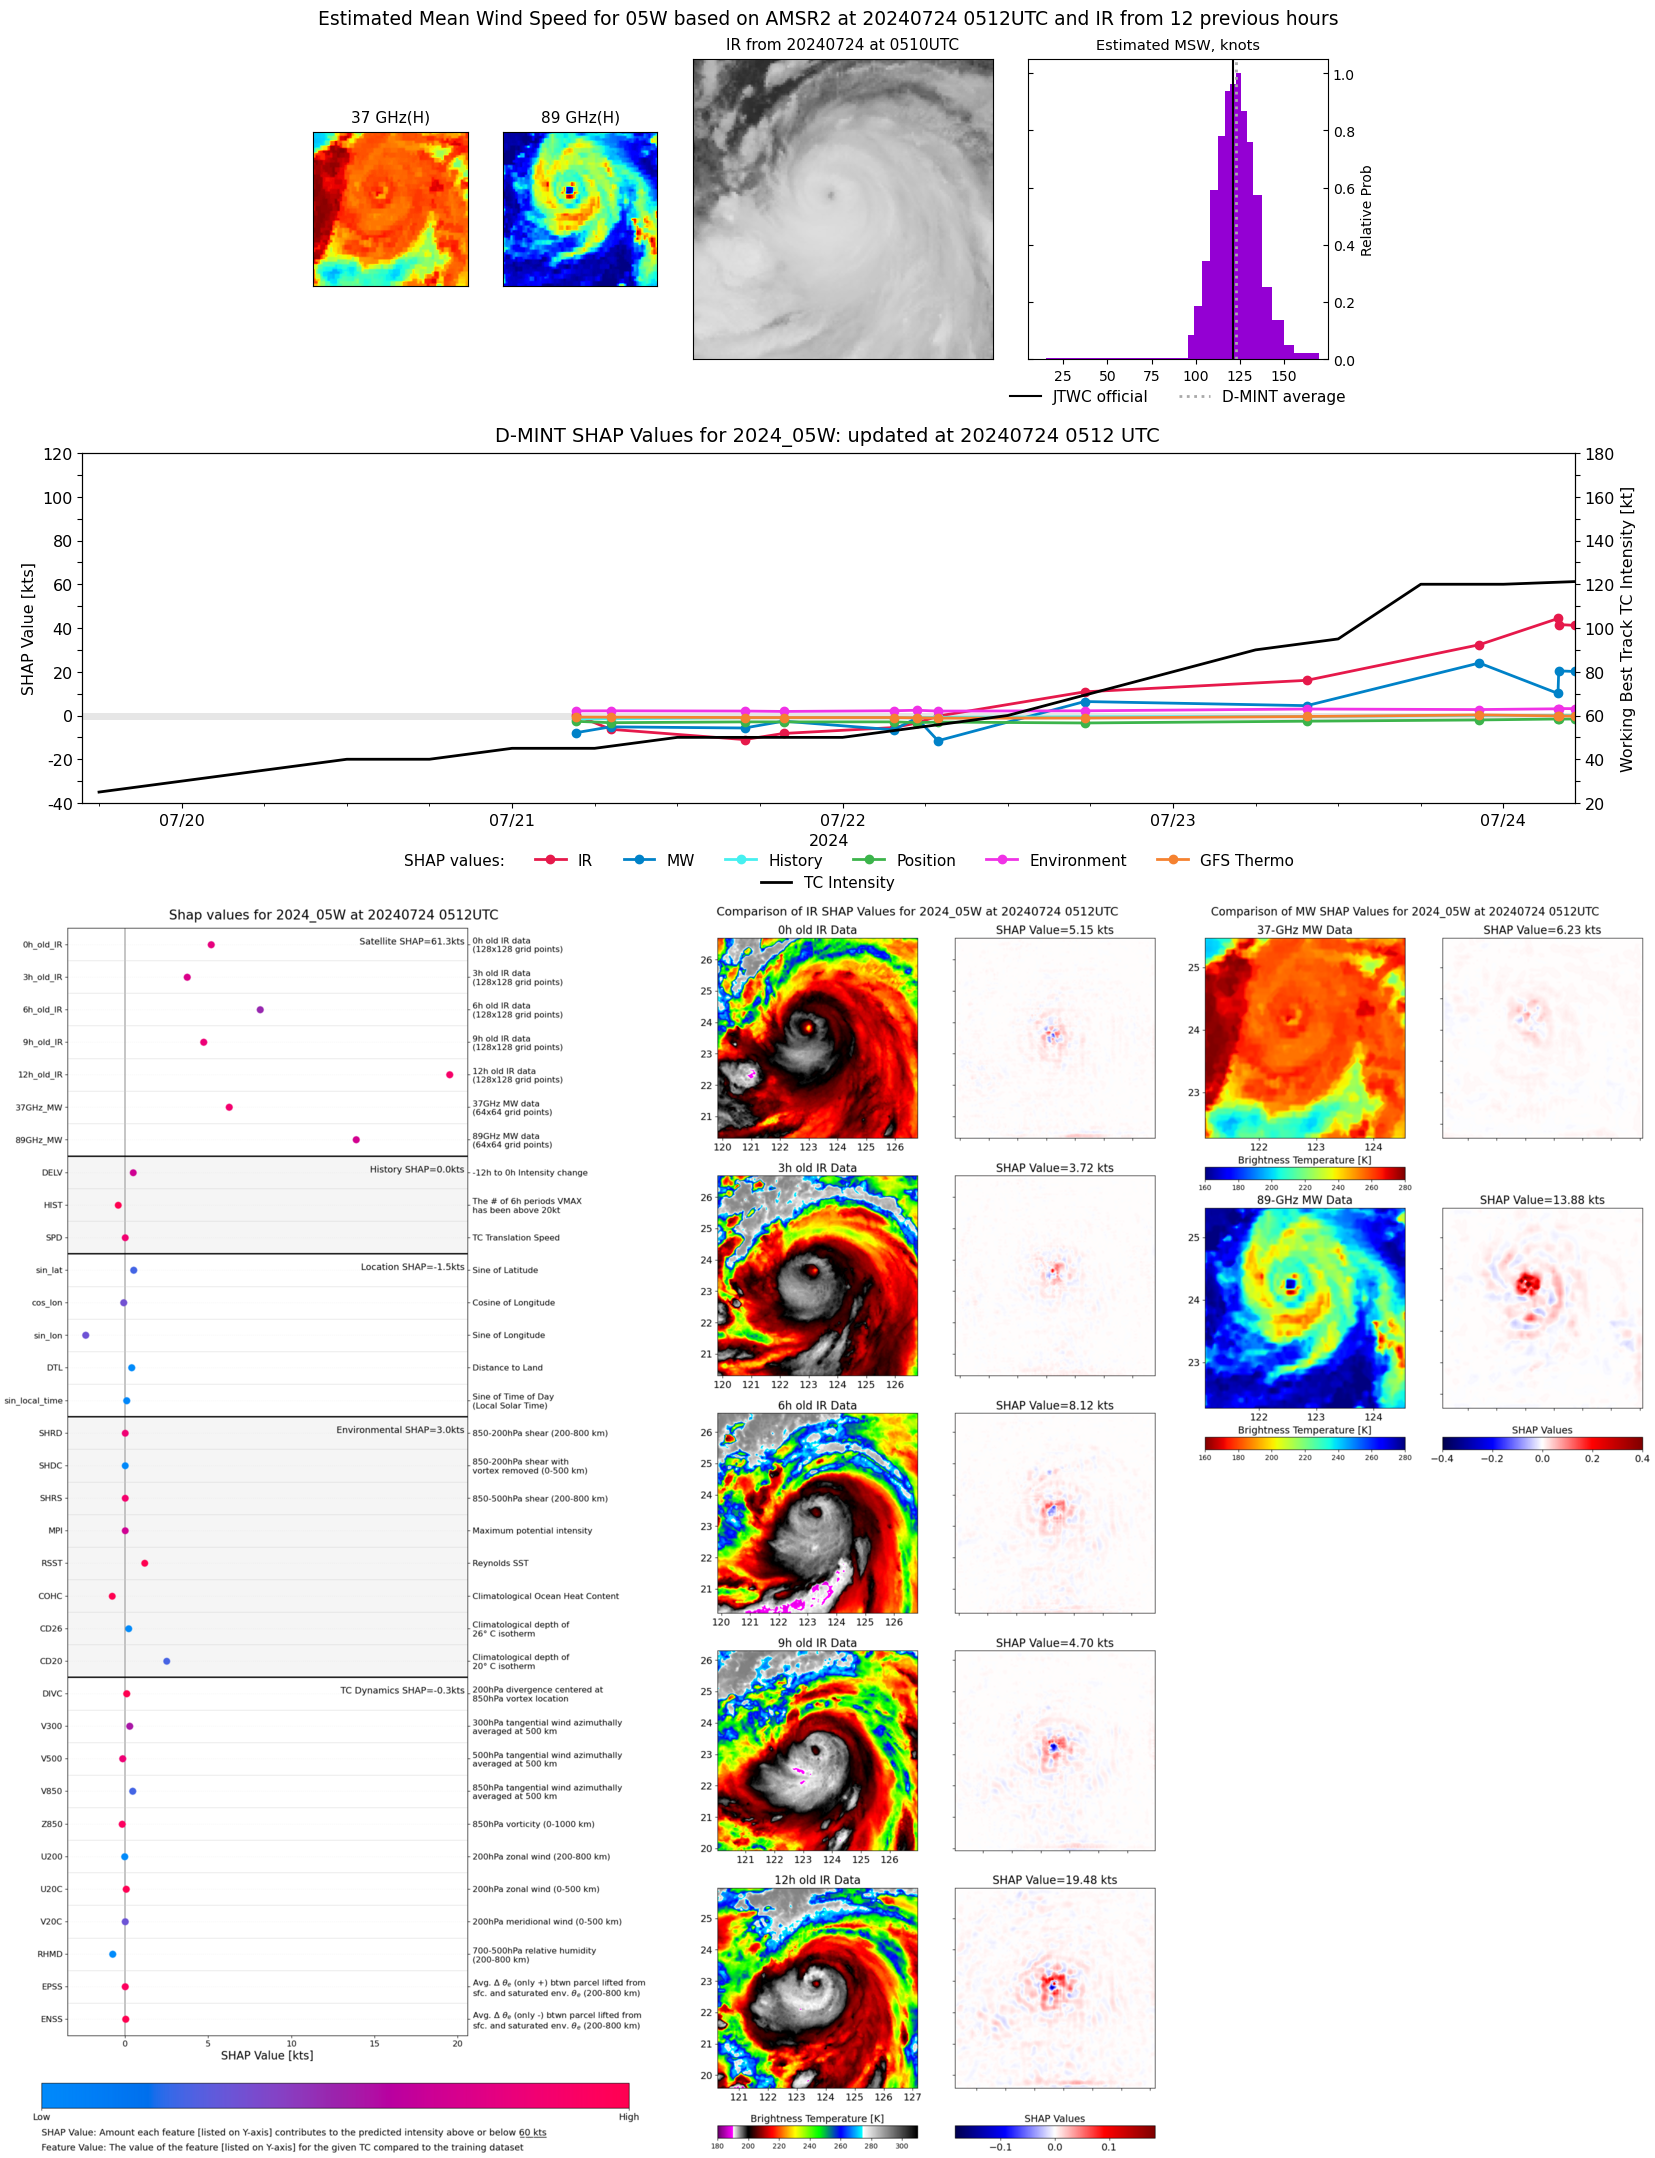 |
| 20240724 | 0501 UTC | ATMS-N20 | 923 hPa | 119 kts | 112 kts | 127 kts | 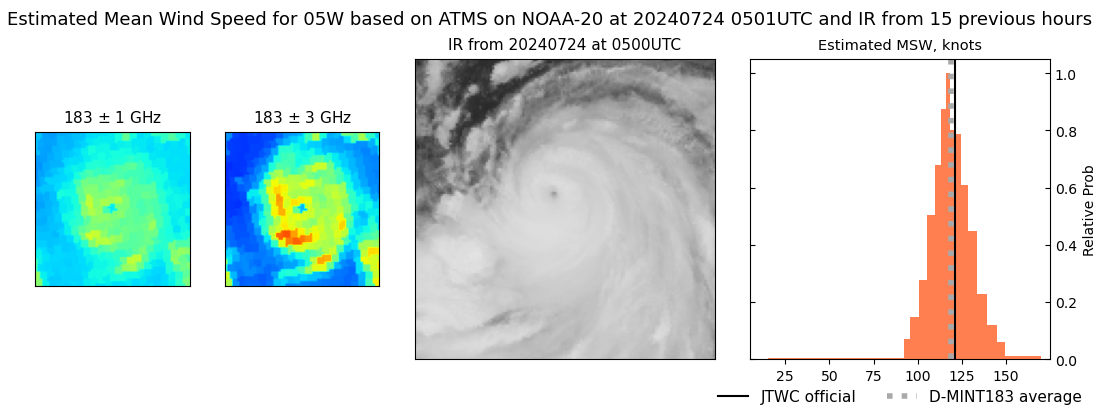 |
| 20240724 | 0437 UTC | ATMS-NPP | 928 hPa | 121 kts | 114 kts | 129 kts | 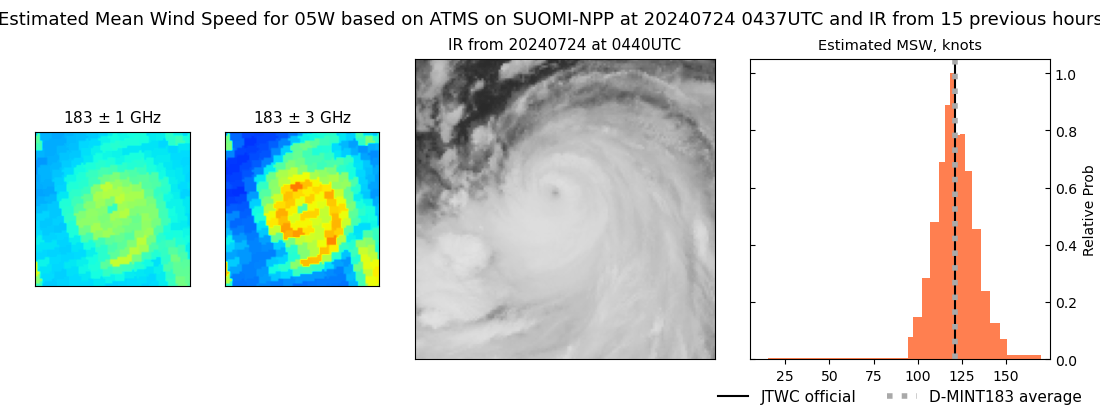 |
| 20240724 | 0401 UTC | GMI | 929 hPa | 123 kts | 115 kts | 131 kts | 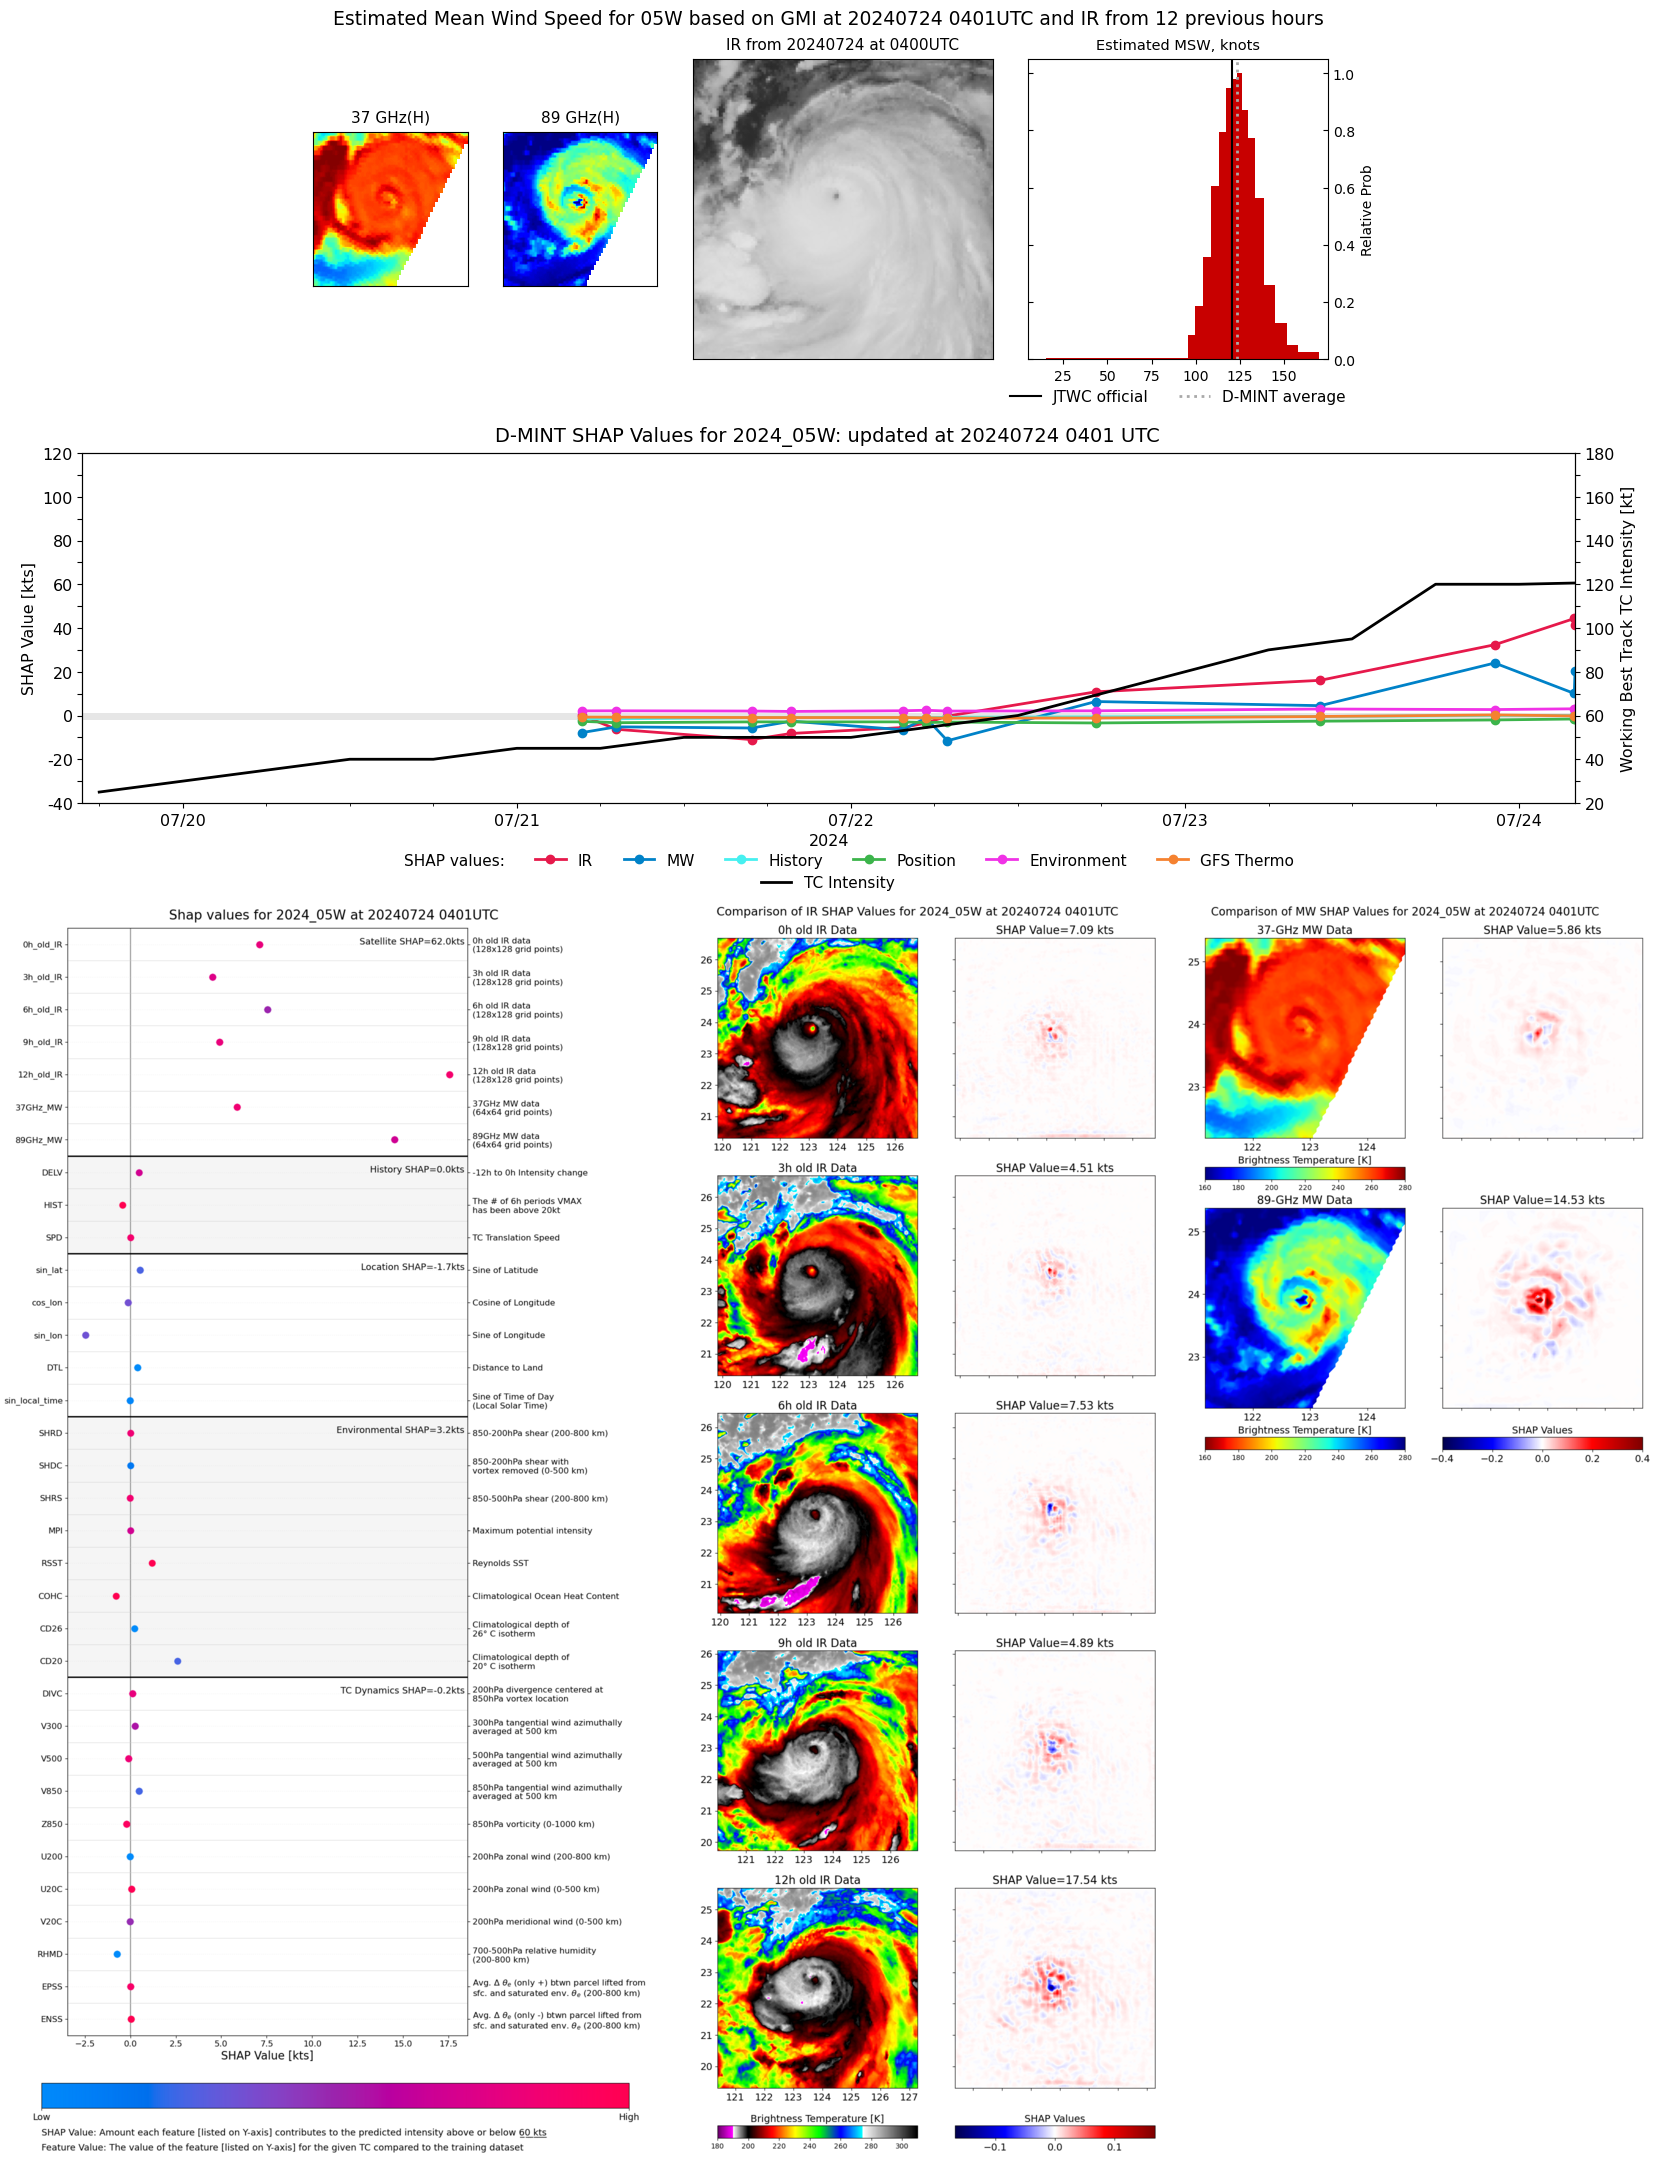 |
| 20240724 | 0358 UTC | GMI | 937 hPa | 111 kts | 102 kts | 119 kts | 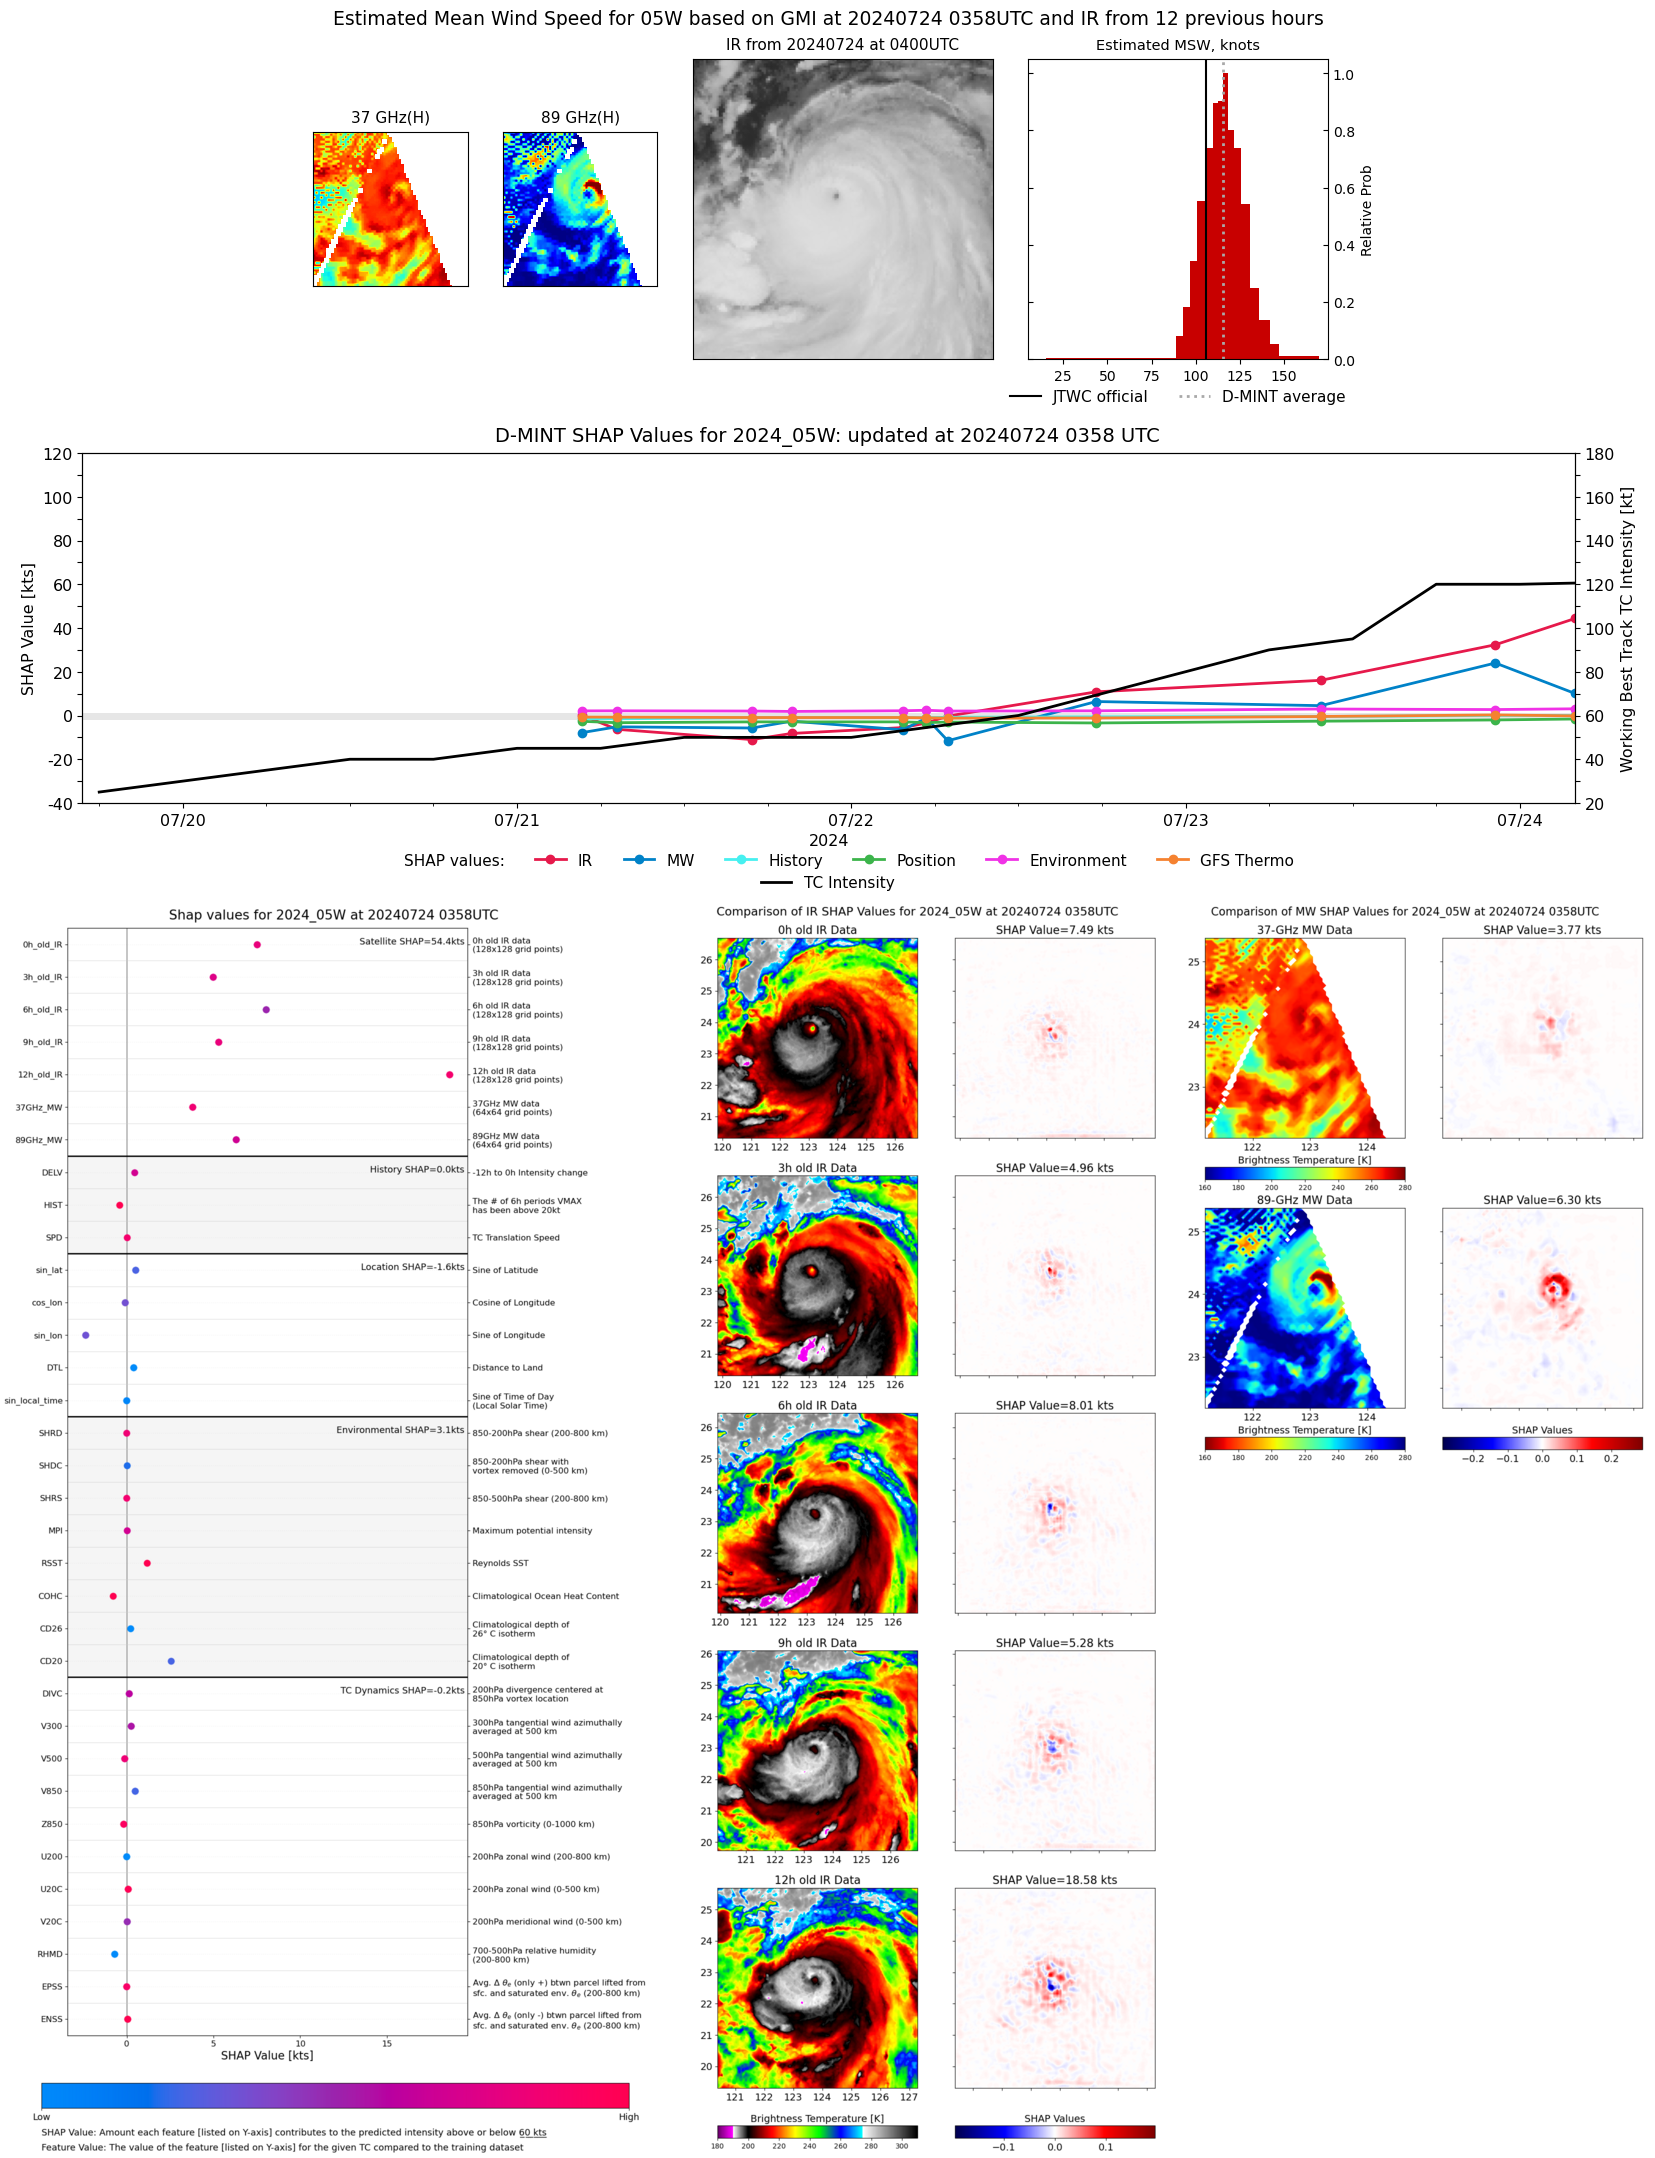 |
| 20240723 | 2215 UTC | SSMISF17 | 933 hPa | 117 kts | 109 kts | 126 kts | 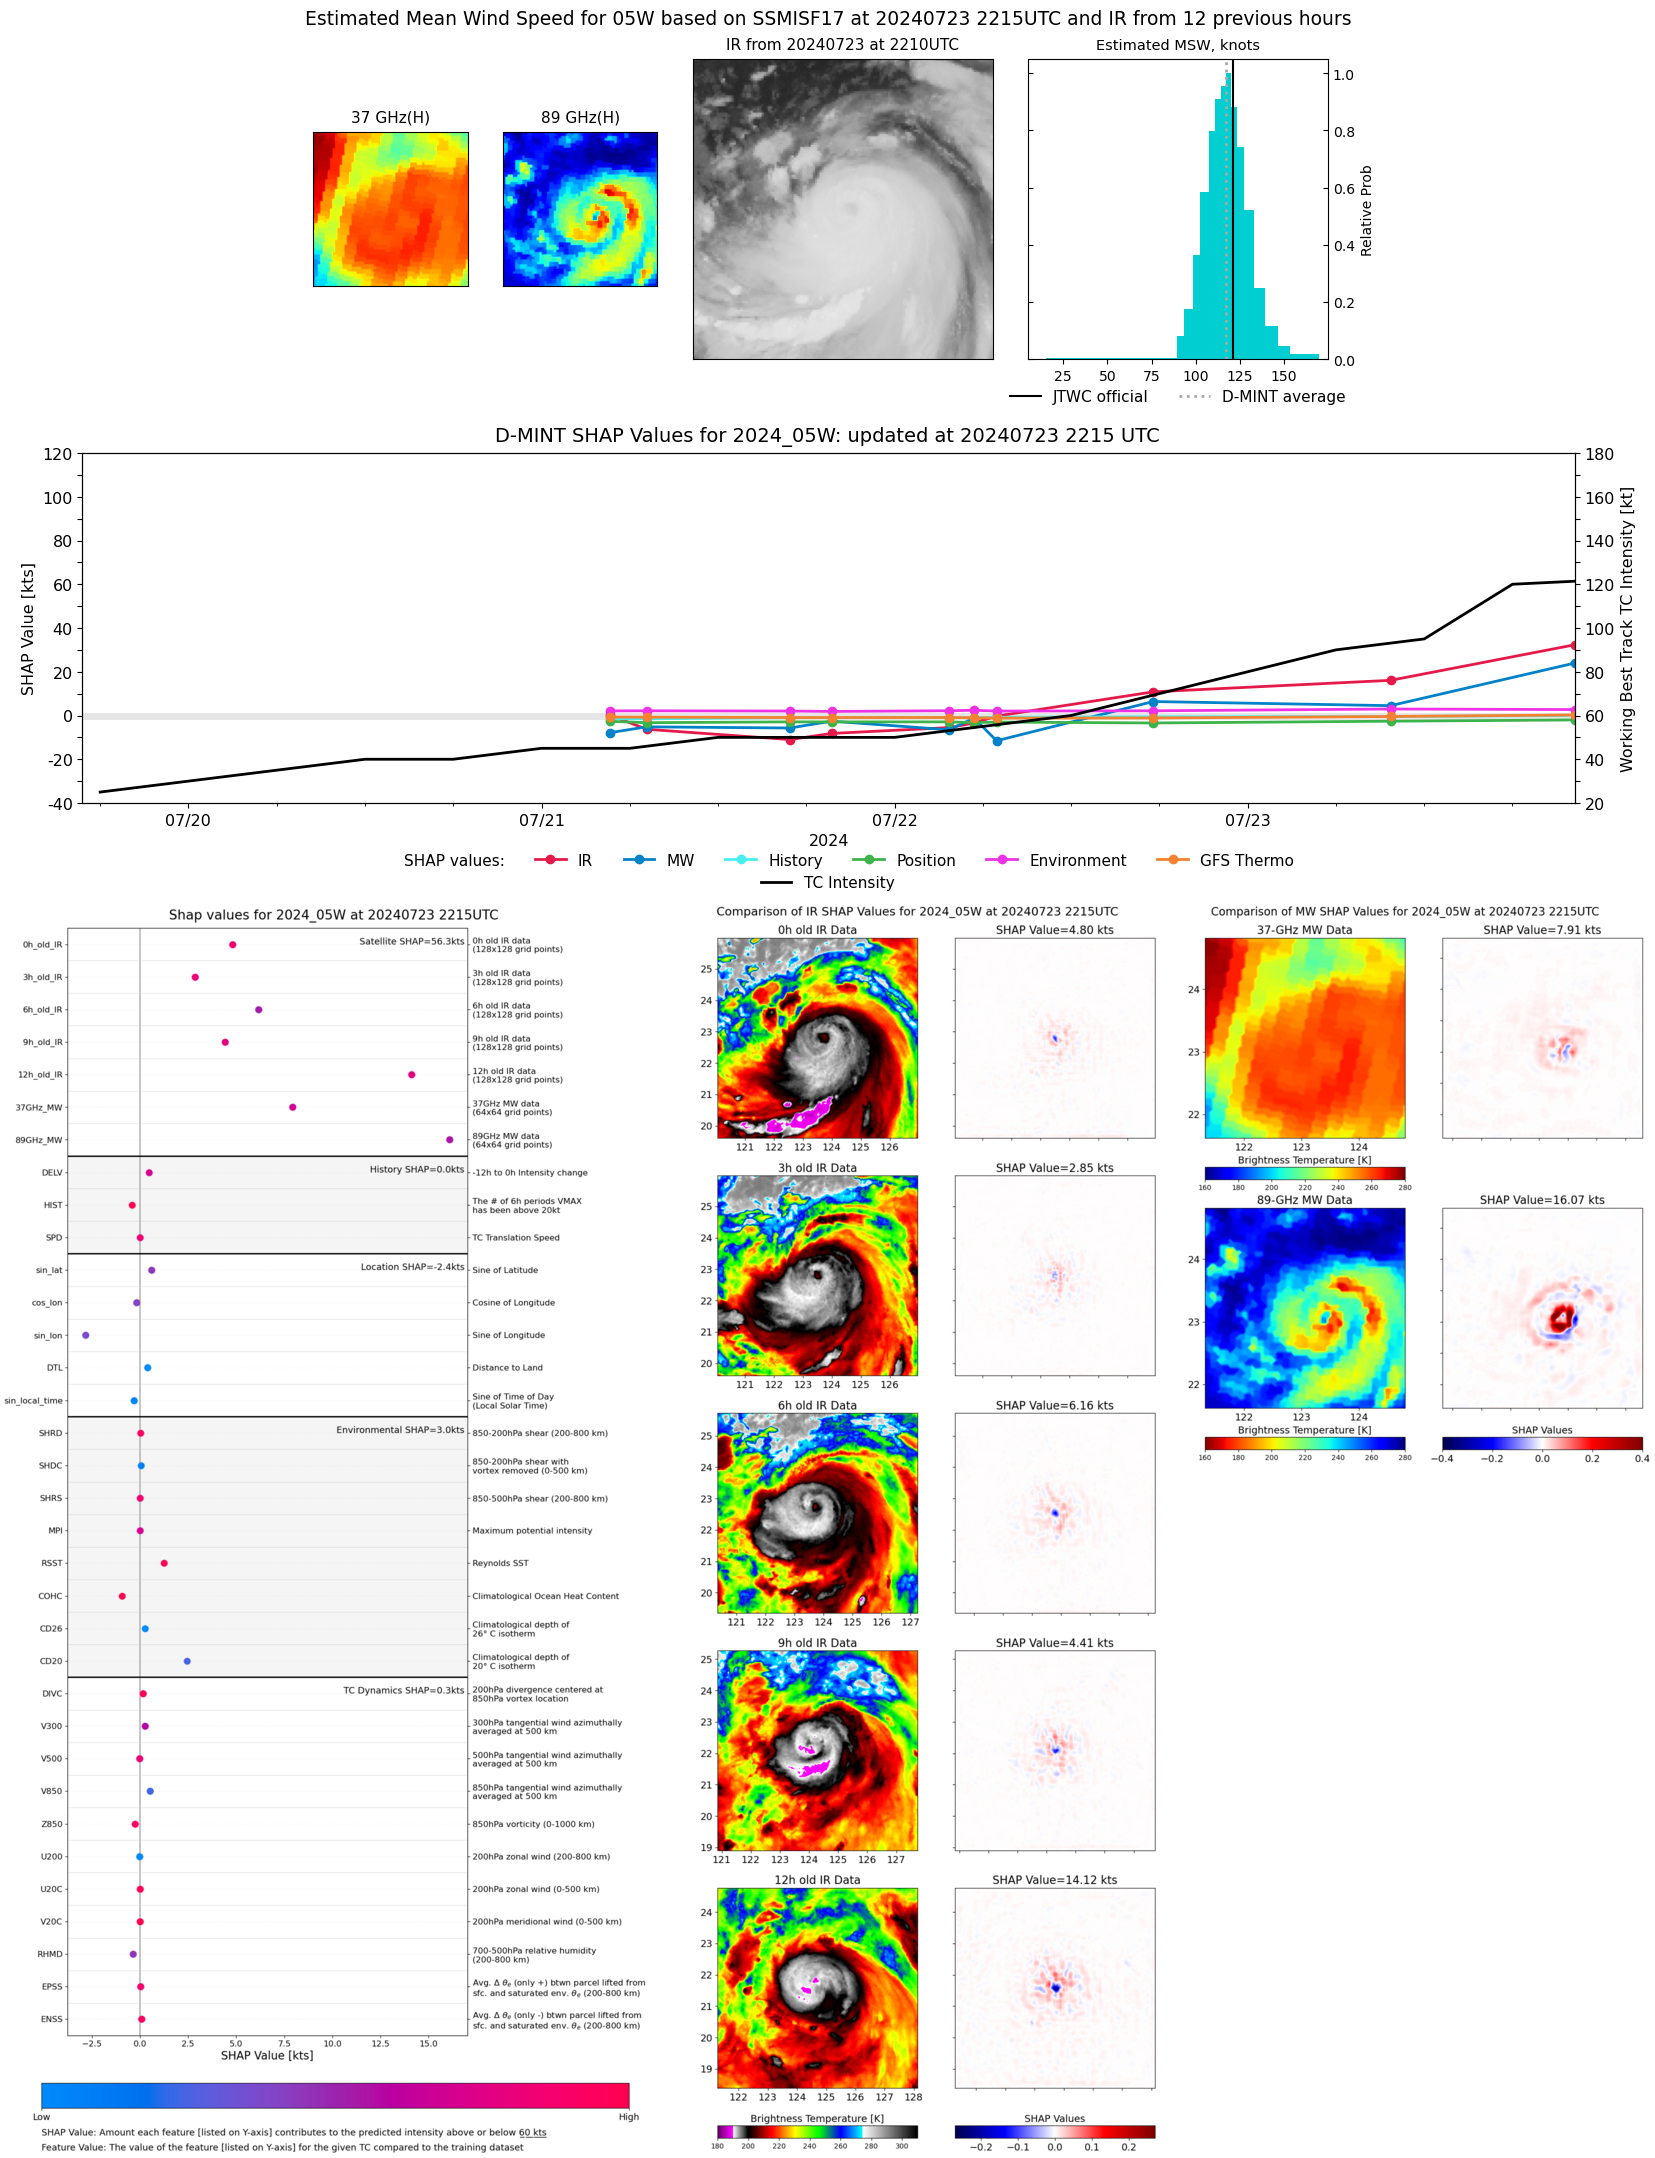 |
| 20240723 | 1900 UTC | TROPICS06 | 933 hPa | 112 kts | 104 kts | 120 kts | 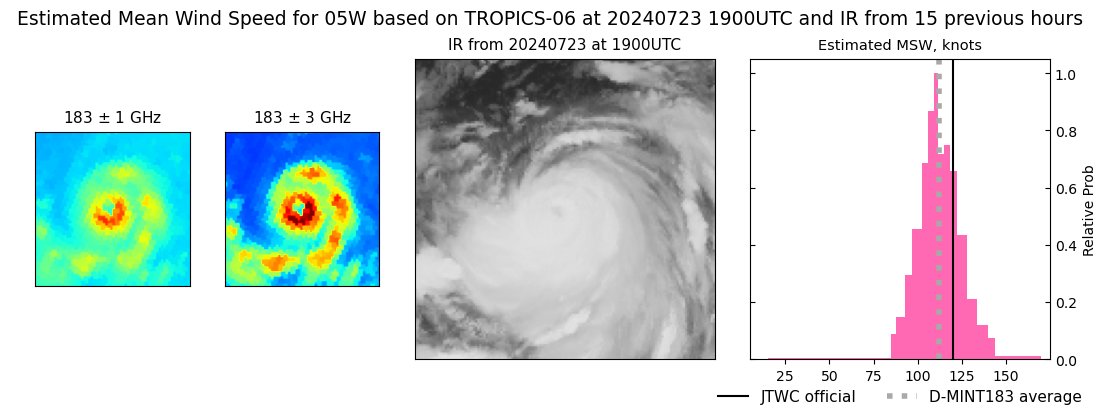 |
| 20240723 | 1748 UTC | ATMS-N20 | 941 hPa | 102 kts | 94 kts | 111 kts | 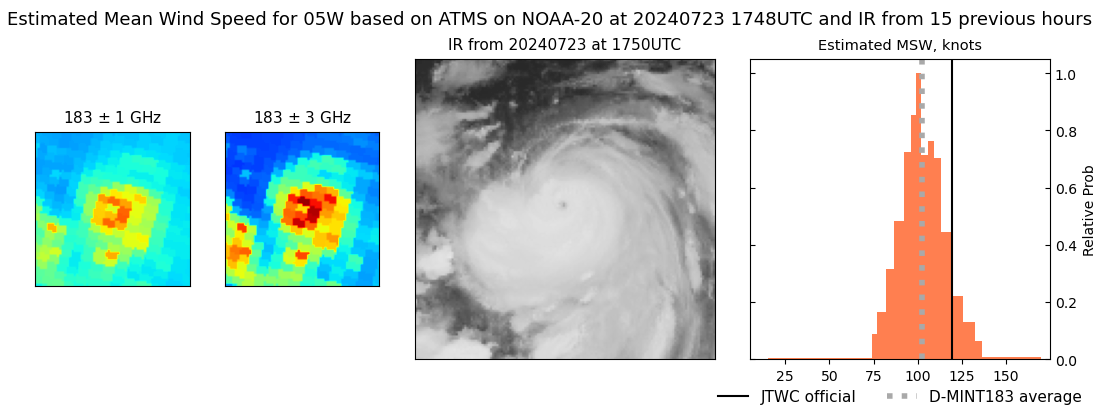 |
| 20240723 | 1724 UTC | ATMS-NPP | 943 hPa | 102 kts | 94 kts | 110 kts | 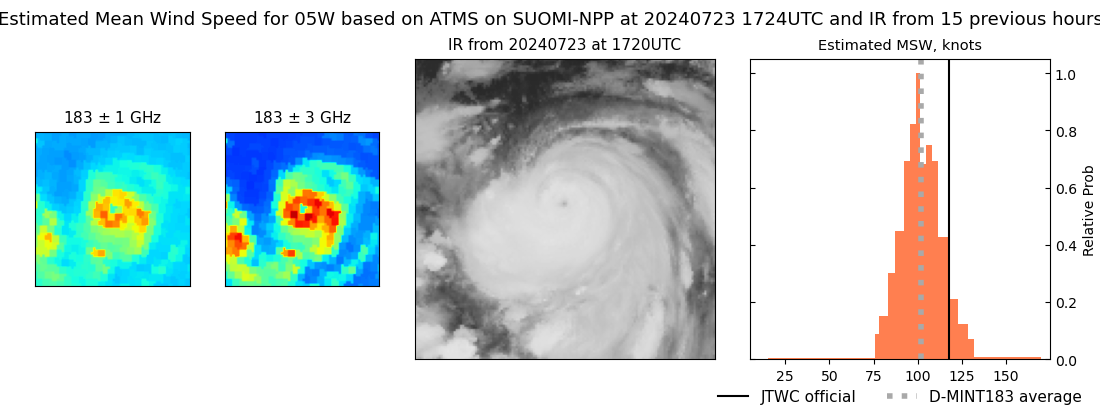 |
| 20240723 | 1659 UTC | ATMS-N21 | 945 hPa | 97 kts | 89 kts | 106 kts | 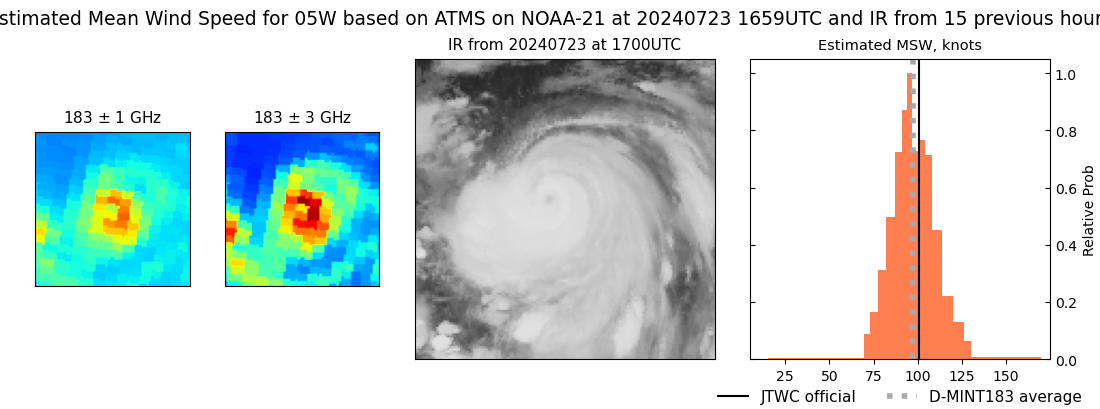 |
| 20240723 | 1218 UTC | TROPICS06 | 953 hPa | 90 kts | 83 kts | 98 kts | 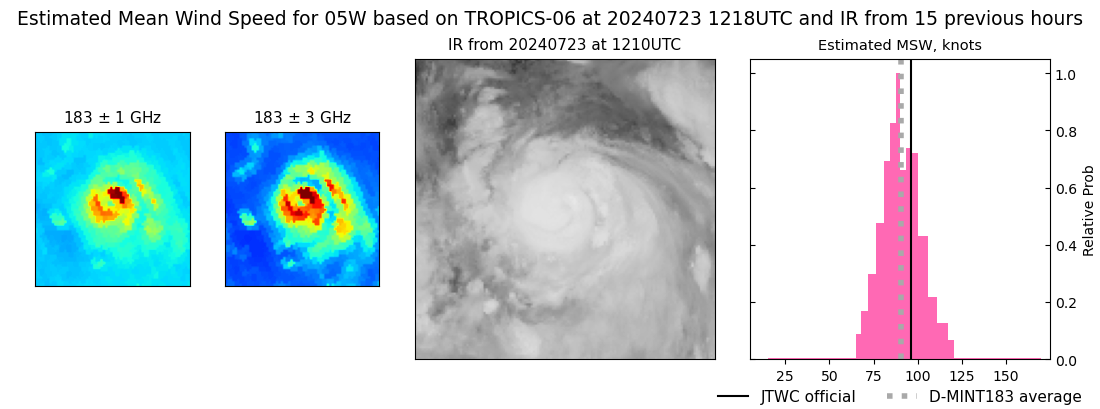 |
| 20240723 | 0943 UTC | SSMISF17 | 963 hPa | 80 kts | 73 kts | 87 kts | 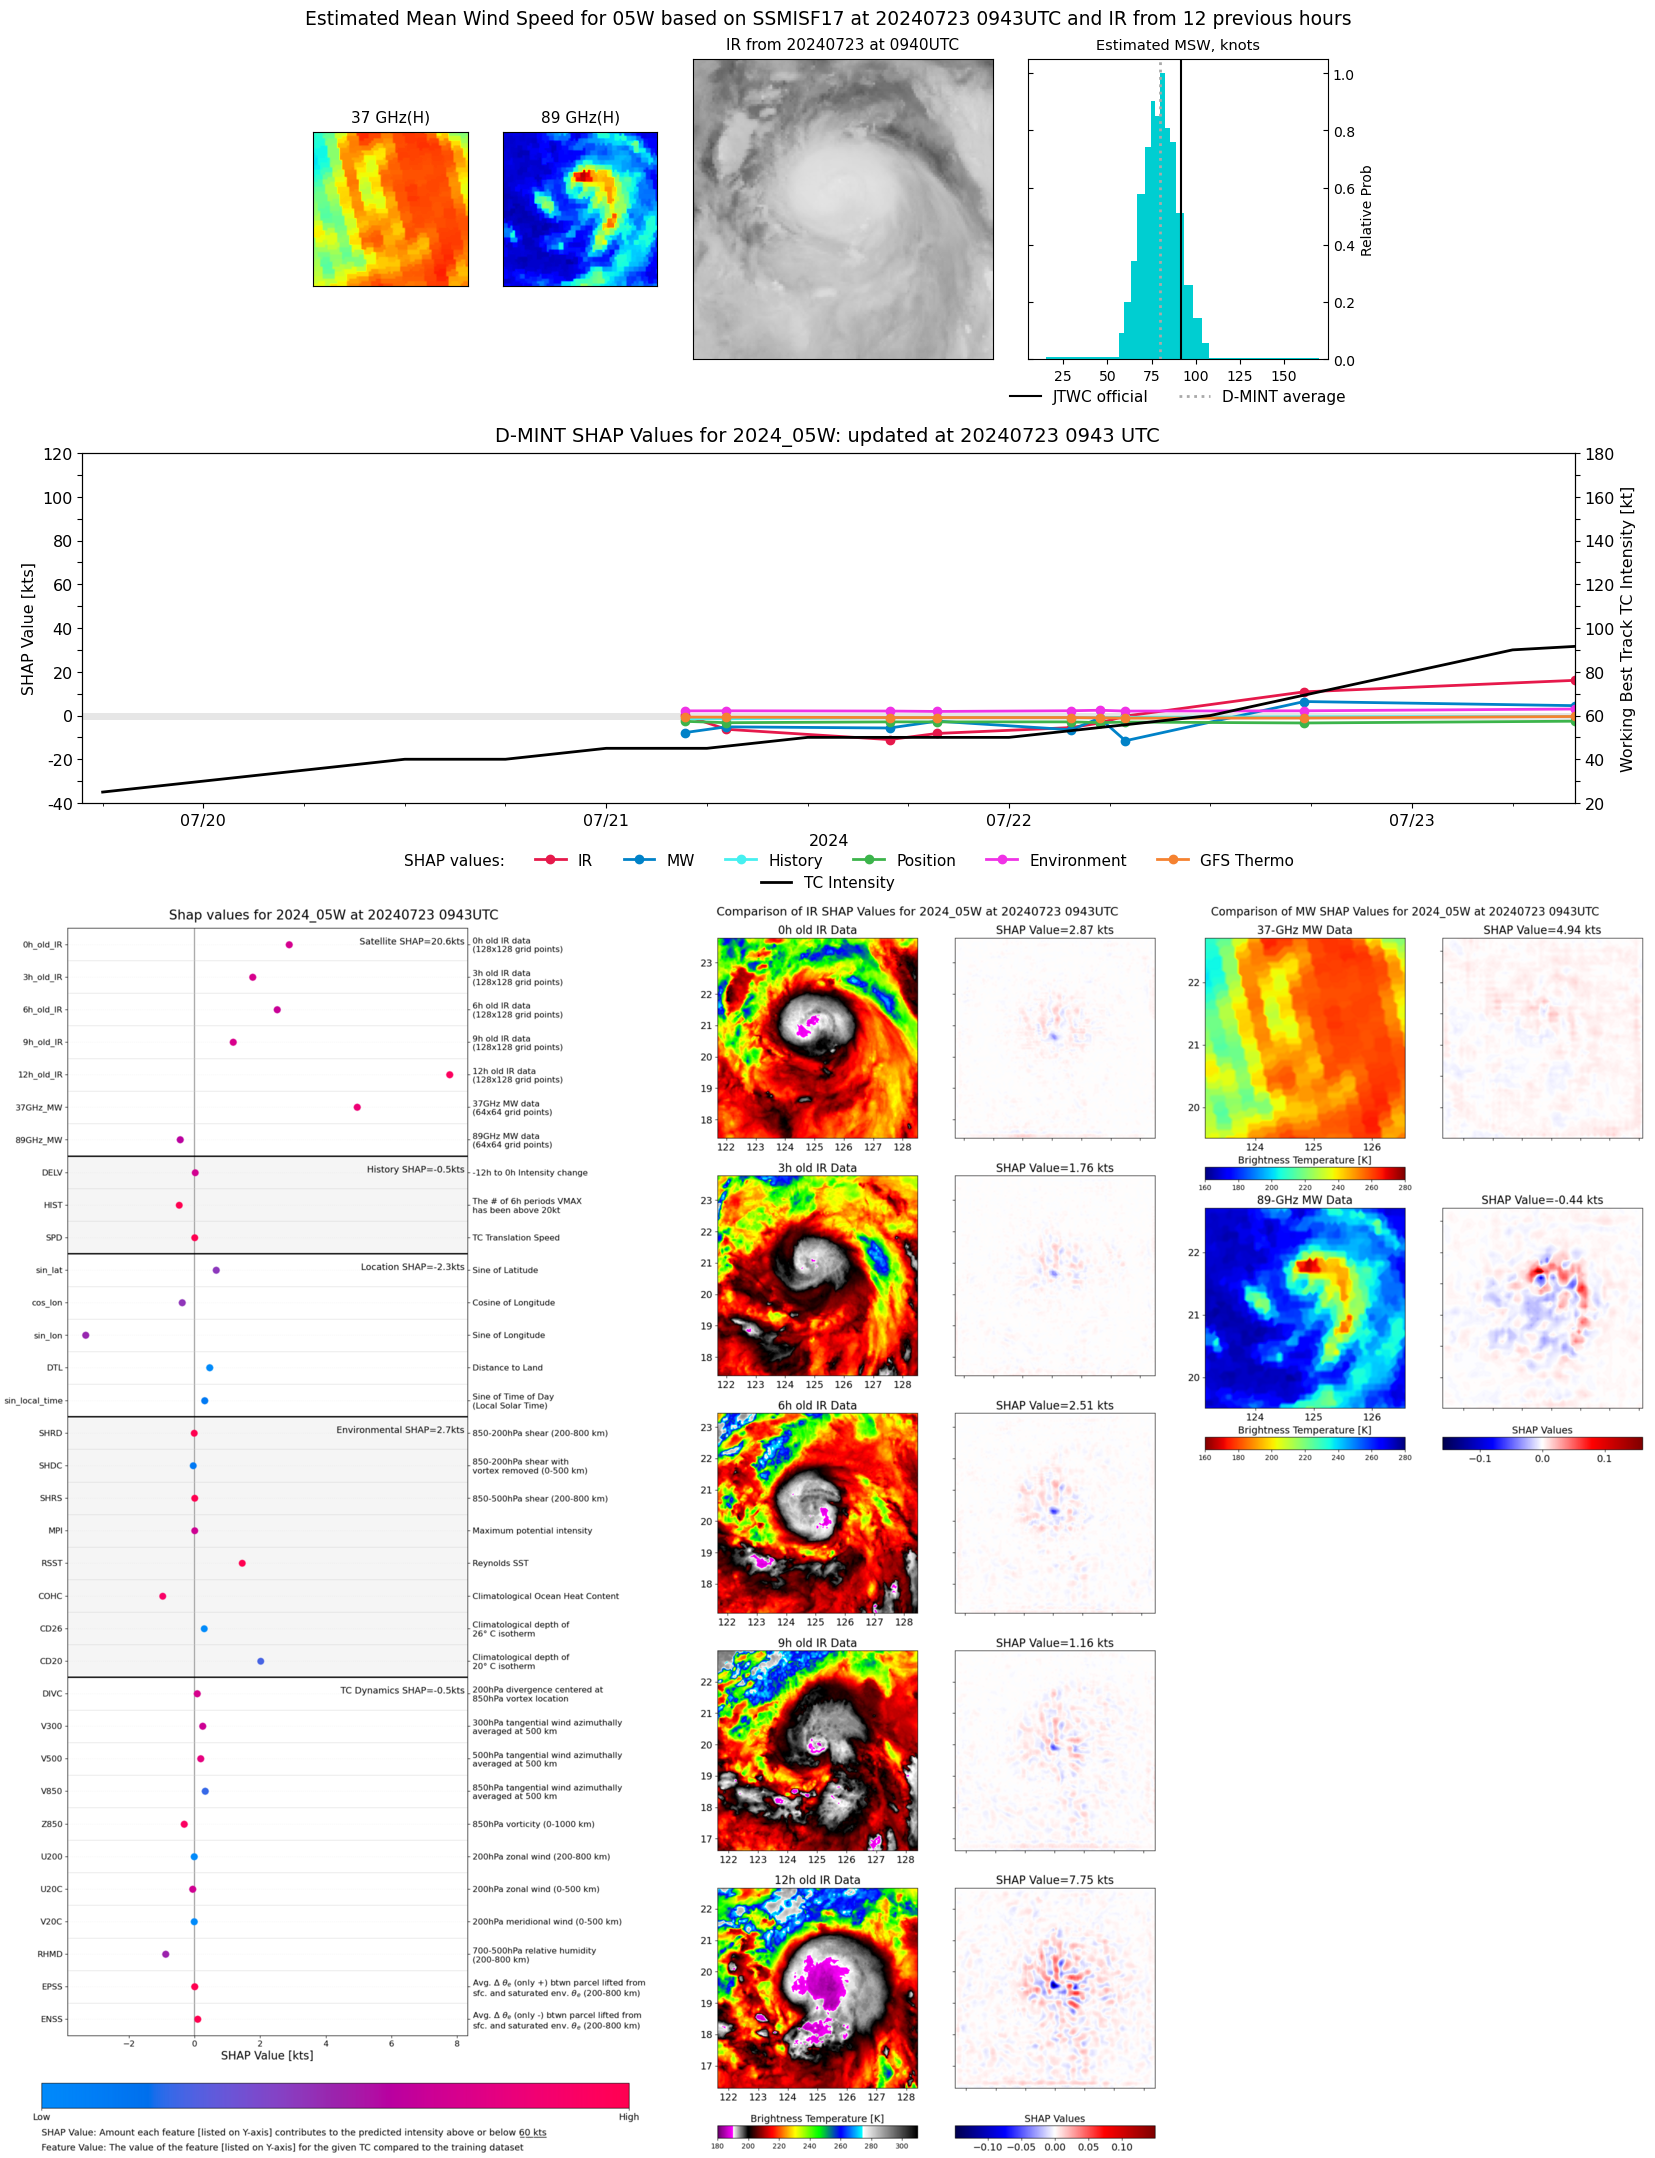 |
| 20240723 | 0736 UTC | TROPICS03 | 958 hPa | 83 kts | 76 kts | 91 kts |  |
| 20240723 | 0519 UTC | ATMS | 958 hPa | 85 kts | 78 kts | 93 kts | 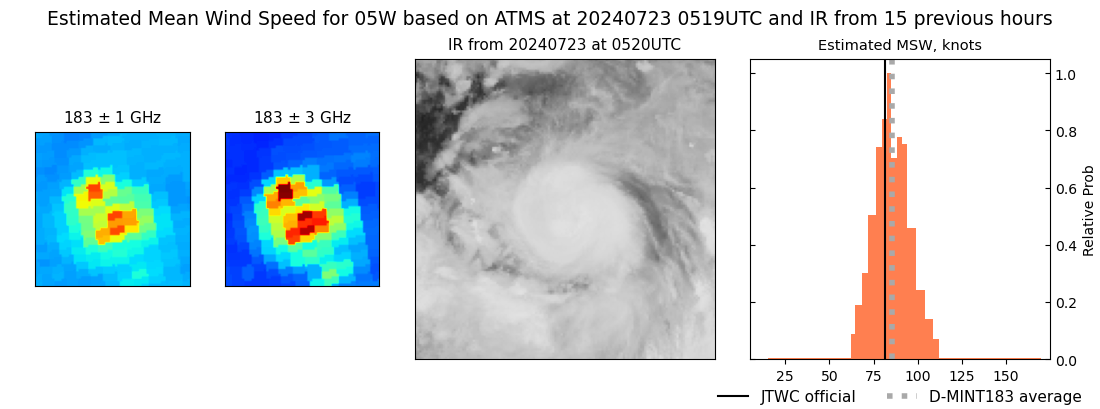 |
| 20240723 | 0455 UTC | ATMS | 965 hPa | 83 kts | 76 kts | 90 kts |  |
| 20240723 | 0430 UTC | ATMS | 966 hPa | 78 kts | 71 kts | 85 kts |  |
| 20240722 | 2230 UTC | SSMISF17 | 969 hPa | 80 kts | 72 kts | 87 kts | 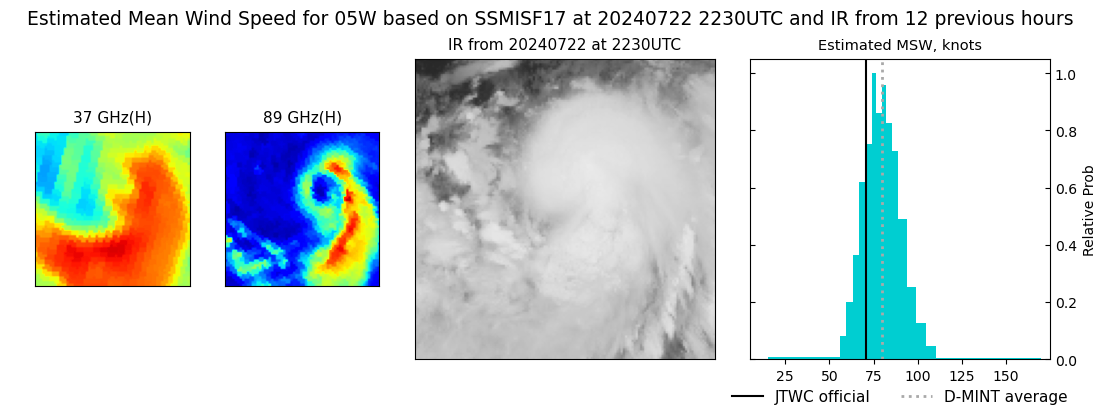 |
| 20240722 | 2136 UTC | SSMISF16 | 970 hPa | 65 kts | 58 kts | 73 kts | 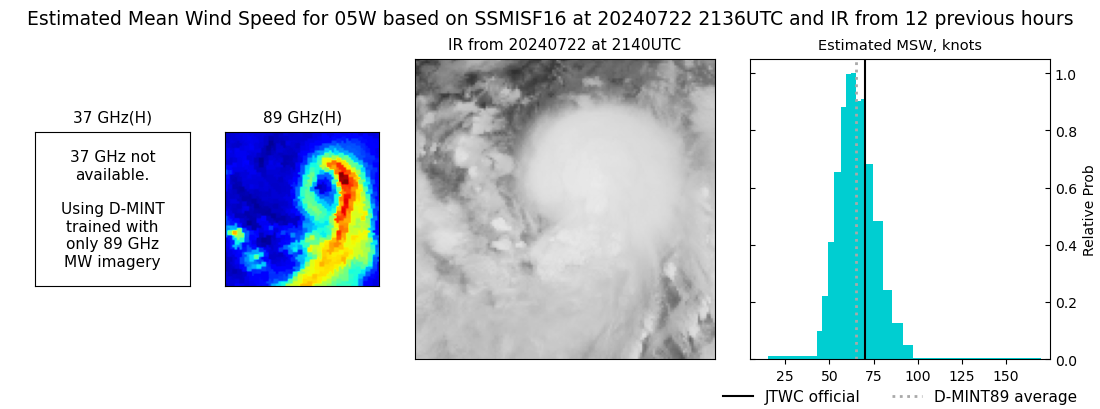 |
| 20240722 | 1744 UTC | ATMS | 971 hPa | 60 kts | 52 kts | 68 kts | 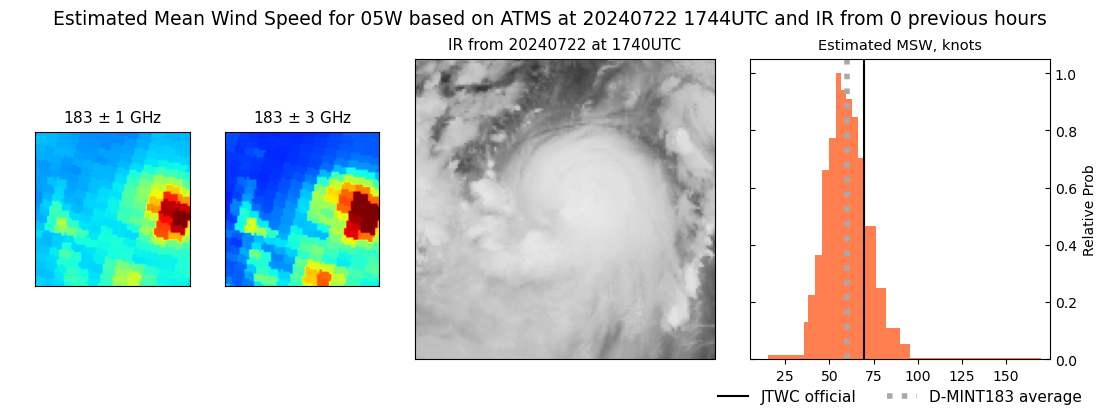 |
| 20240722 | 1735 UTC | AMSR2 | 968 hPa | 74 kts | 67 kts | 82 kts |  |
| 20240722 | 1719 UTC | ATMS | 974 hPa | 64 kts | 57 kts | 70 kts | 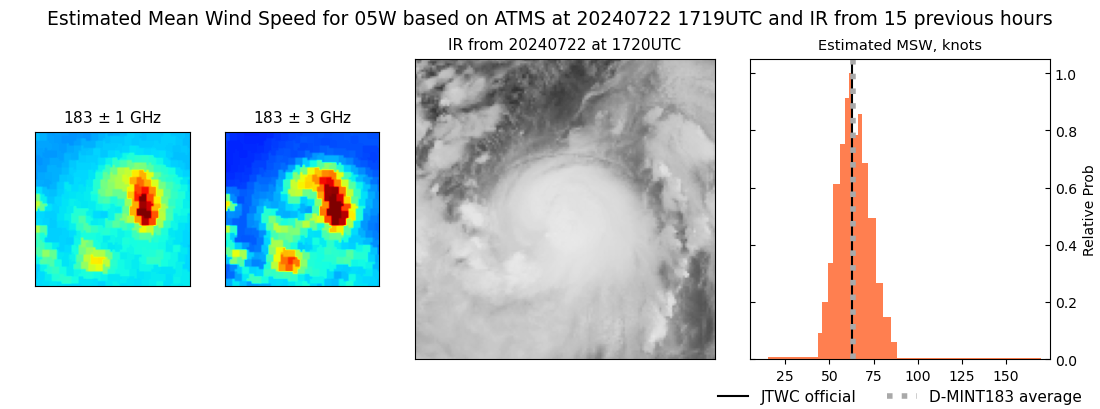 |
| 20240722 | 0903 UTC | SSMISF16 | 984 hPa | 50 kts | 43 kts | 57 kts |  |
| 20240722 | 0757 UTC | TROPICS03 | 986 hPa | 50 kts | 45 kts | 56 kts |  |
| 20240722 | 0656 UTC | SSMISF18 | 985 hPa | 54 kts | 47 kts | 62 kts | 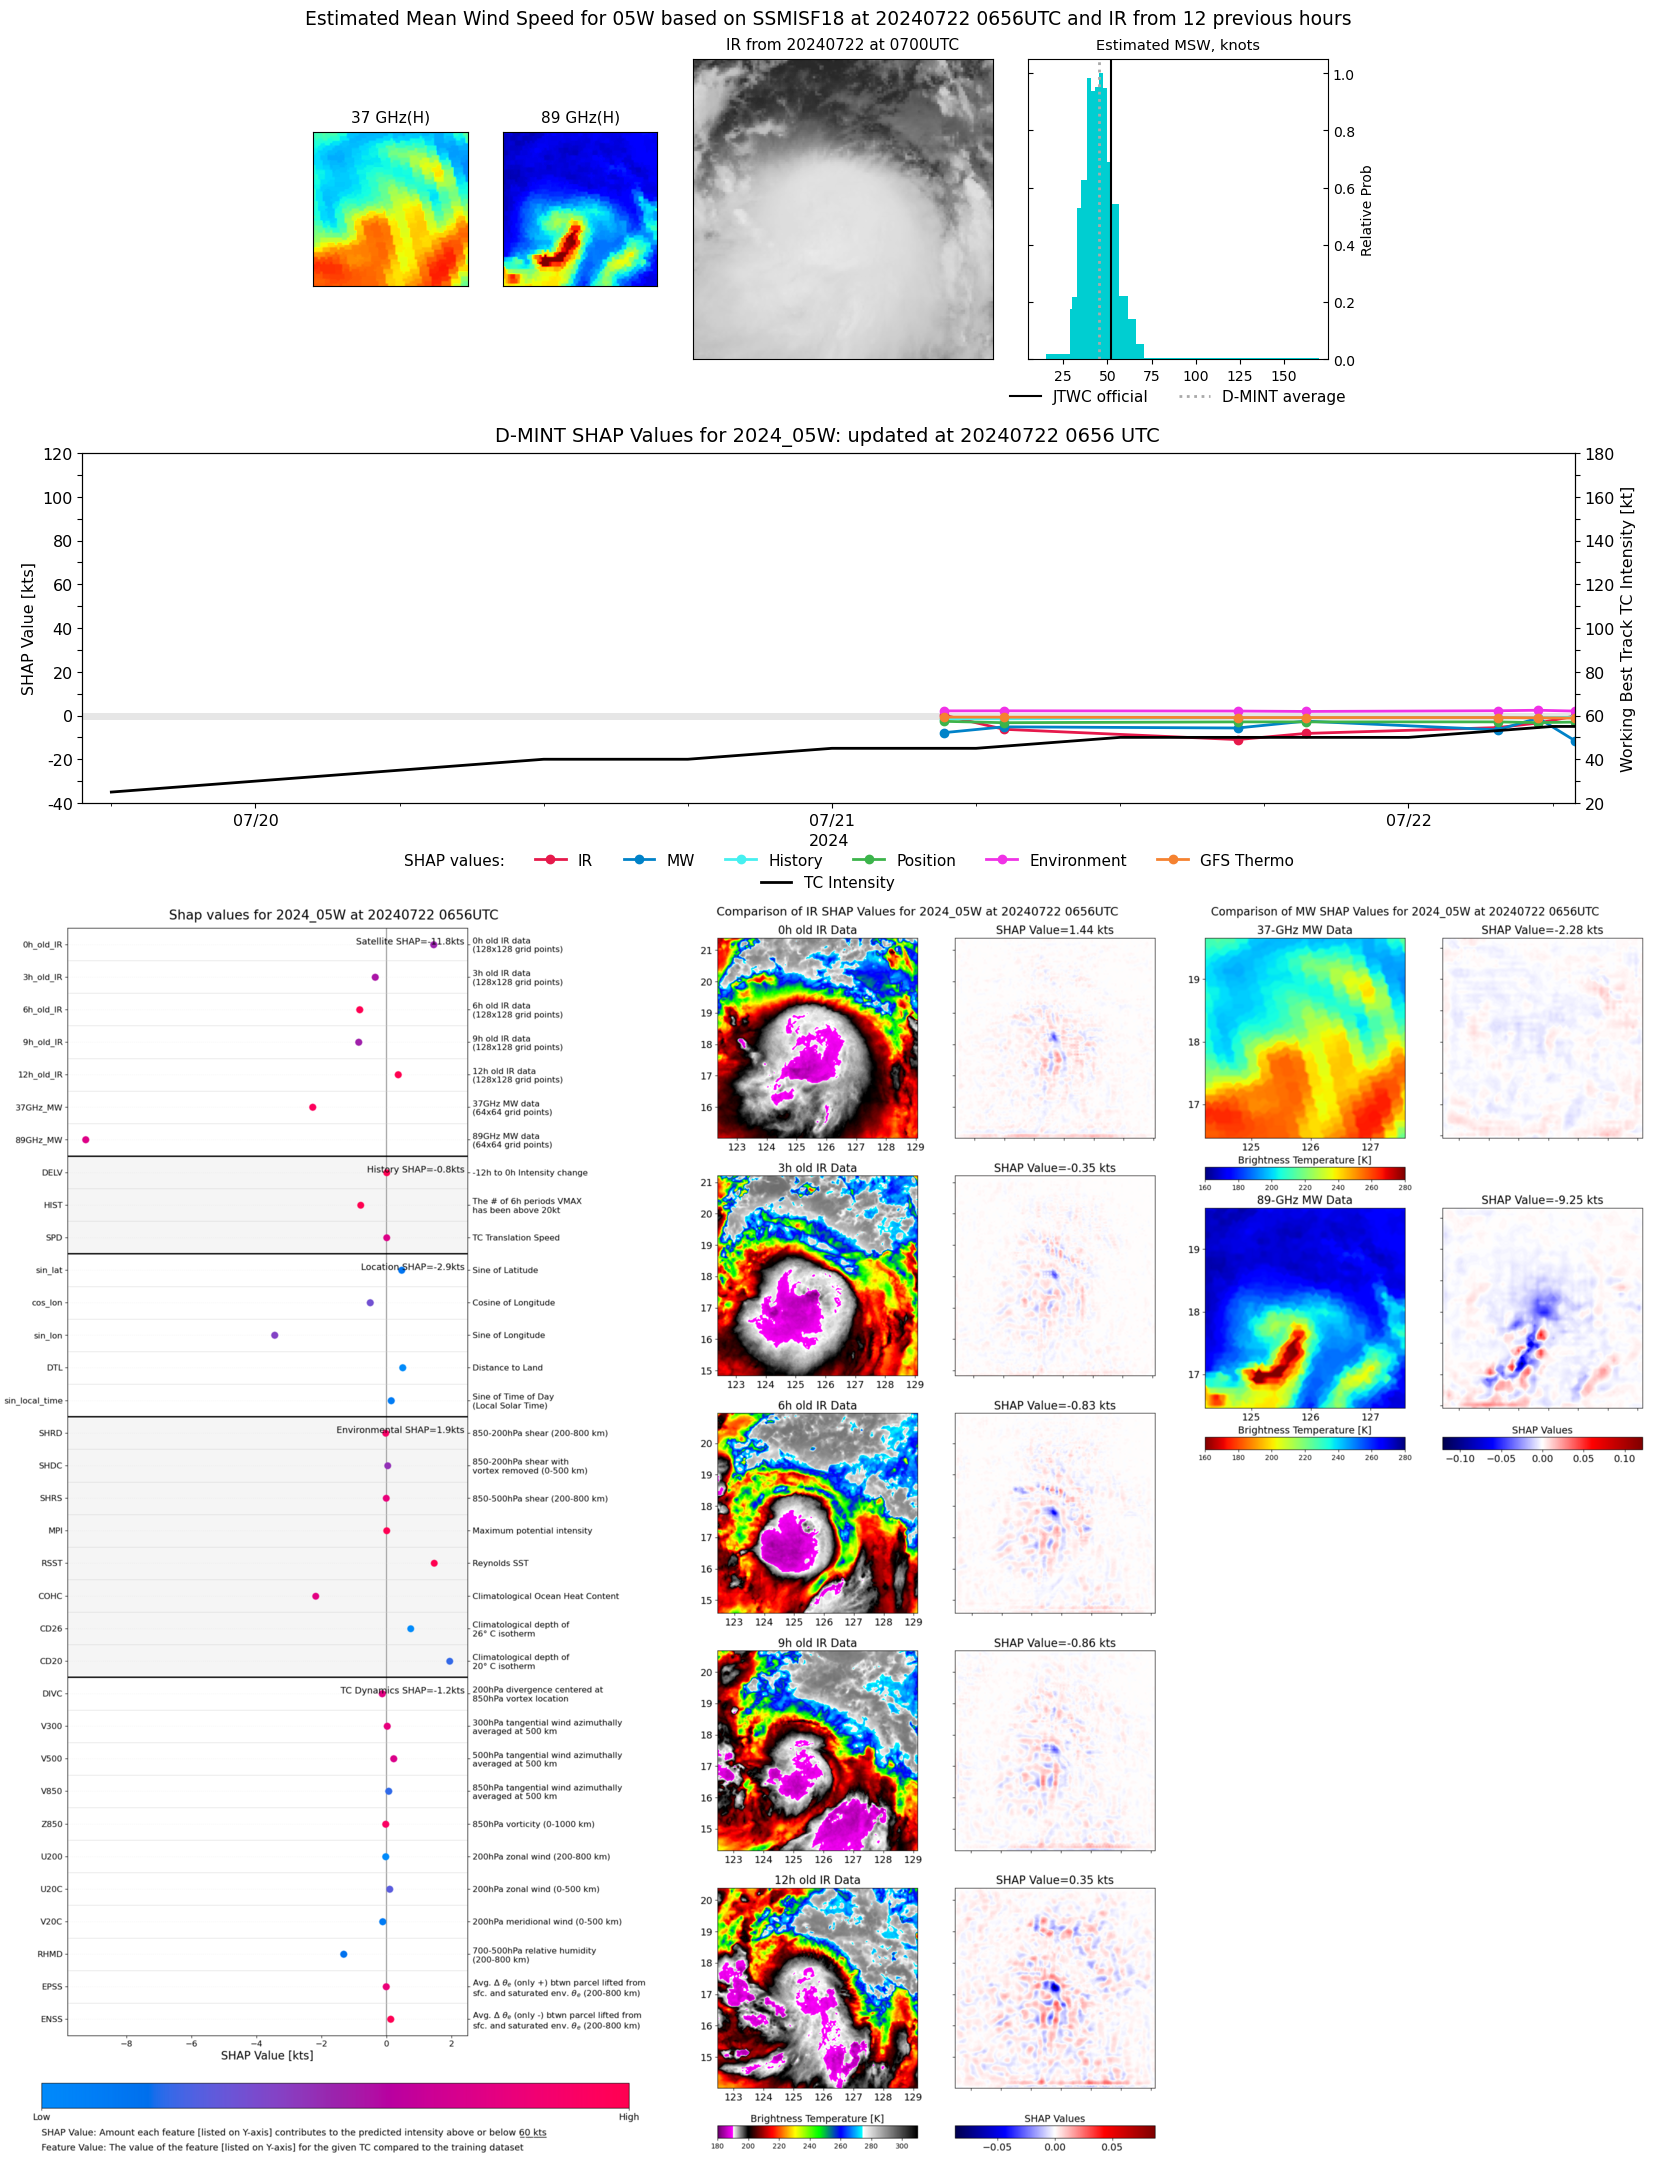 |
| 20240722 | 0524 UTC | AMSR2 | 986 hPa | 55 kts | 49 kts | 61 kts | 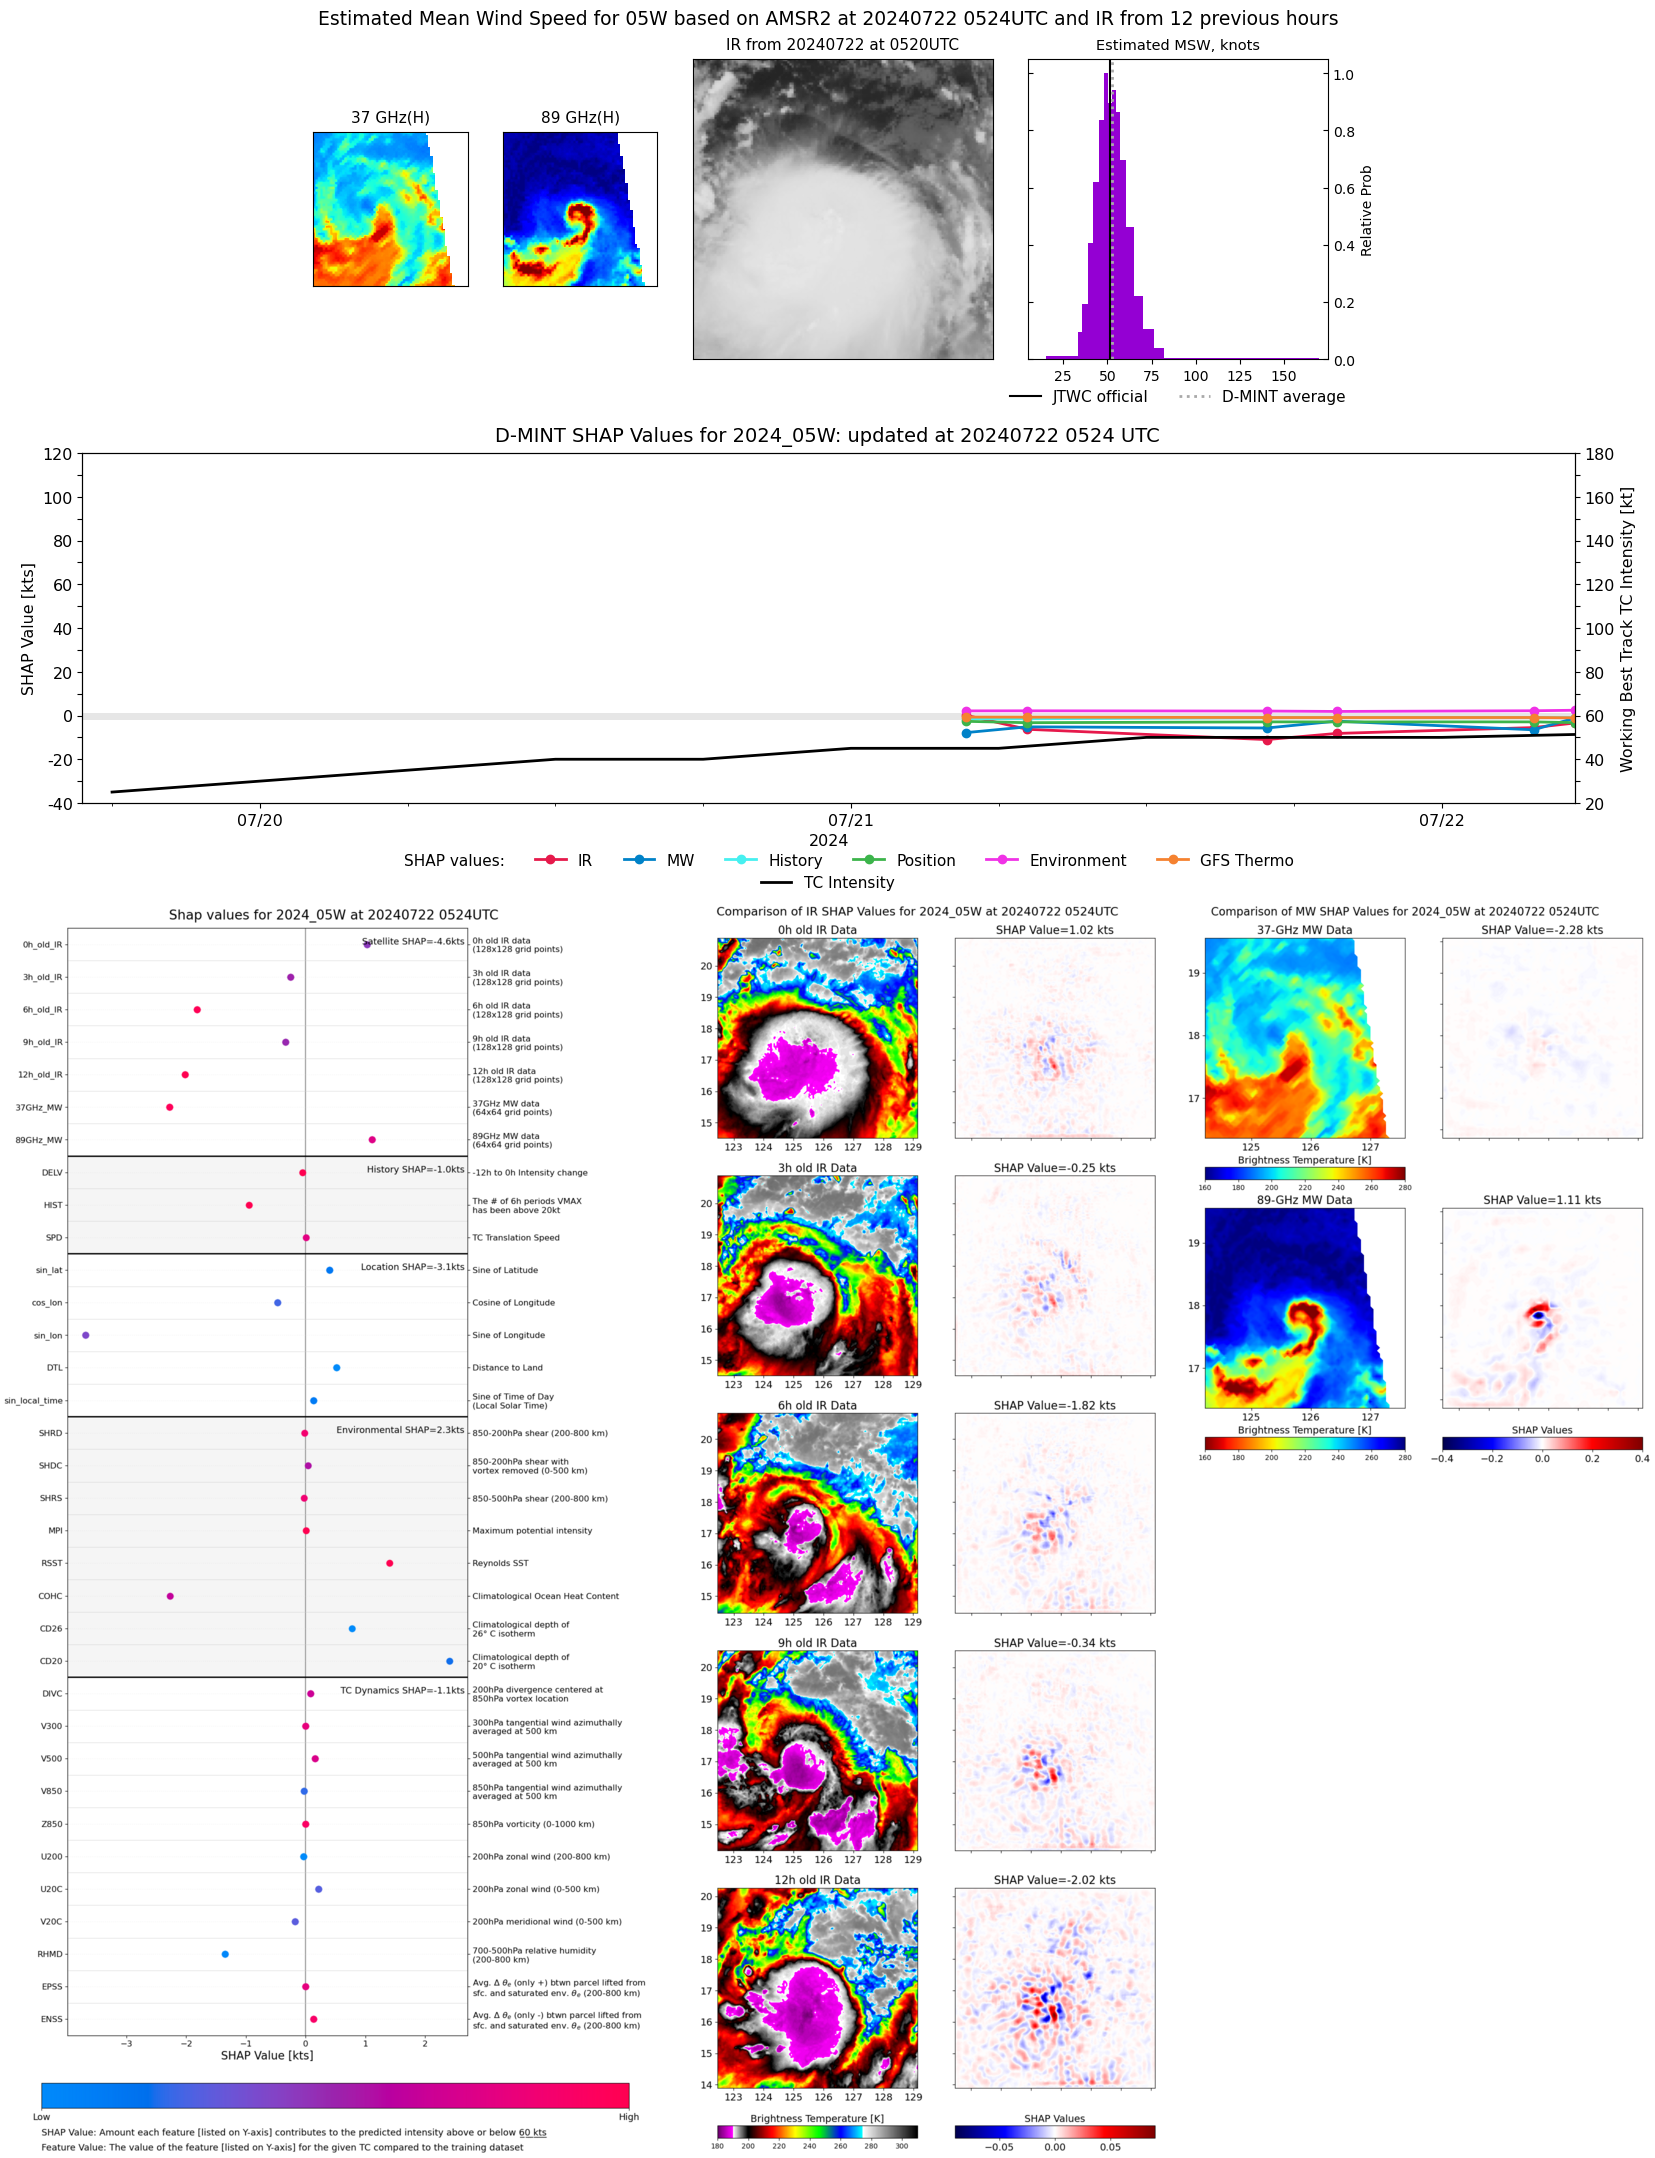 |
| 20240722 | 0513 UTC | ATMS | 987 hPa | 57 kts | 51 kts | 63 kts | 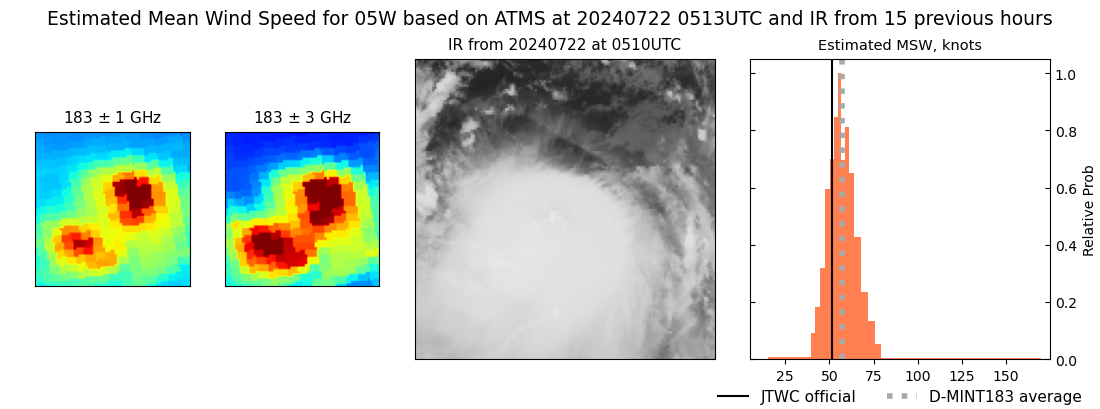 |
| 20240722 | 0448 UTC | ATMS | 992 hPa | 49 kts | 45 kts | 54 kts | 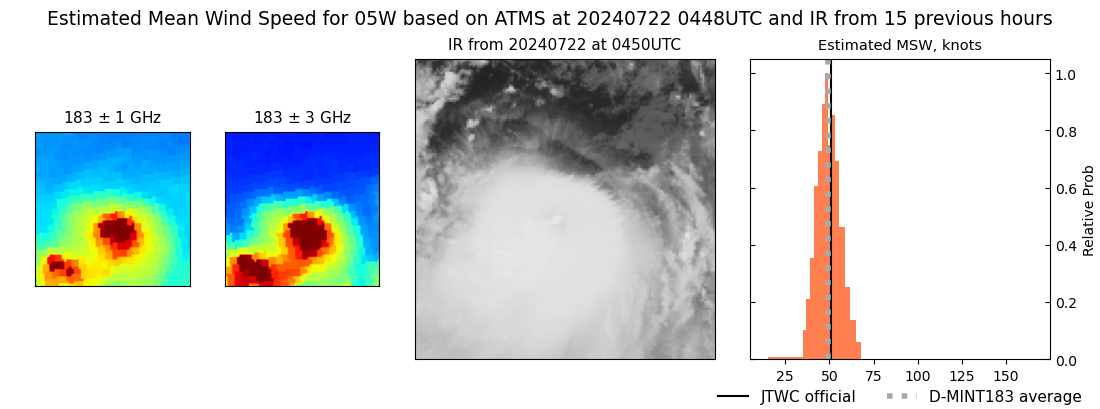 |
| 20240722 | 0343 UTC | GMI | 988 hPa | 45 kts | 40 kts | 51 kts | 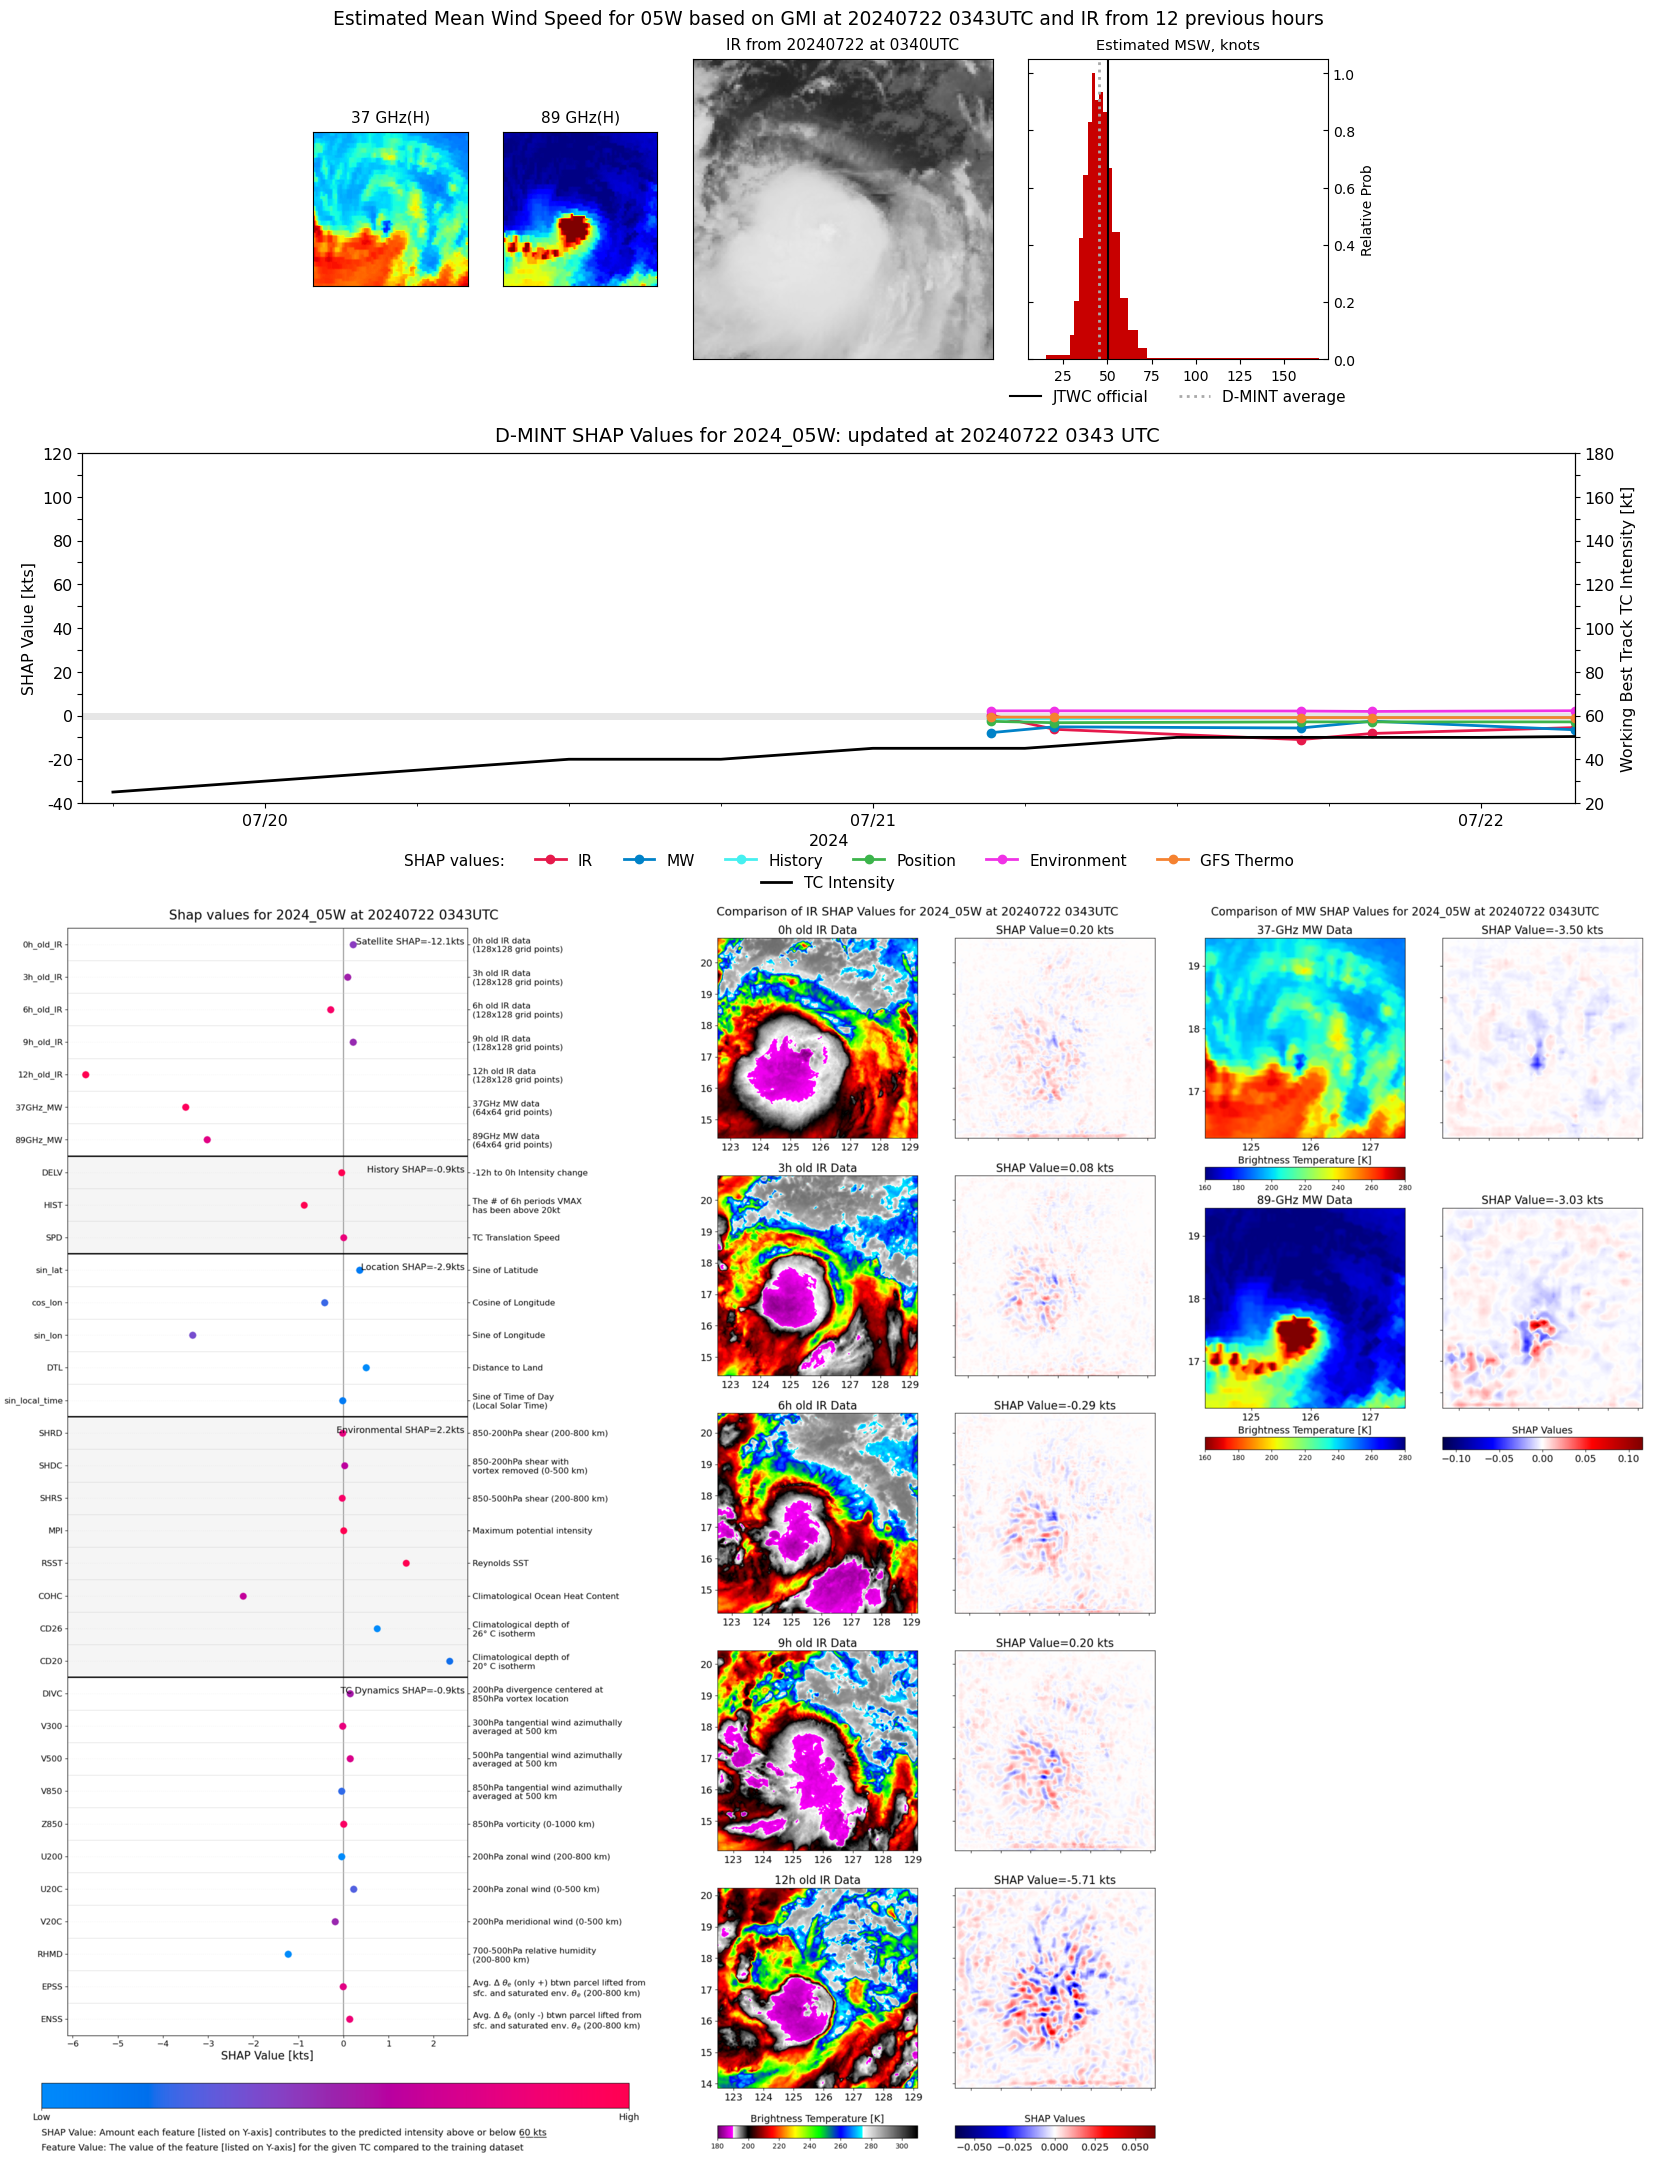 |
| 20240721 | 2150 UTC | SSMISF16 | 993 hPa | 38 kts | 33 kts | 43 kts | 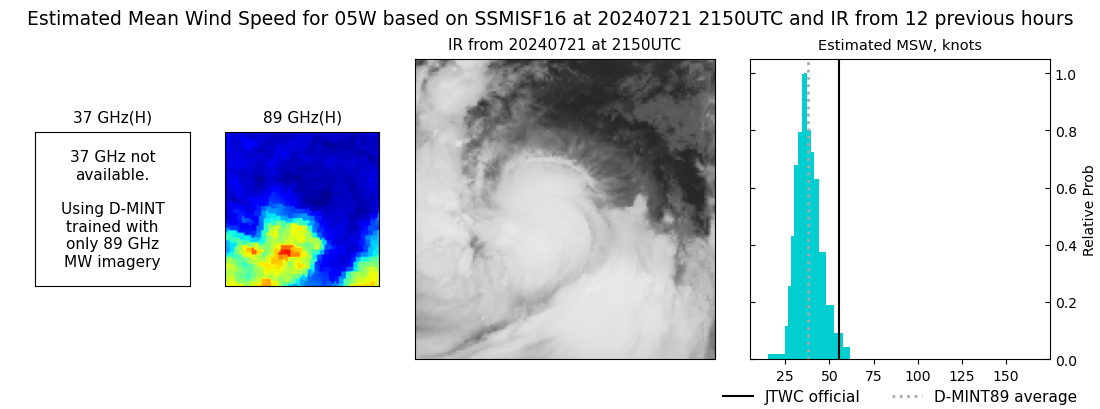 |
| 20240721 | 1943 UTC | SSMISF18 | 991 hPa | 46 kts | 41 kts | 51 kts | 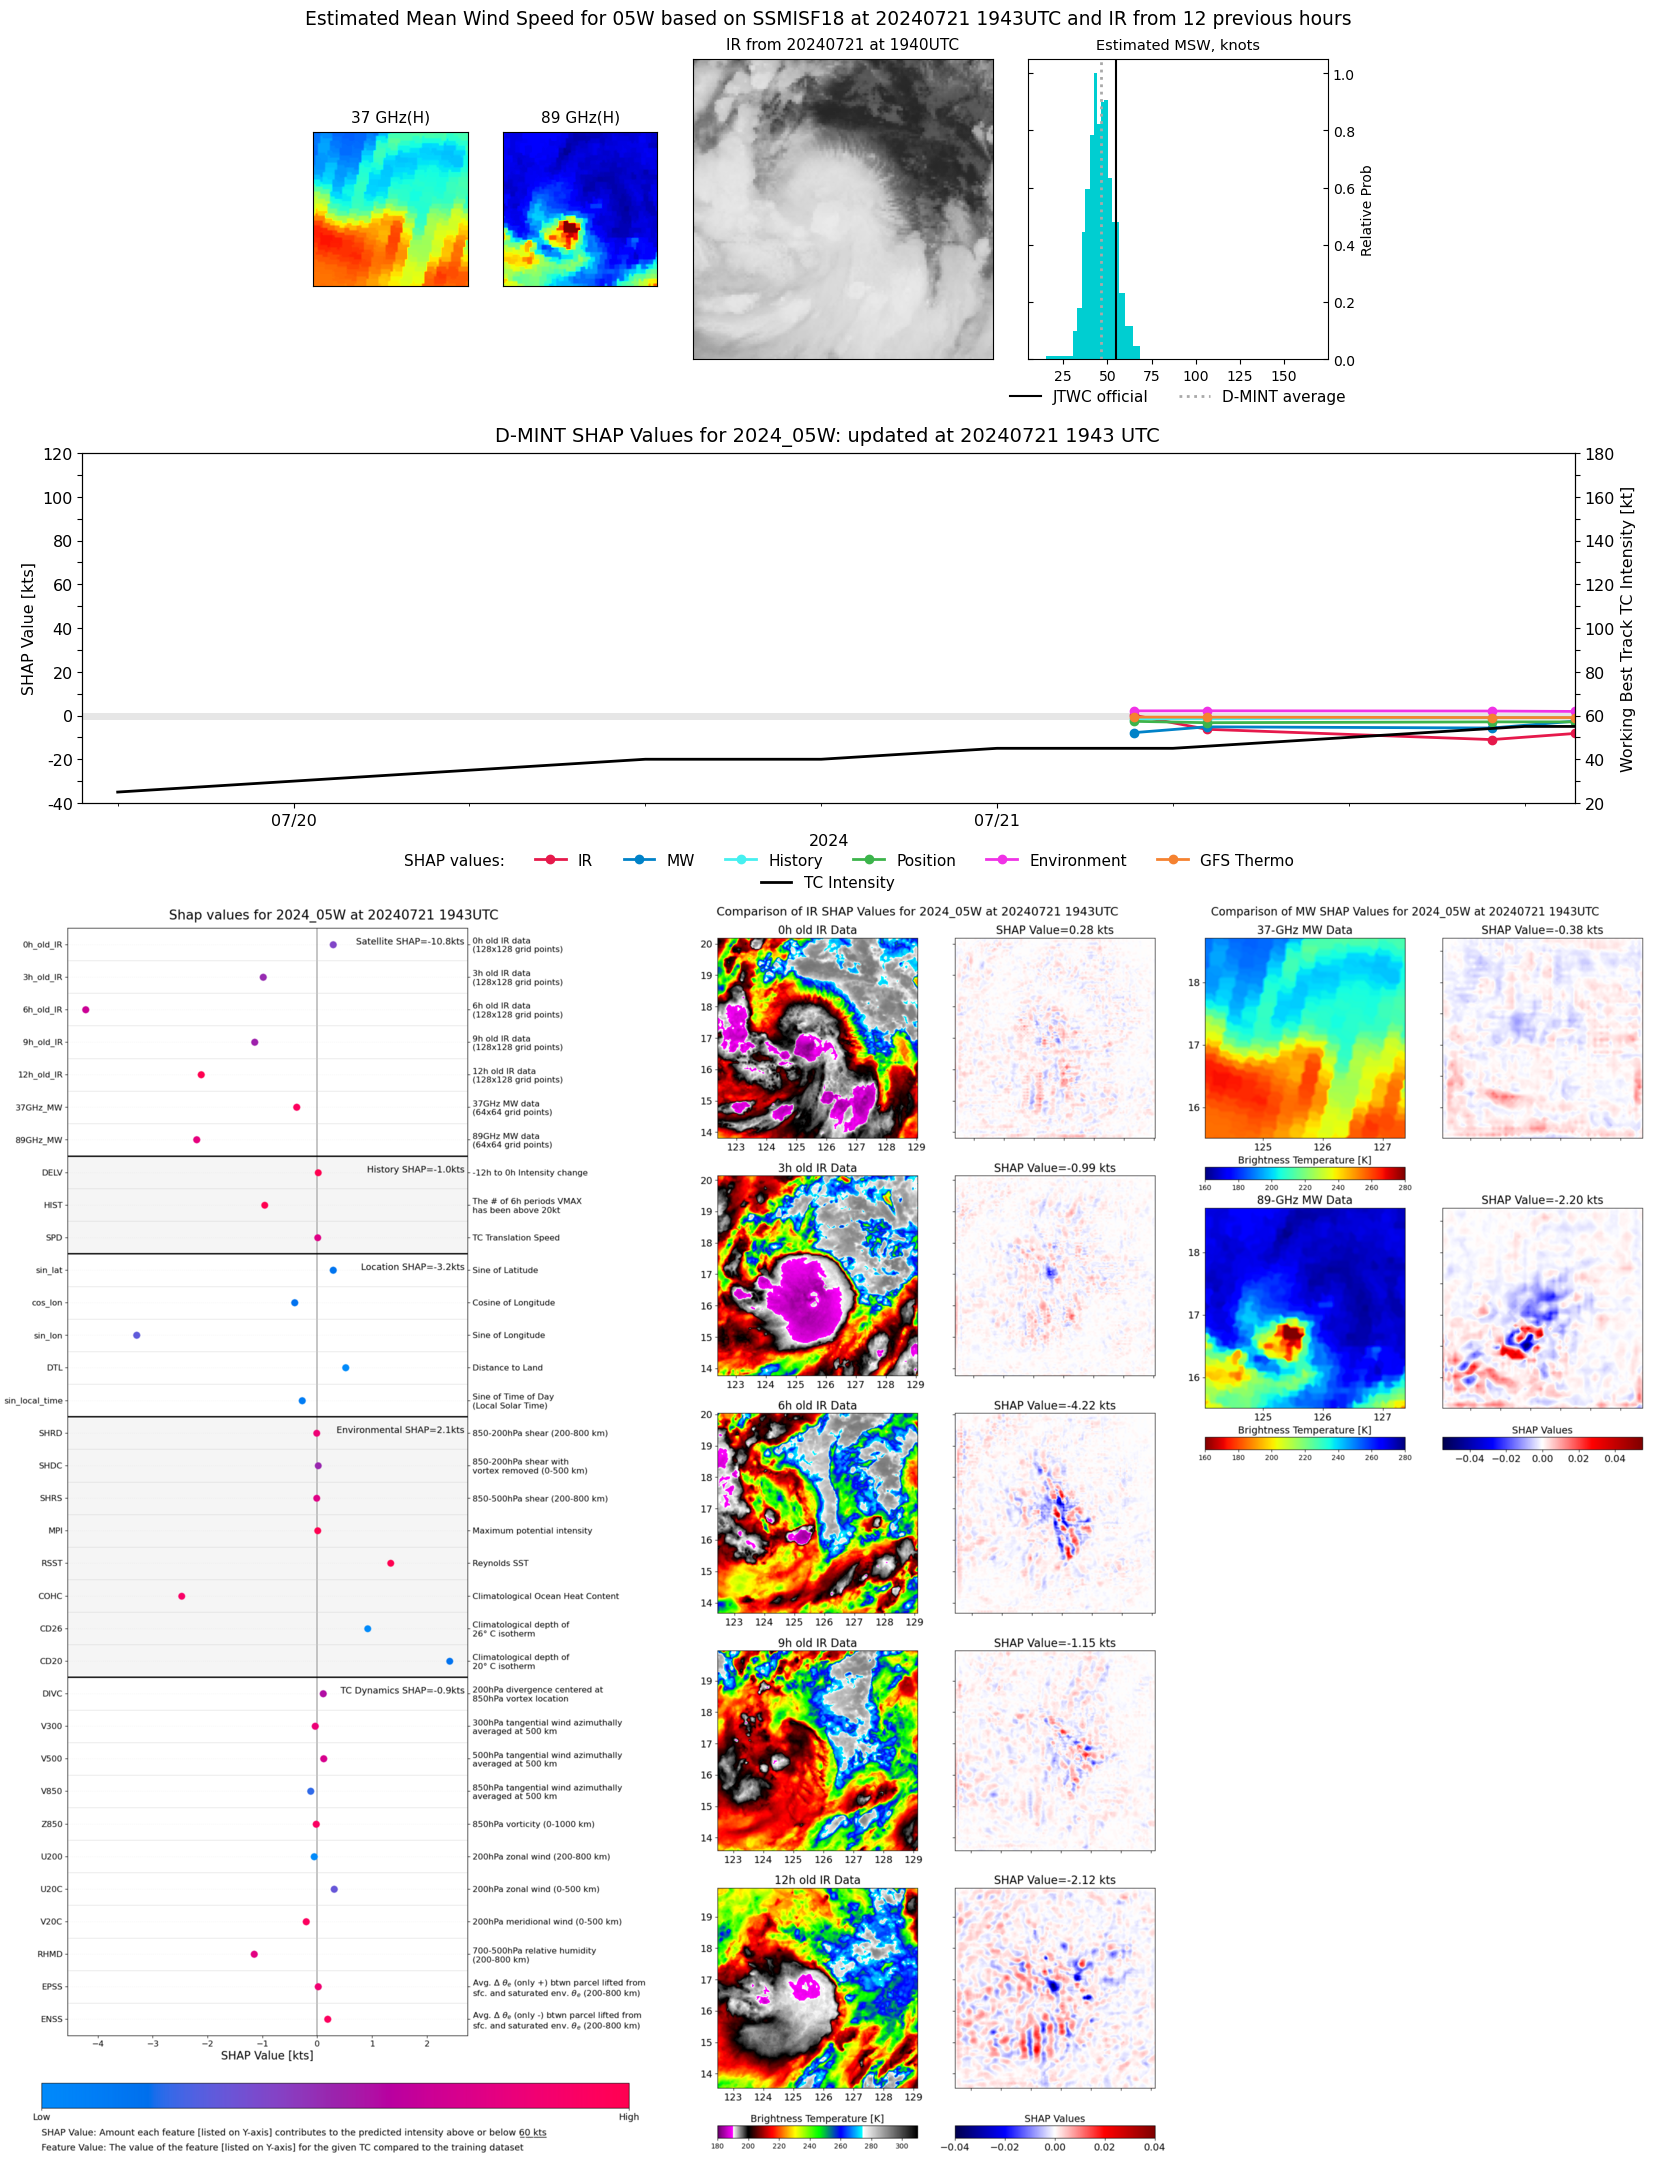 |
| 20240721 | 1738 UTC | ATMS | 984 hPa | 53 kts | 45 kts | 62 kts | 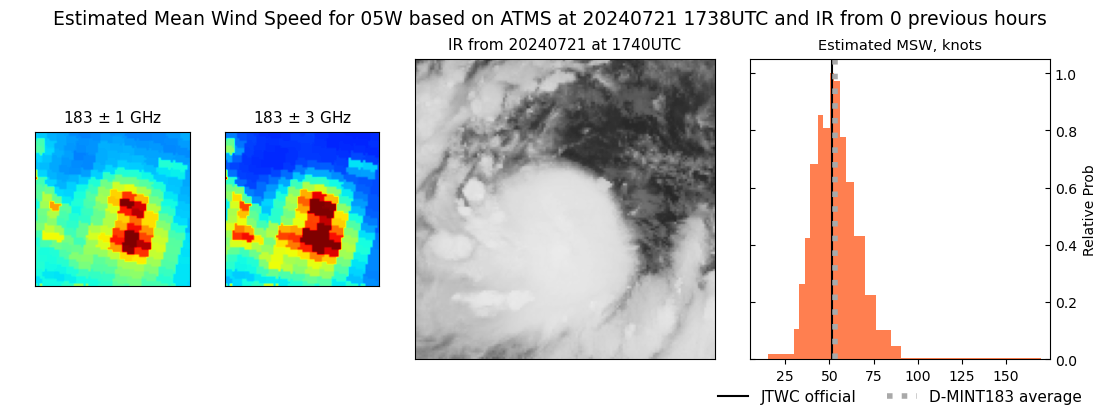 |
| 20240721 | 1653 UTC | AMSR2 | 994 hPa | 40 kts | 37 kts | 45 kts | 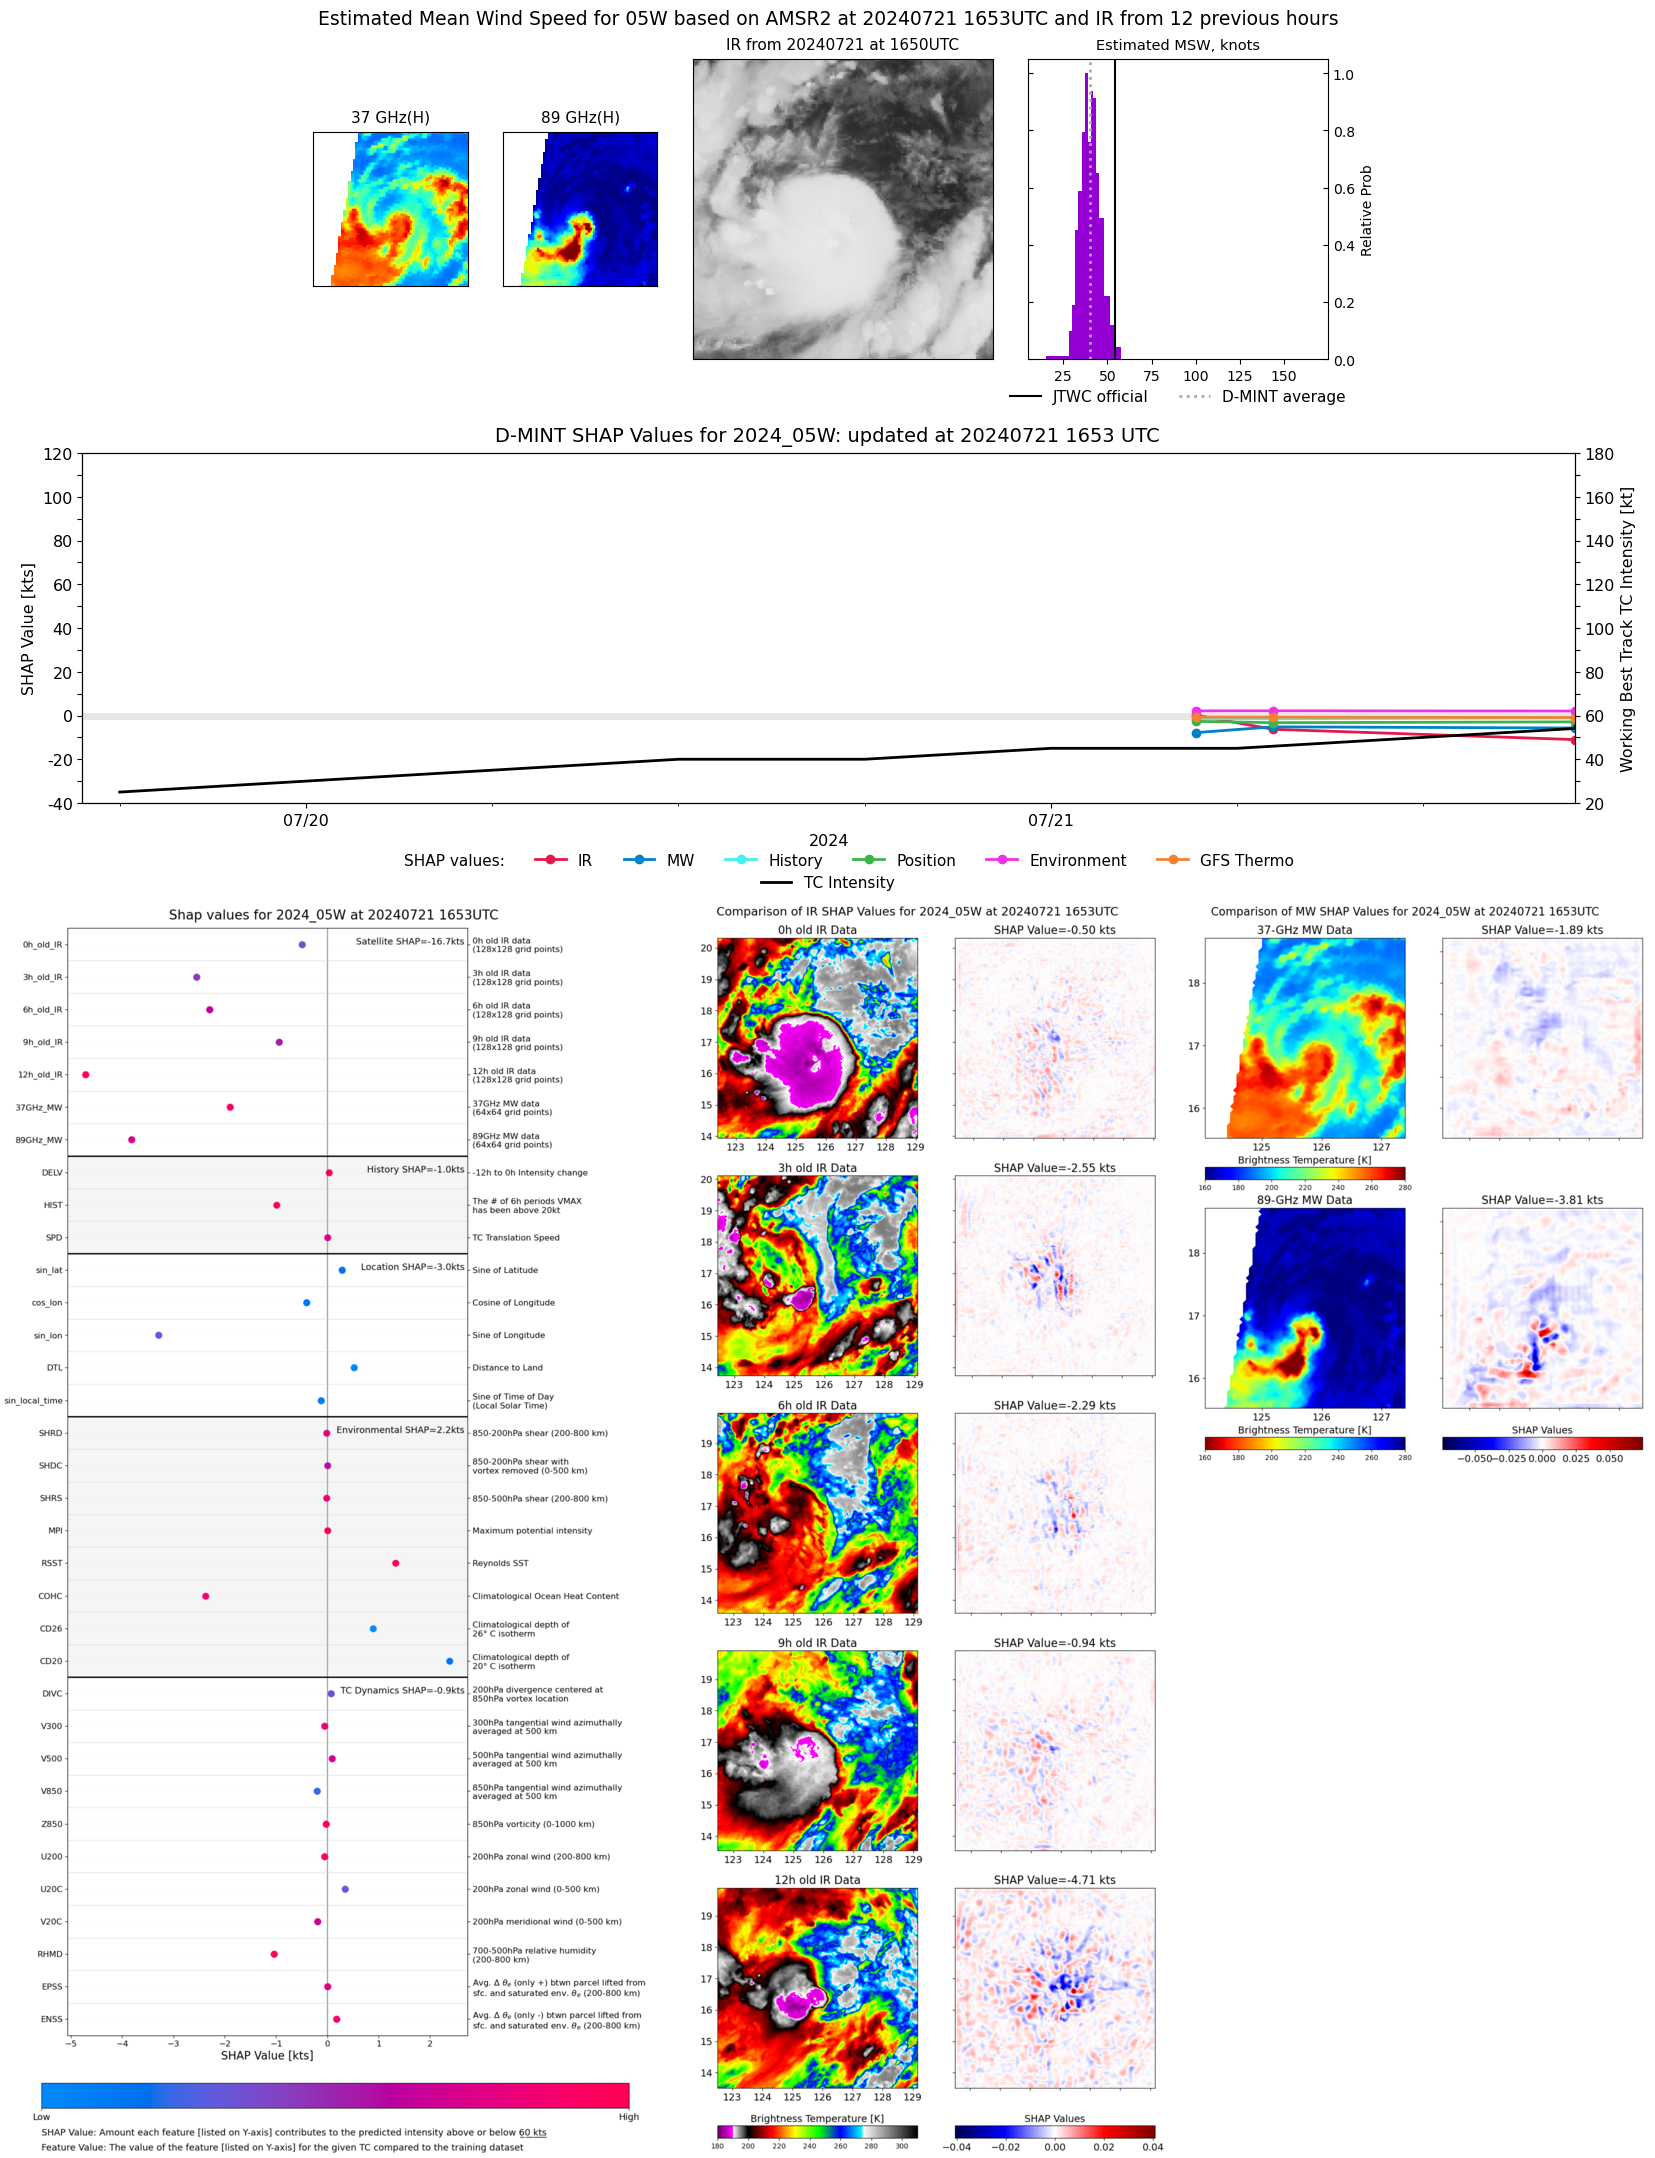 |
| 20240721 | 1647 UTC | ATMS | 983 hPa | 48 kts | 43 kts | 53 kts | 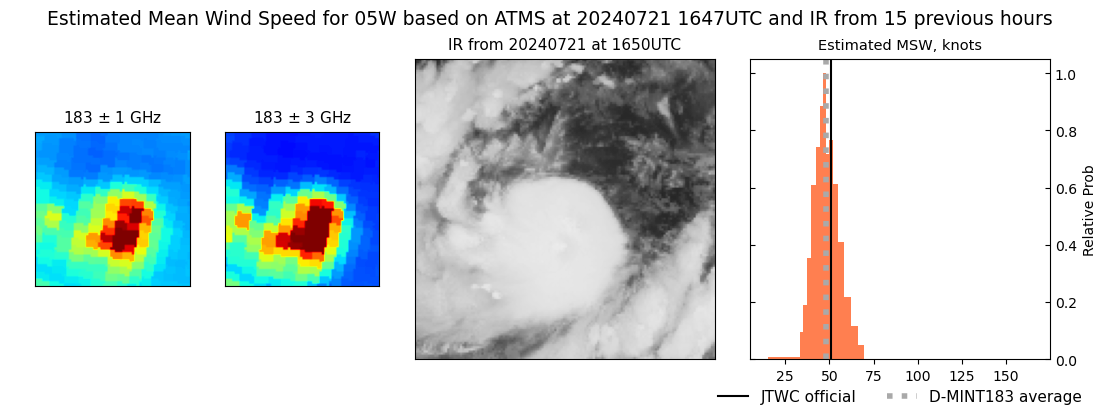 |
| 20240721 | 0916 UTC | SSMISF16 | 984 hPa | 47 kts | 41 kts | 53 kts | 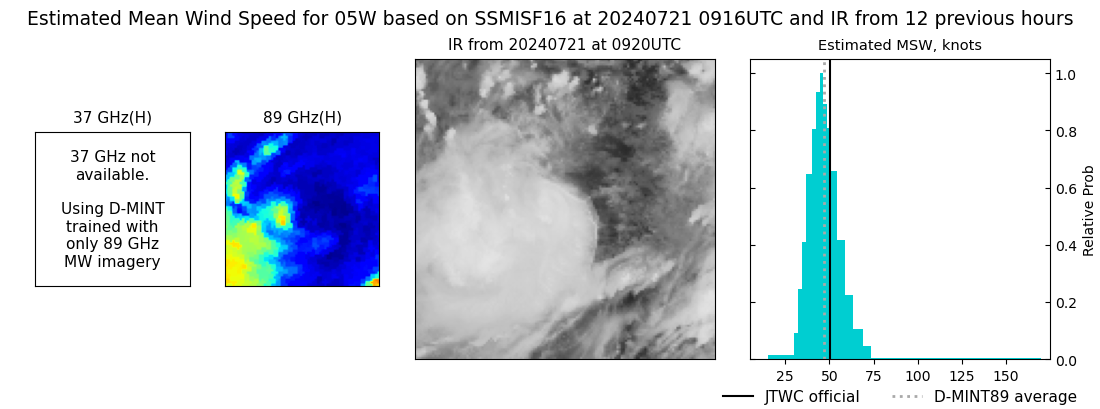 |
| 20240721 | 0709 UTC | SSMISF18 | 986 hPa | 48 kts | 42 kts | 54 kts | 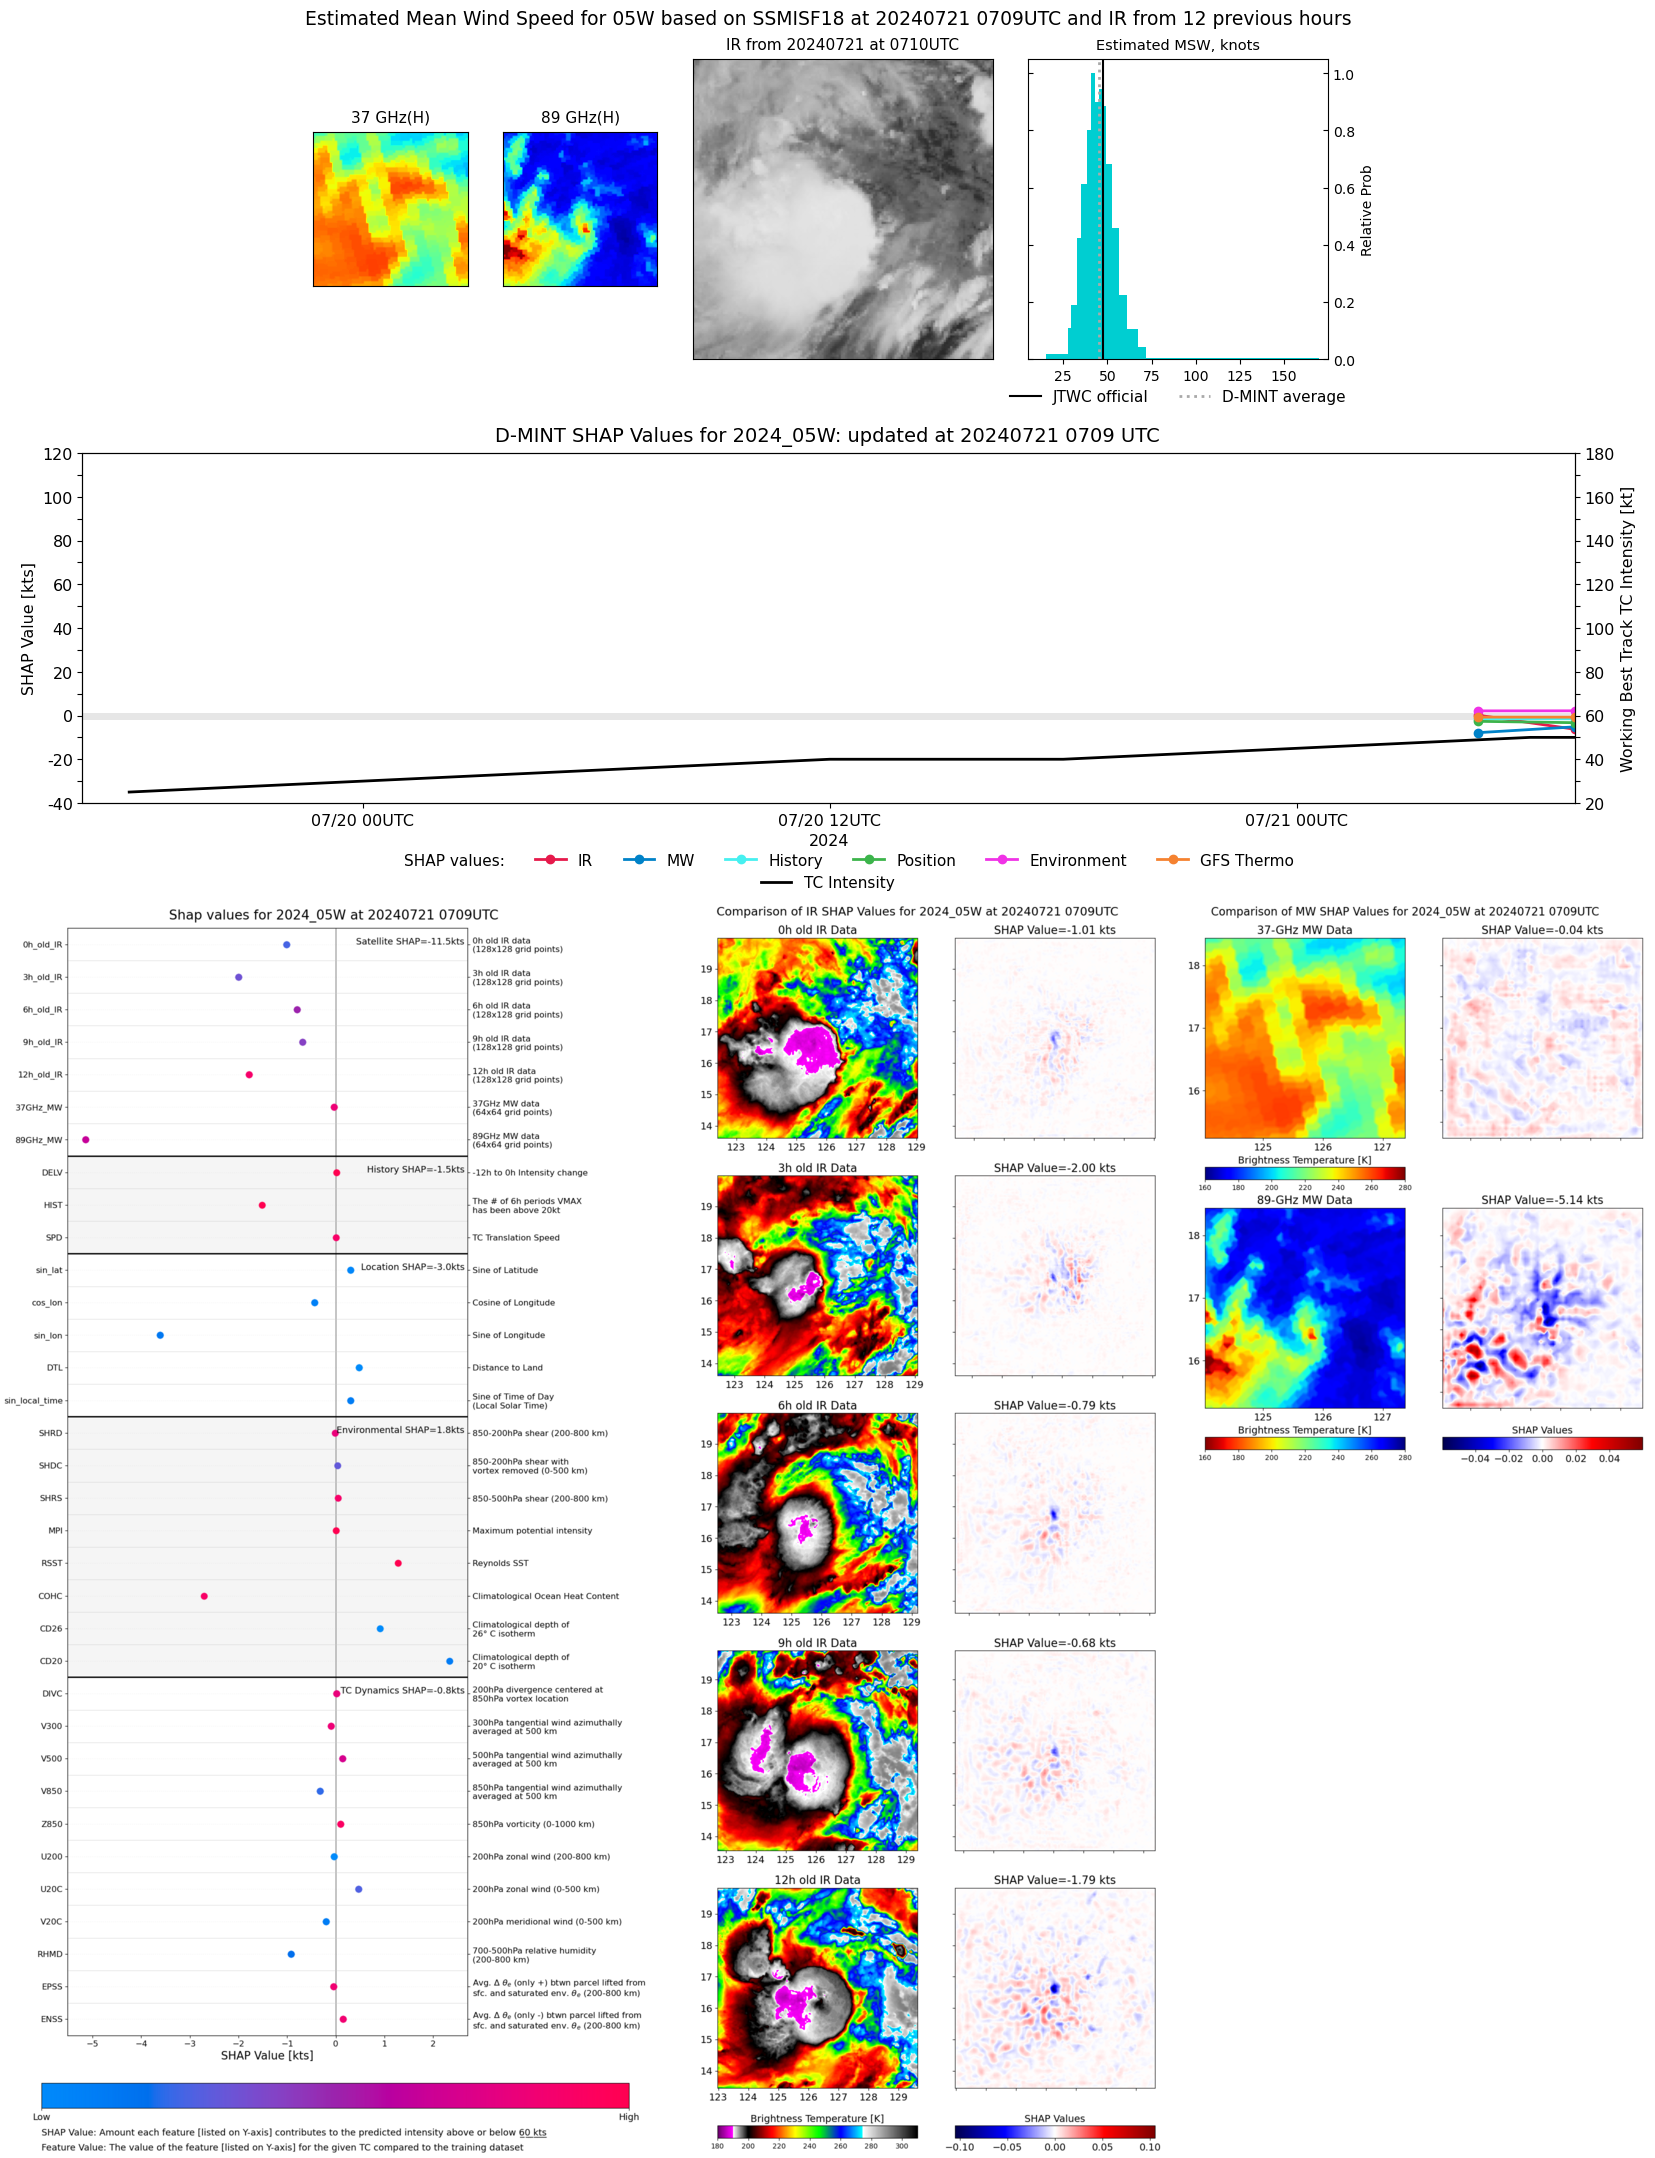 |
| 20240721 | 0506 UTC | ATMS | 987 hPa | 51 kts | 46 kts | 57 kts | 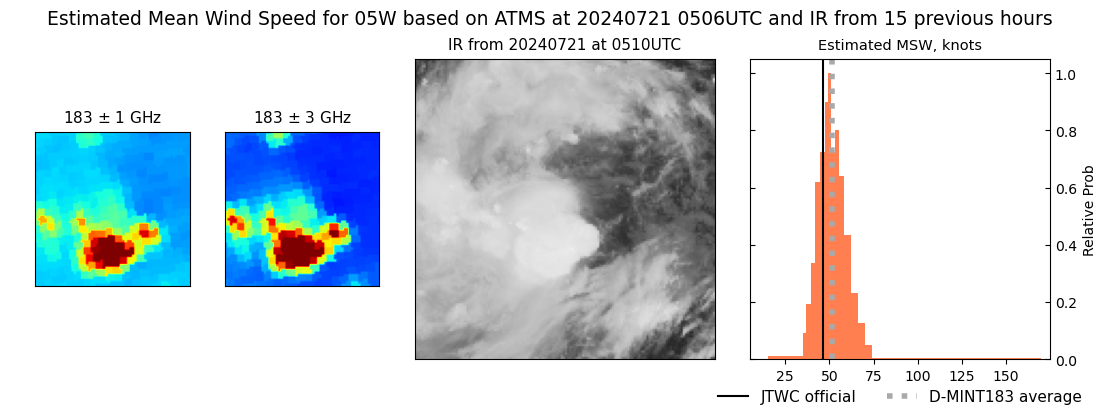 |
| 20240721 | 0440 UTC | AMSR2 | 987 hPa | 48 kts | 43 kts | 54 kts | 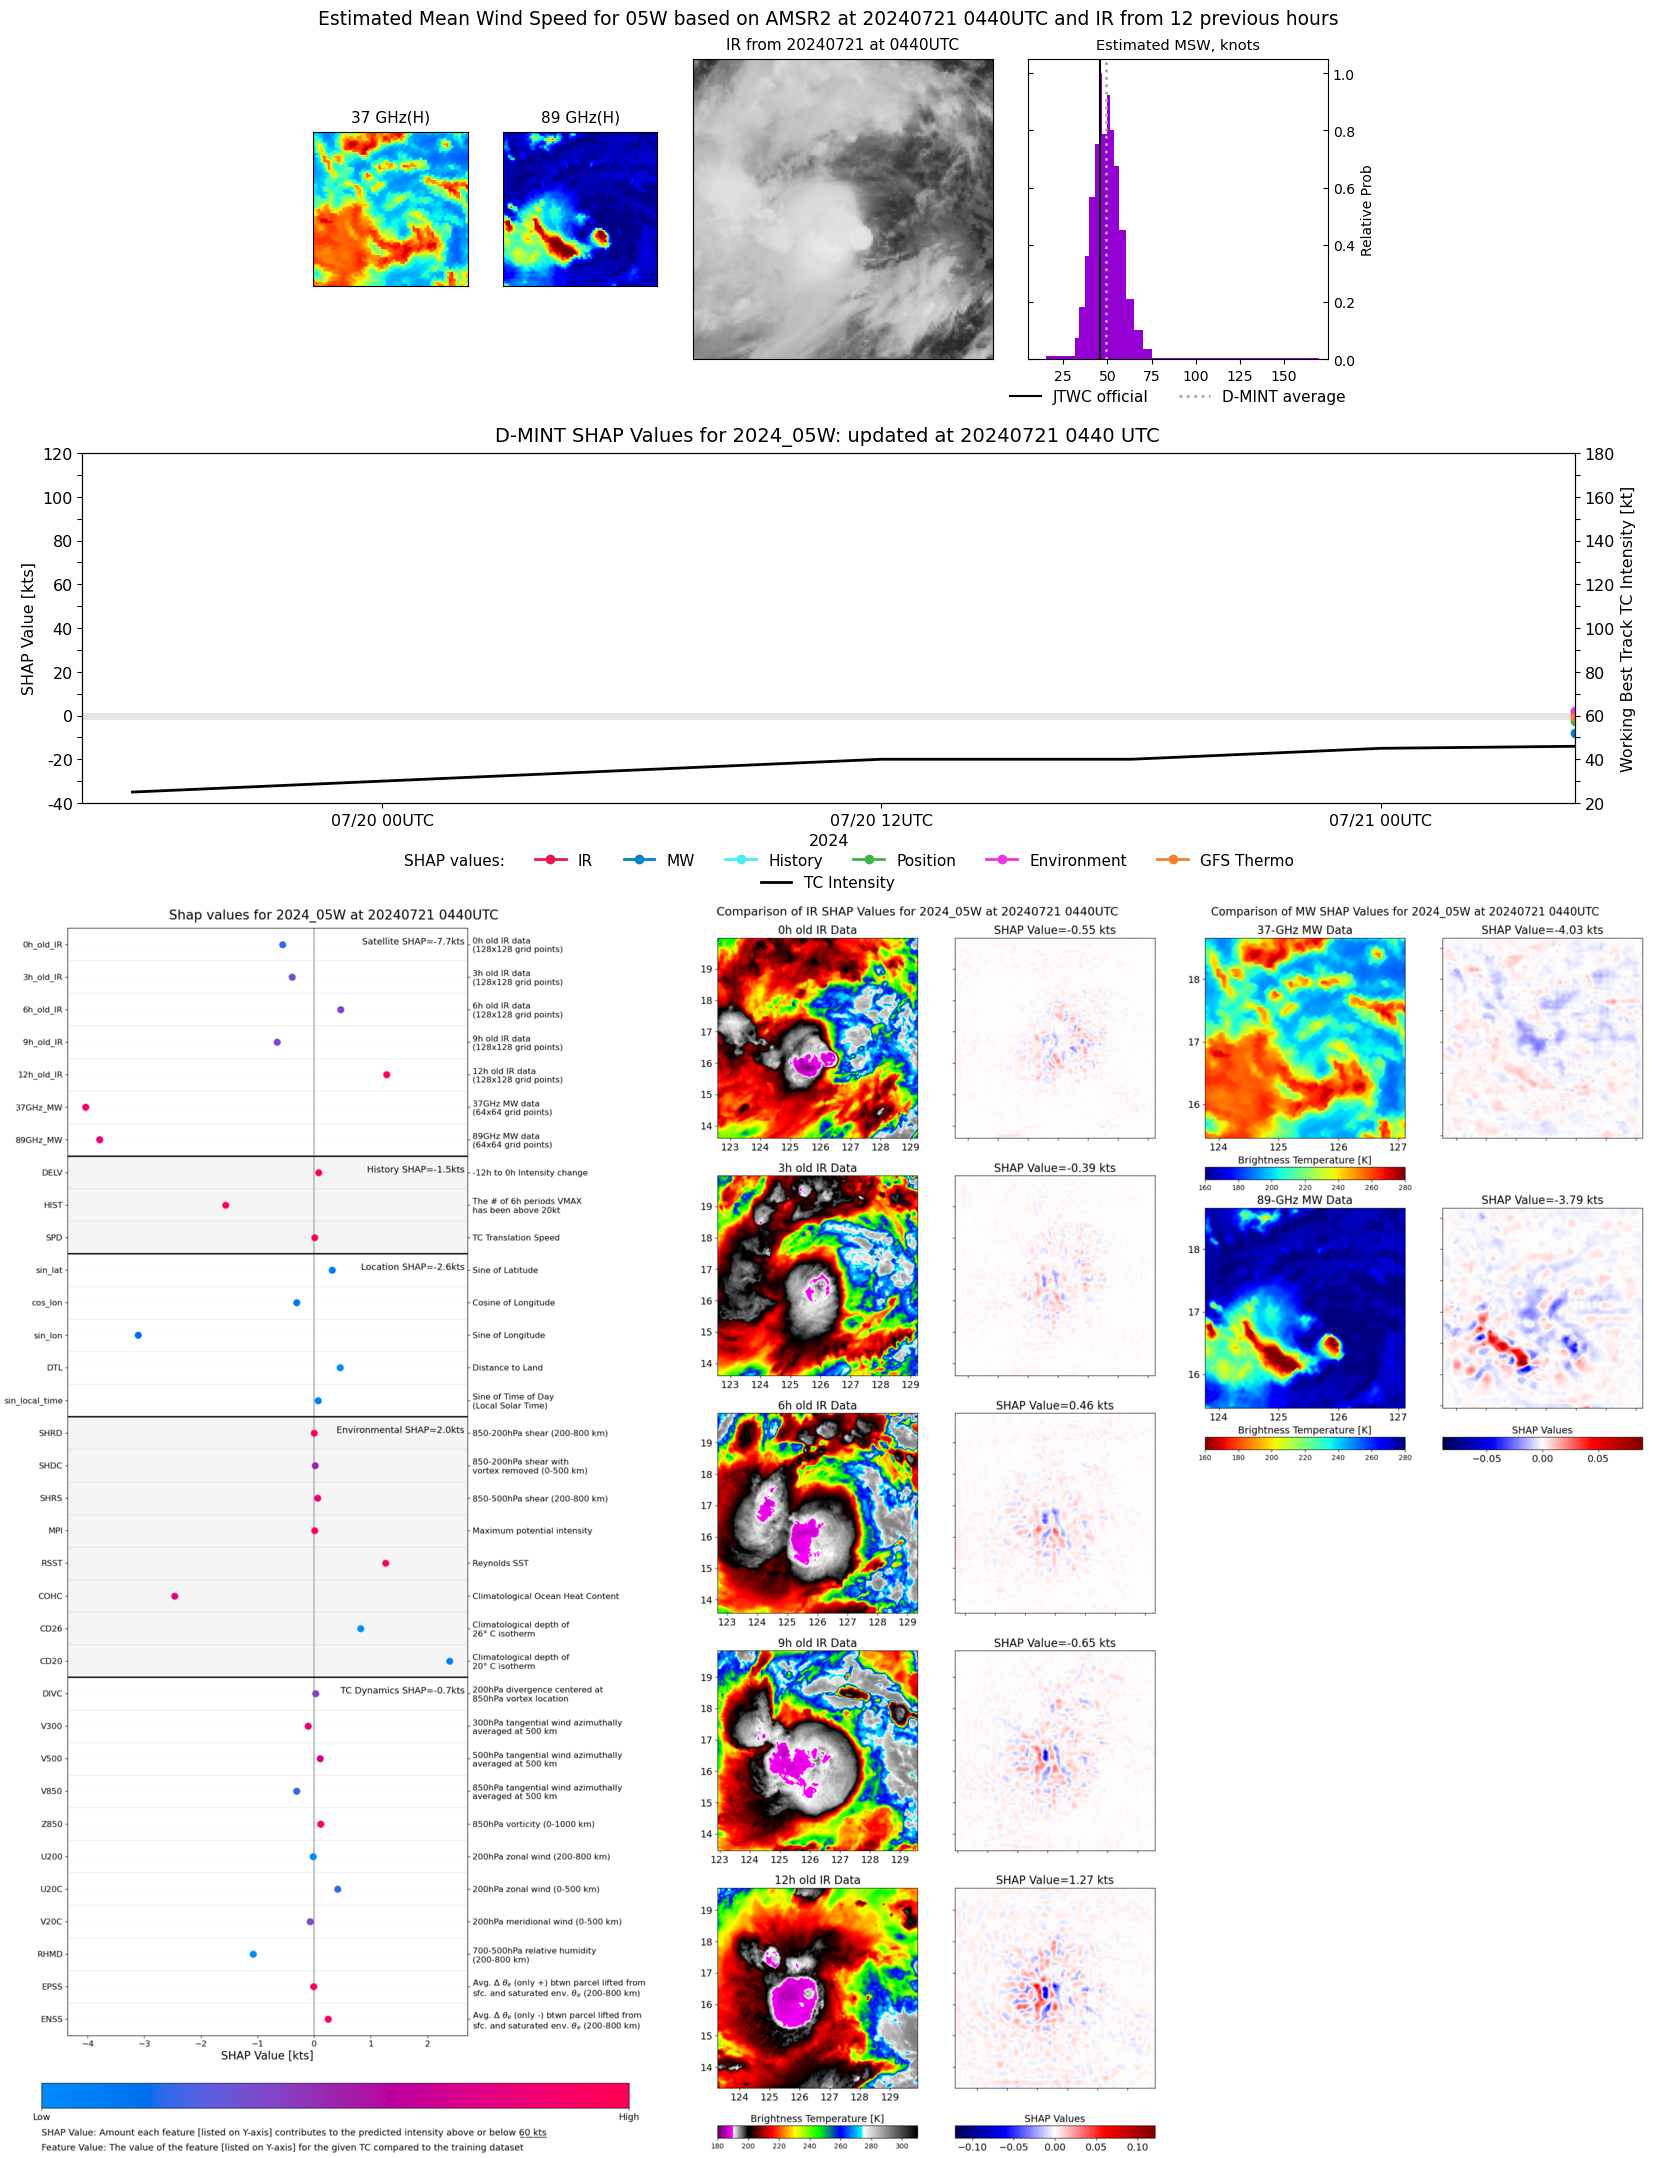 |
| 20240721 | 0415 UTC | ATMS | 989 hPa | 46 kts | 41 kts | 52 kts | 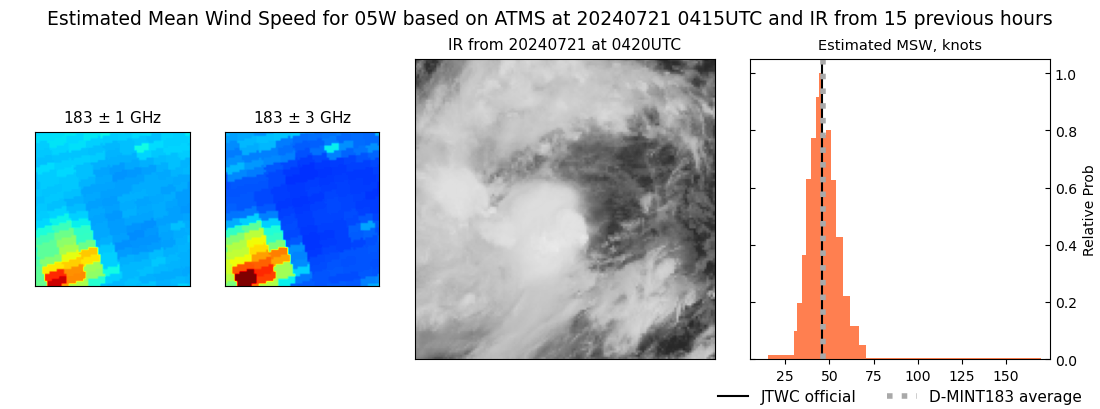 |