|
||

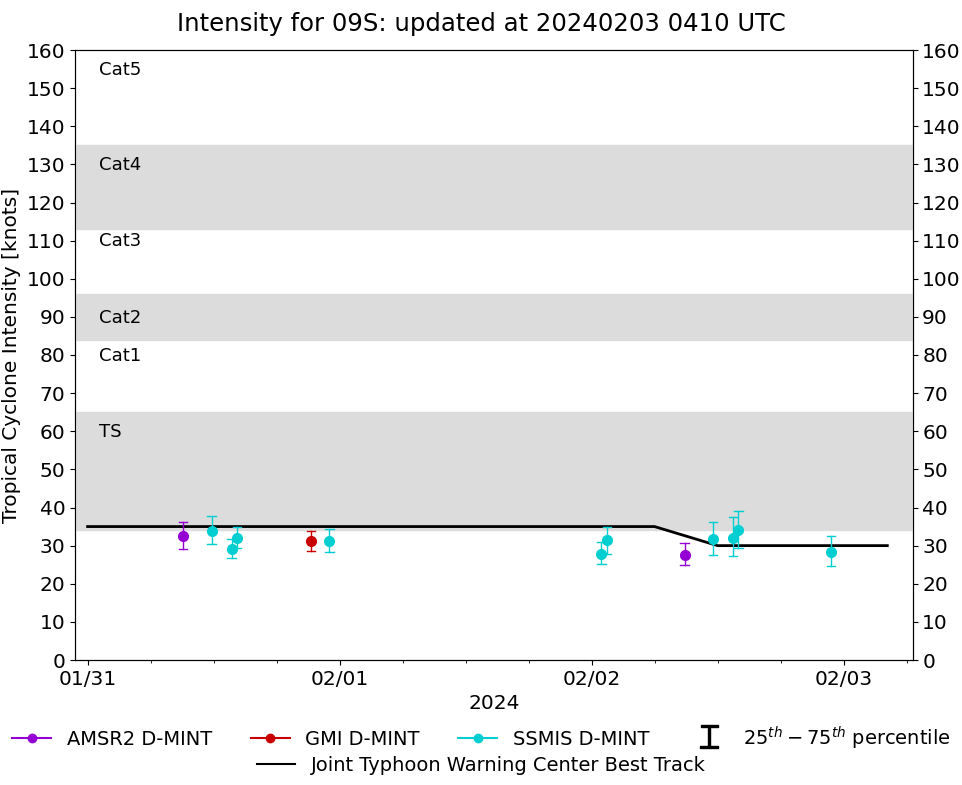 |
D-MINT HISTORY FILE for 2024_09S
| Date | Time | MW Sensor | MSLP | Vmax (30th-70th percentile average) | Vmax 25th percentile | Vmax 75th percentile | Image |
| 20240202 | 2249 UTC | SSMISF18 | 995 hPa | 28 kts | 25 kts | 32 kts | 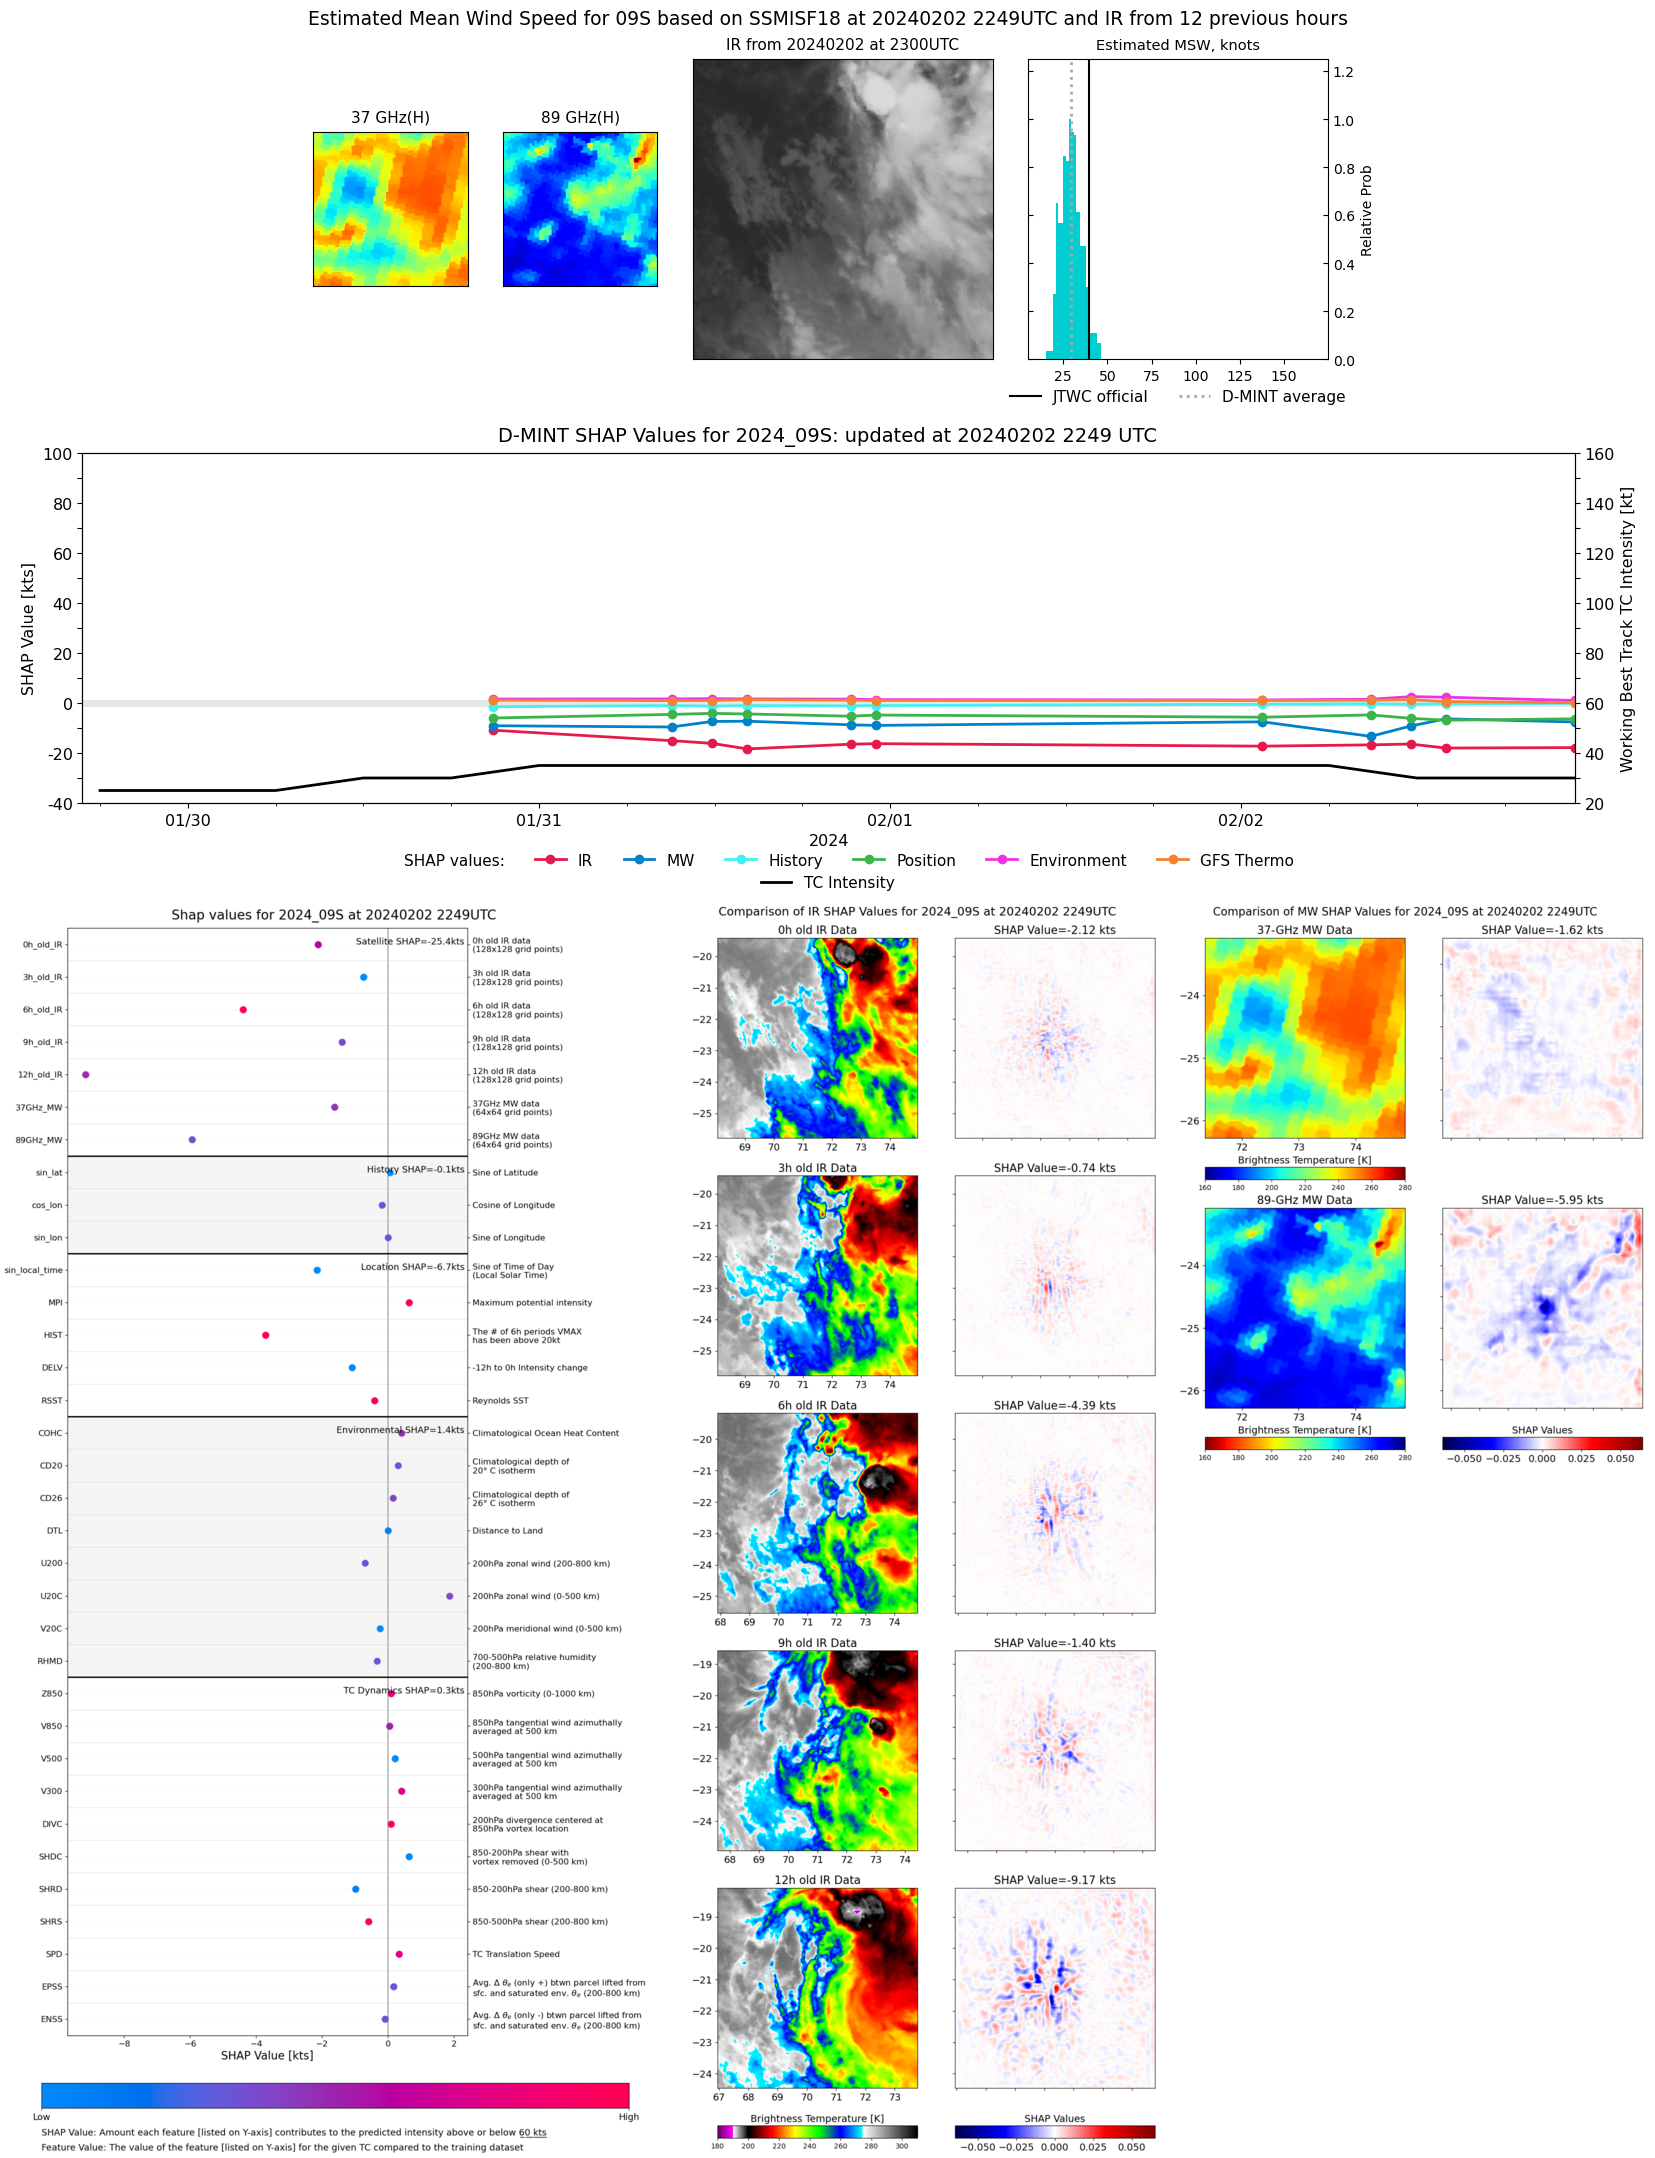 |
| 20240202 | 1359 UTC | SSMISF17 | 997 hPa | 34 kts | 29 kts | 39 kts | 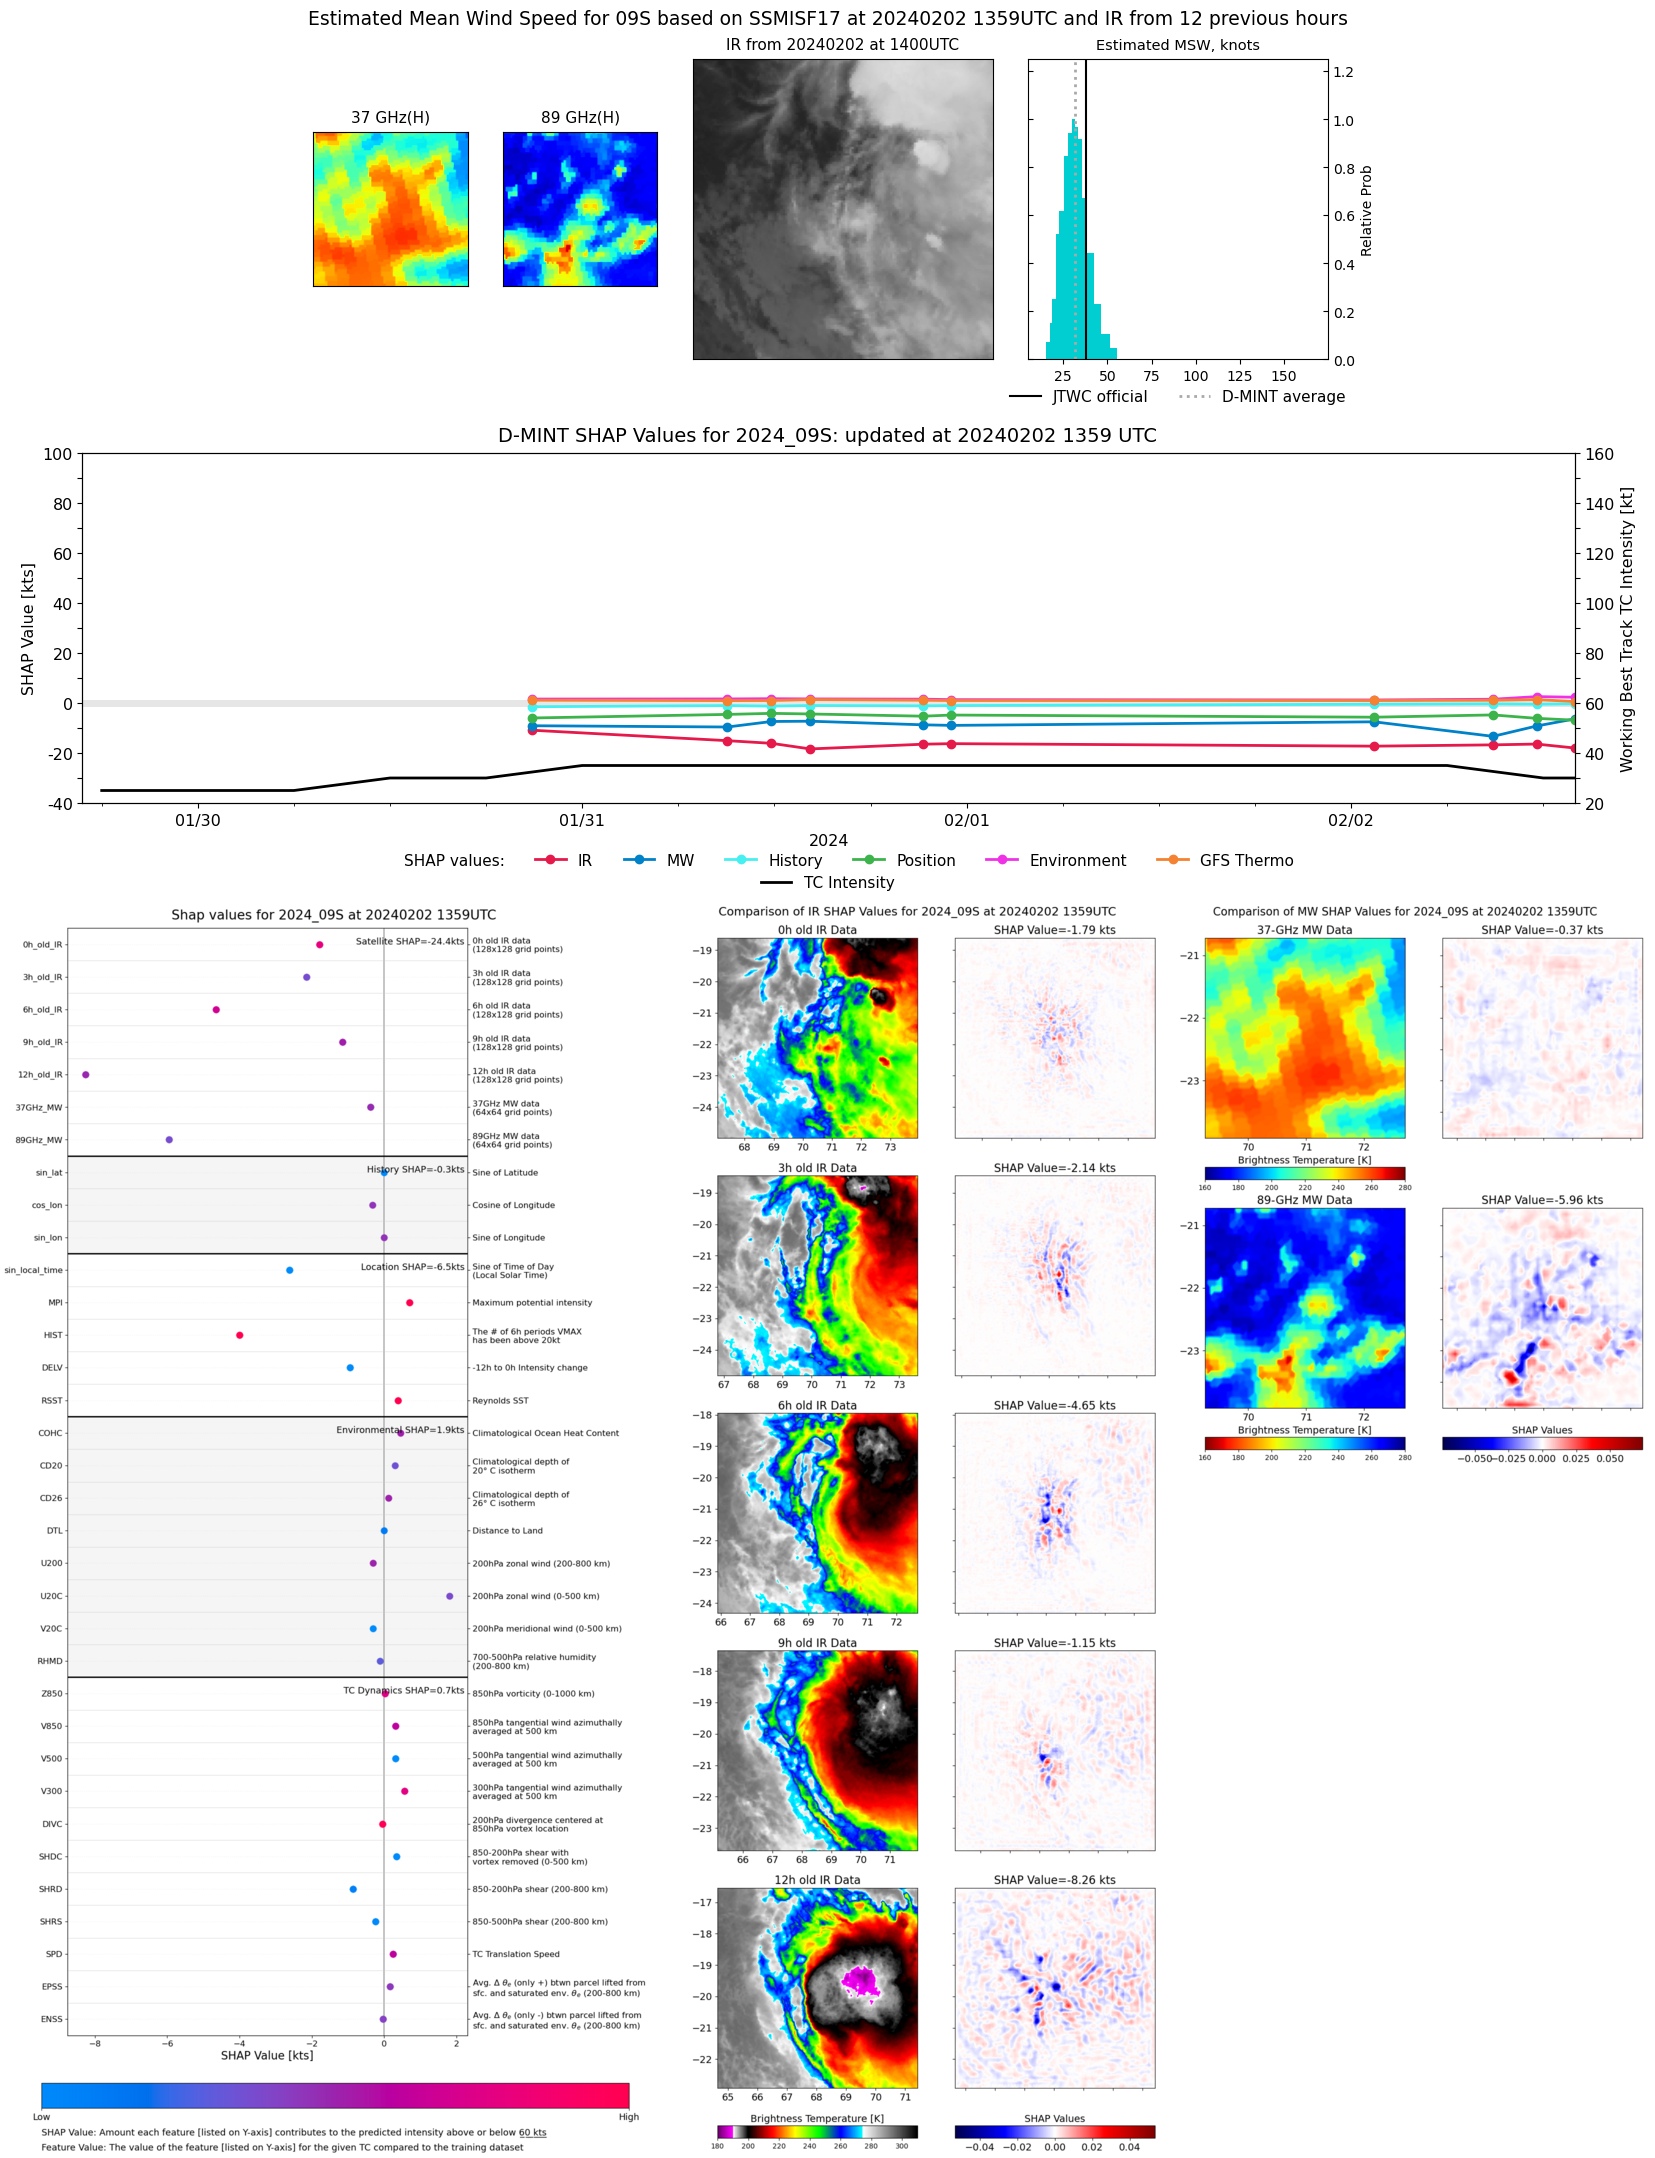 |
| 20240202 | 1330 UTC | SSMISF16 | 995 hPa | 32 kts | 27 kts | 38 kts | 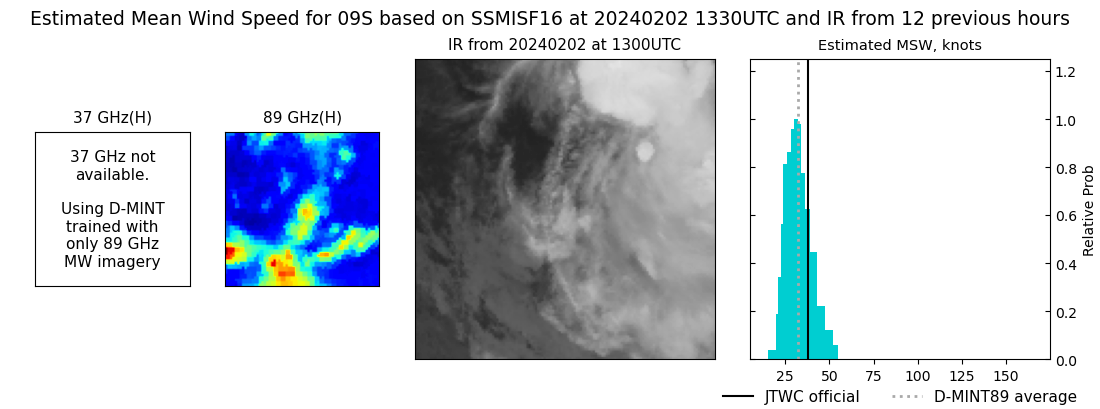 |
| 20240202 | 1135 UTC | SSMISF18 | 997 hPa | 32 kts | 28 kts | 36 kts | 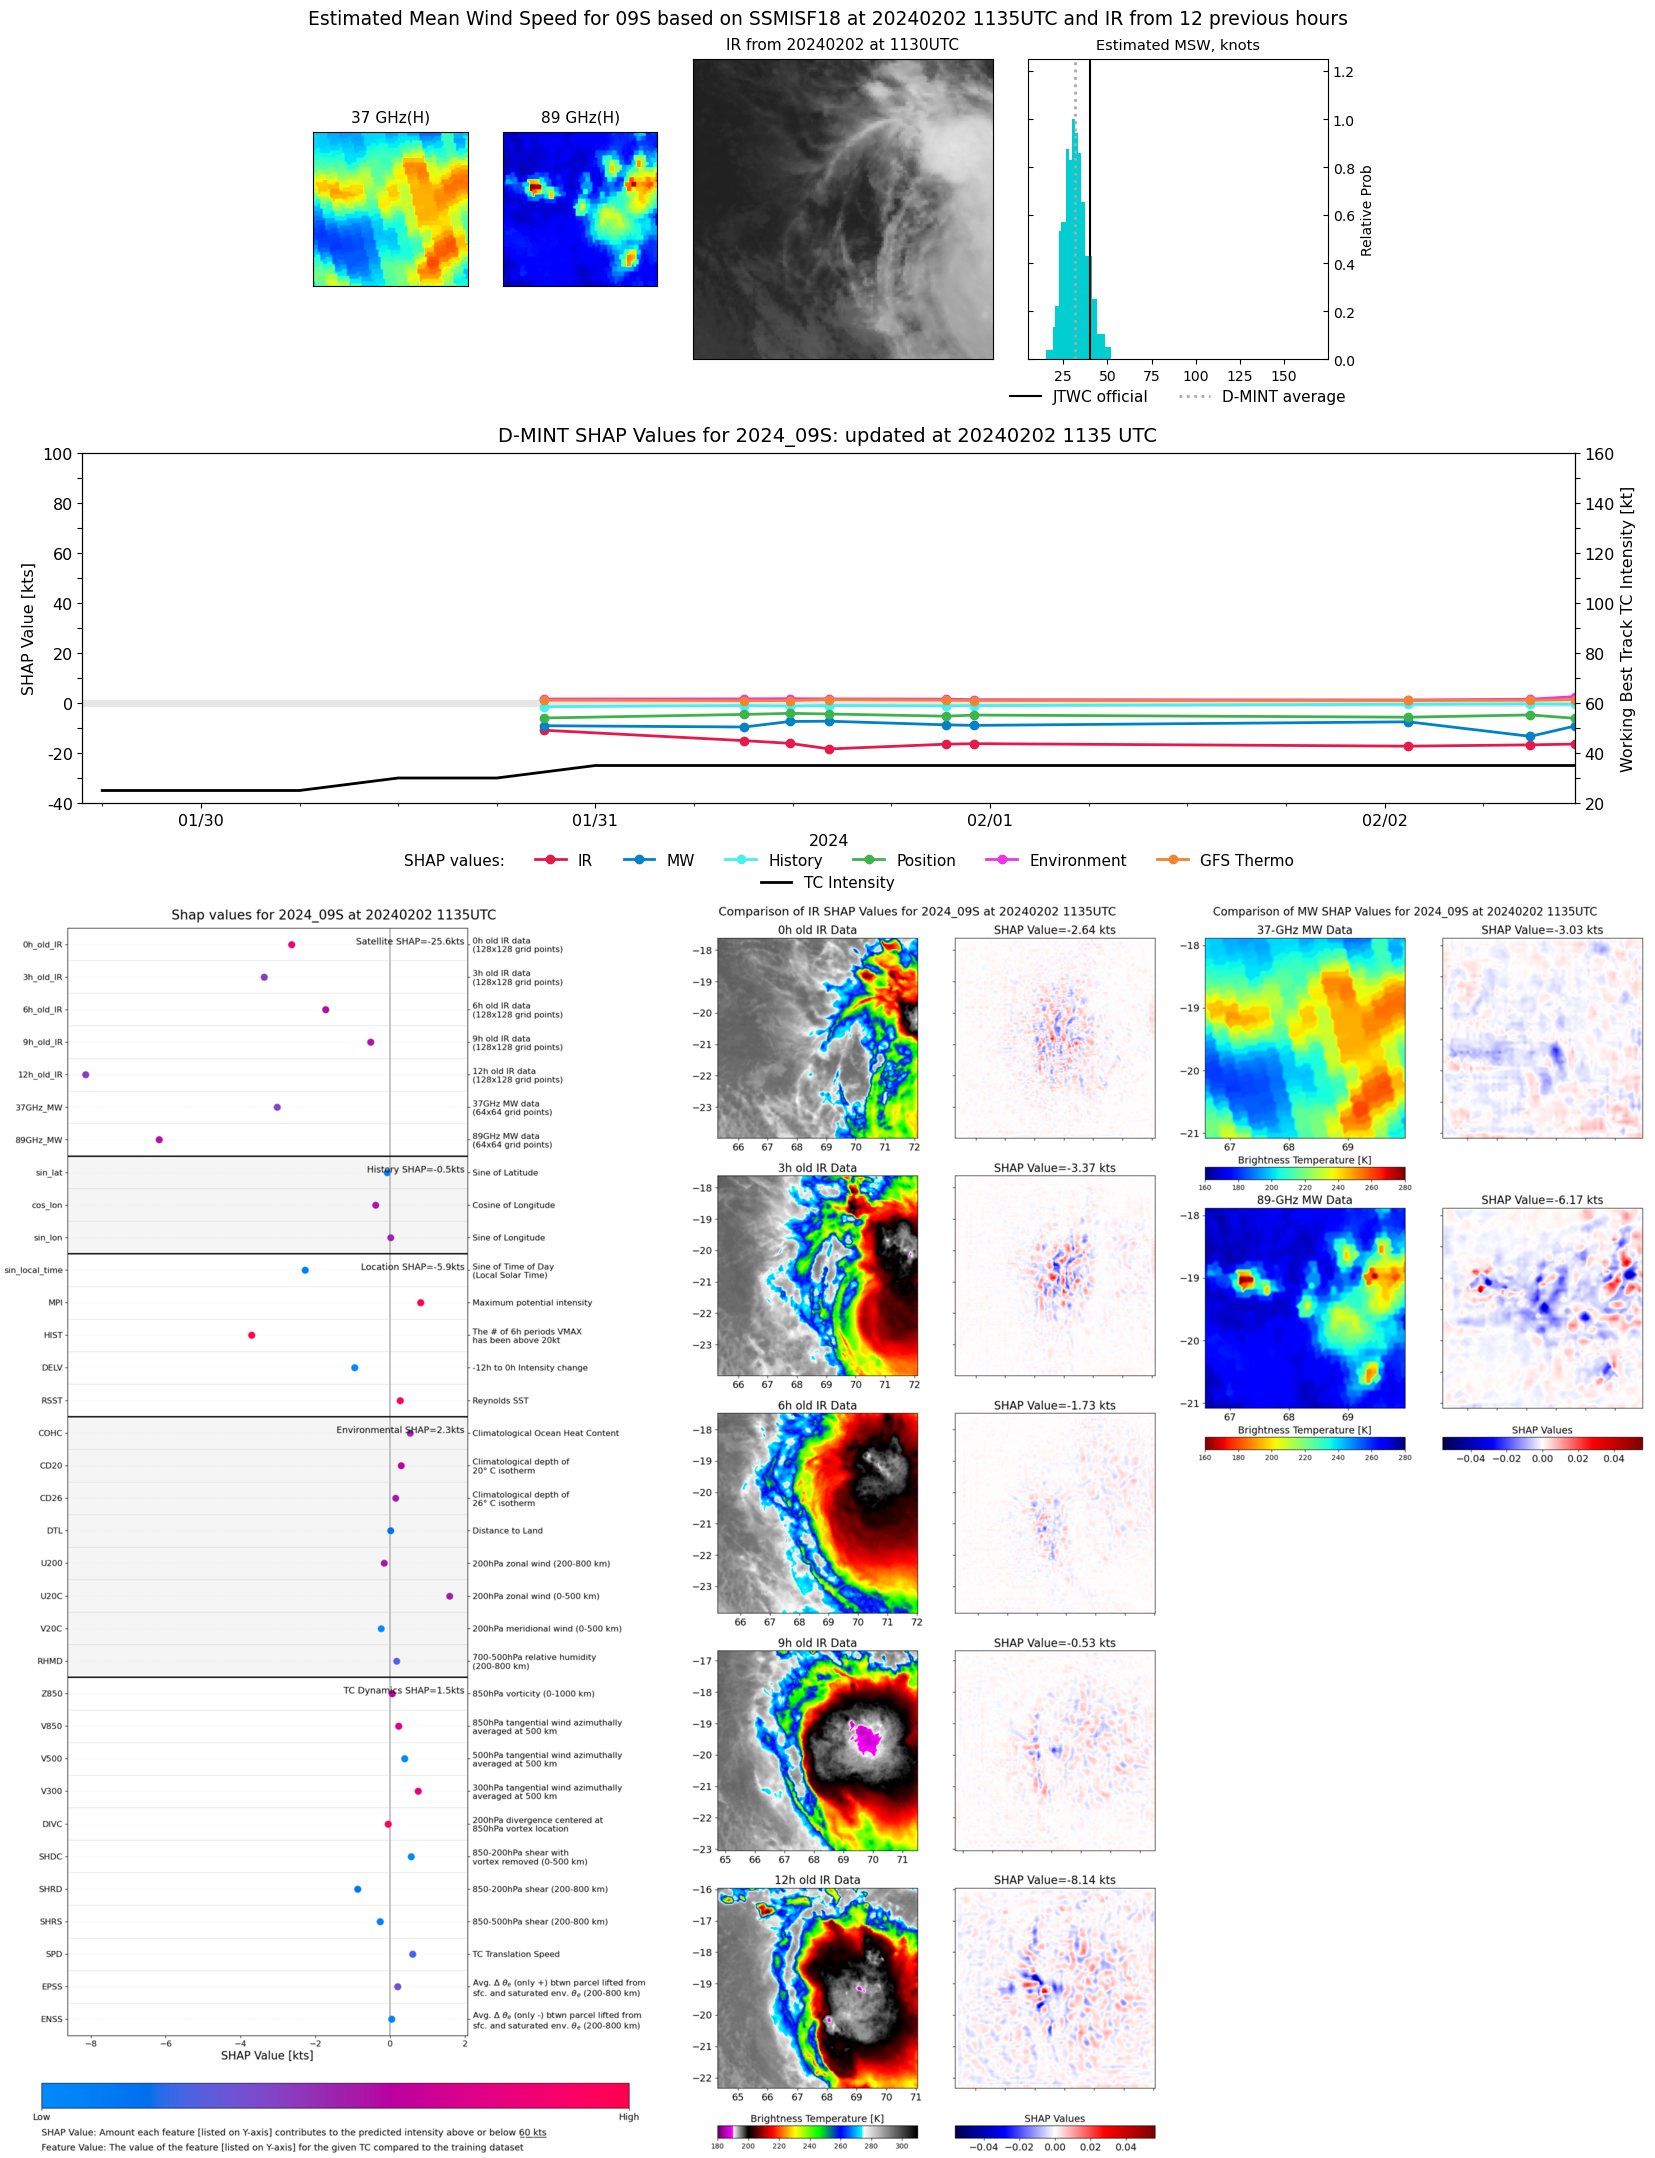 |
| 20240202 | 0852 UTC | AMSR2 | 1003 hPa | 28 kts | 25 kts | 31 kts | 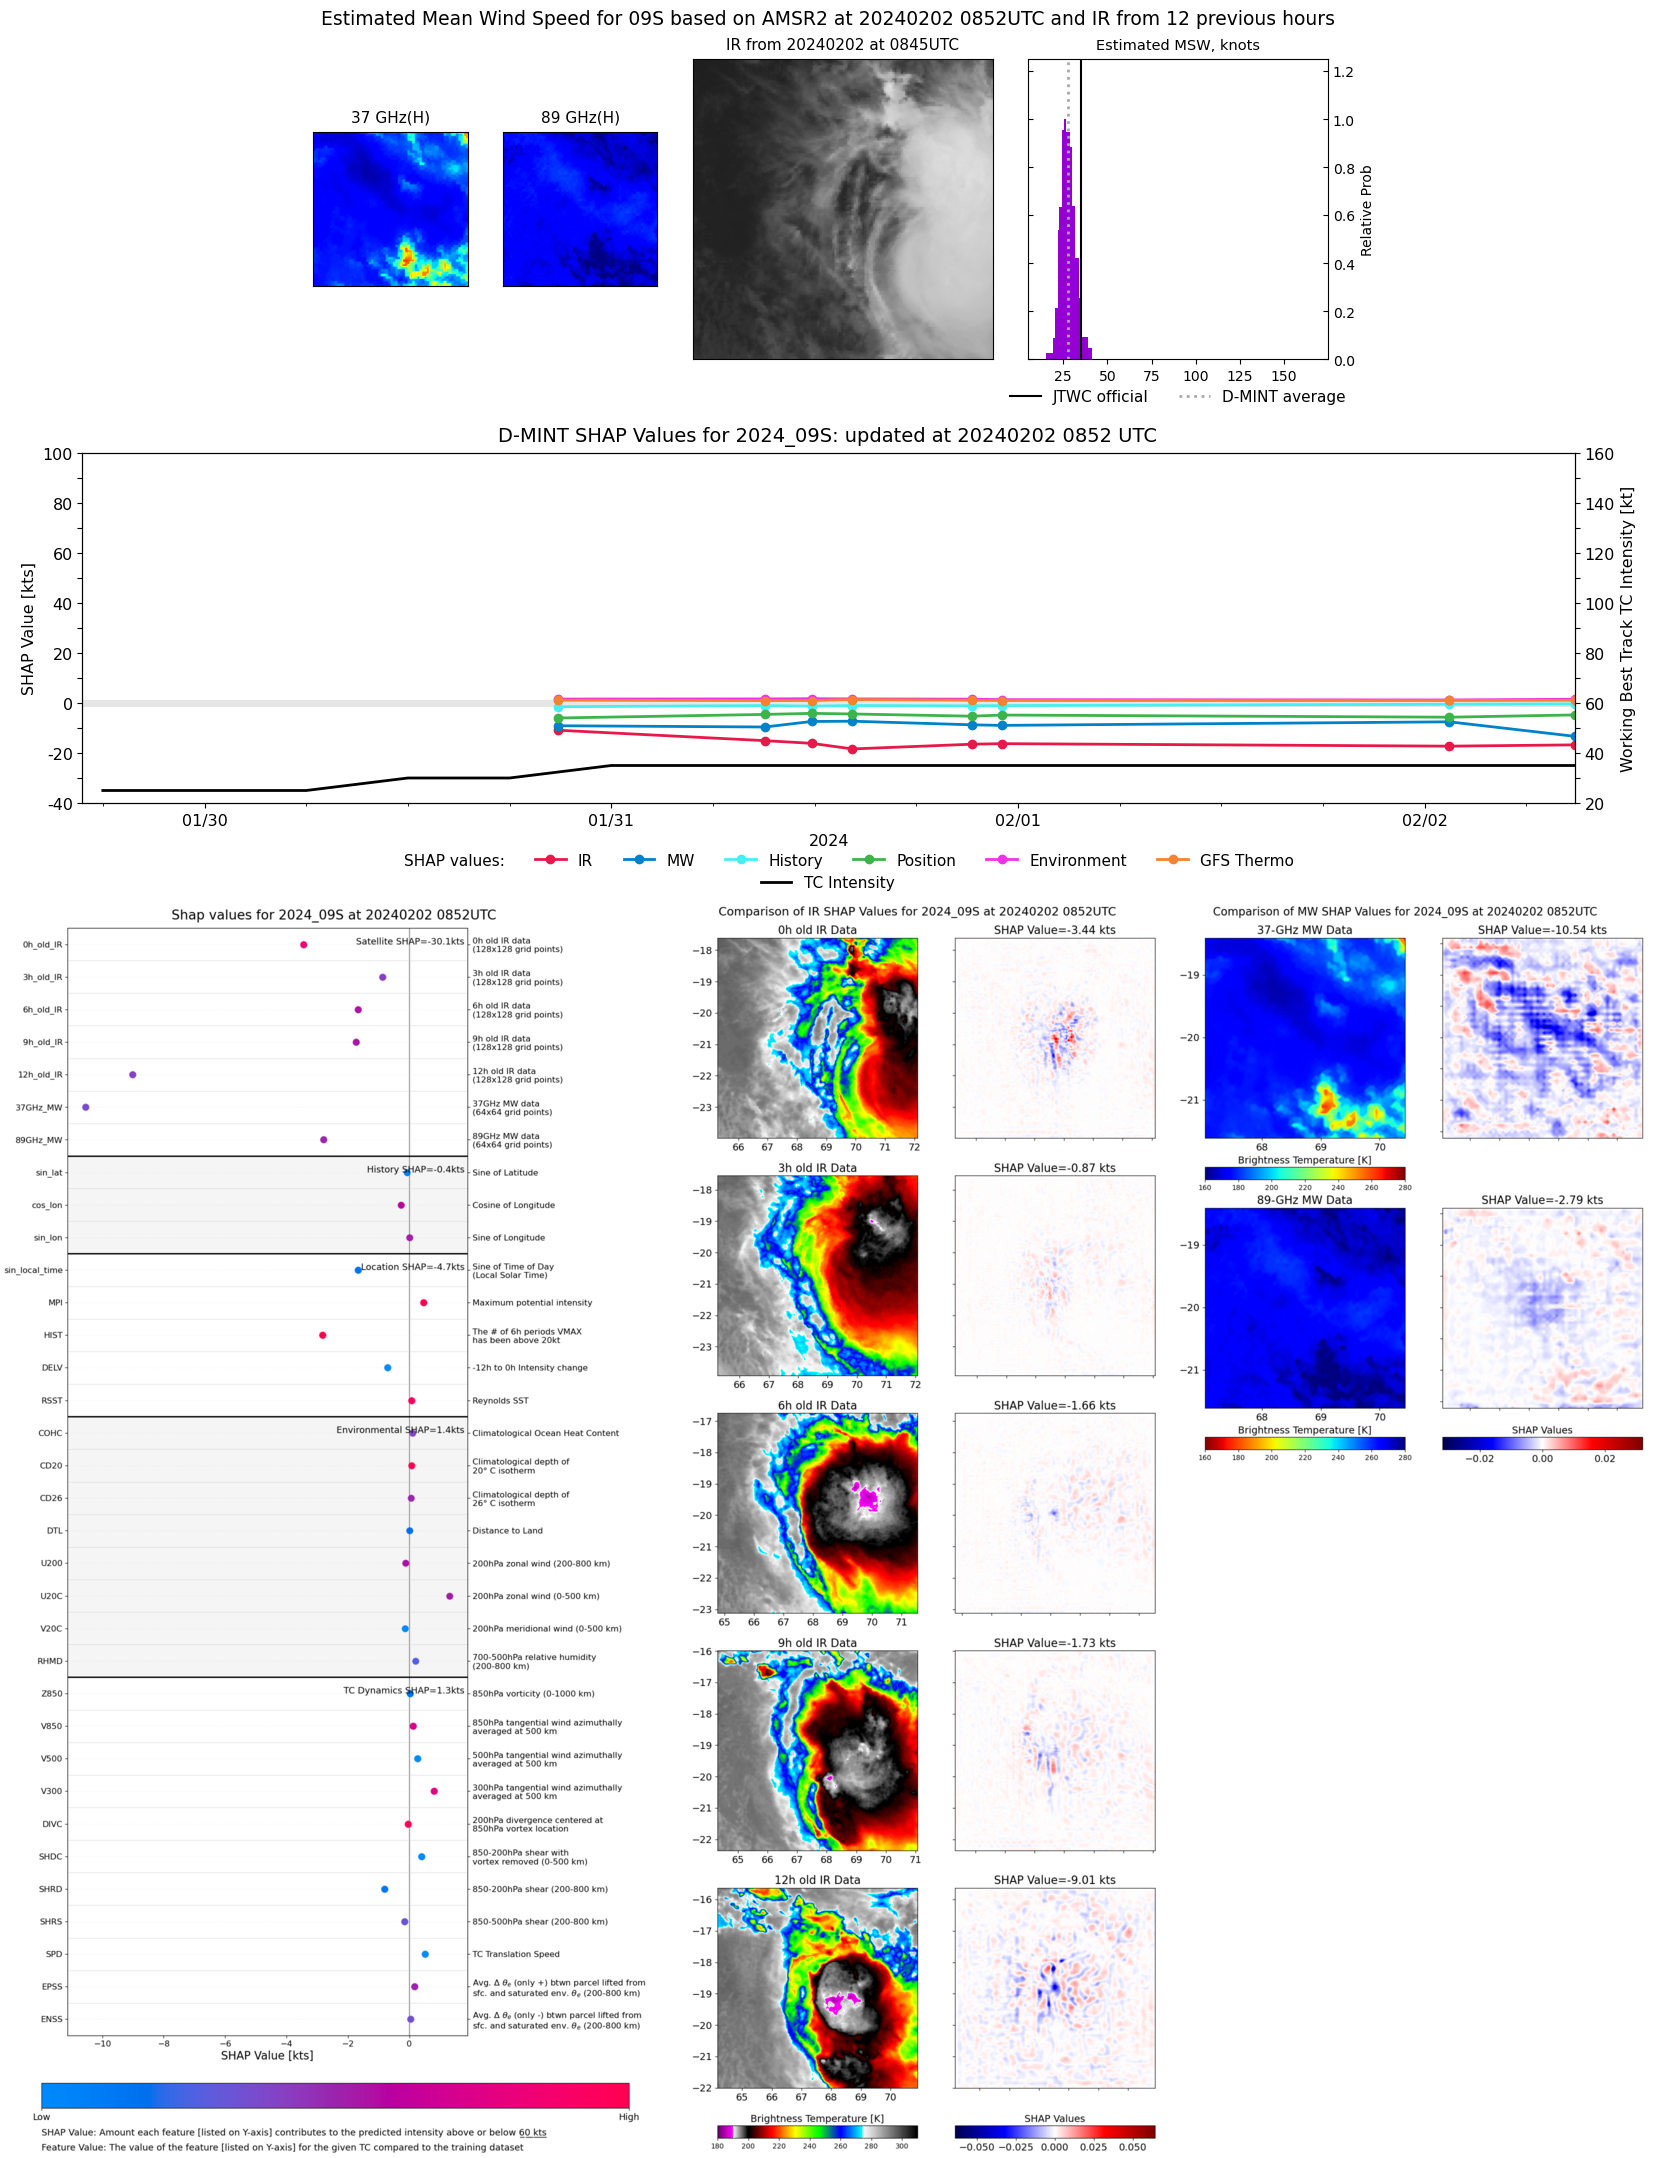 |
| 20240202 | 0127 UTC | SSMISF17 | 1003 hPa | 31 kts | 28 kts | 35 kts | 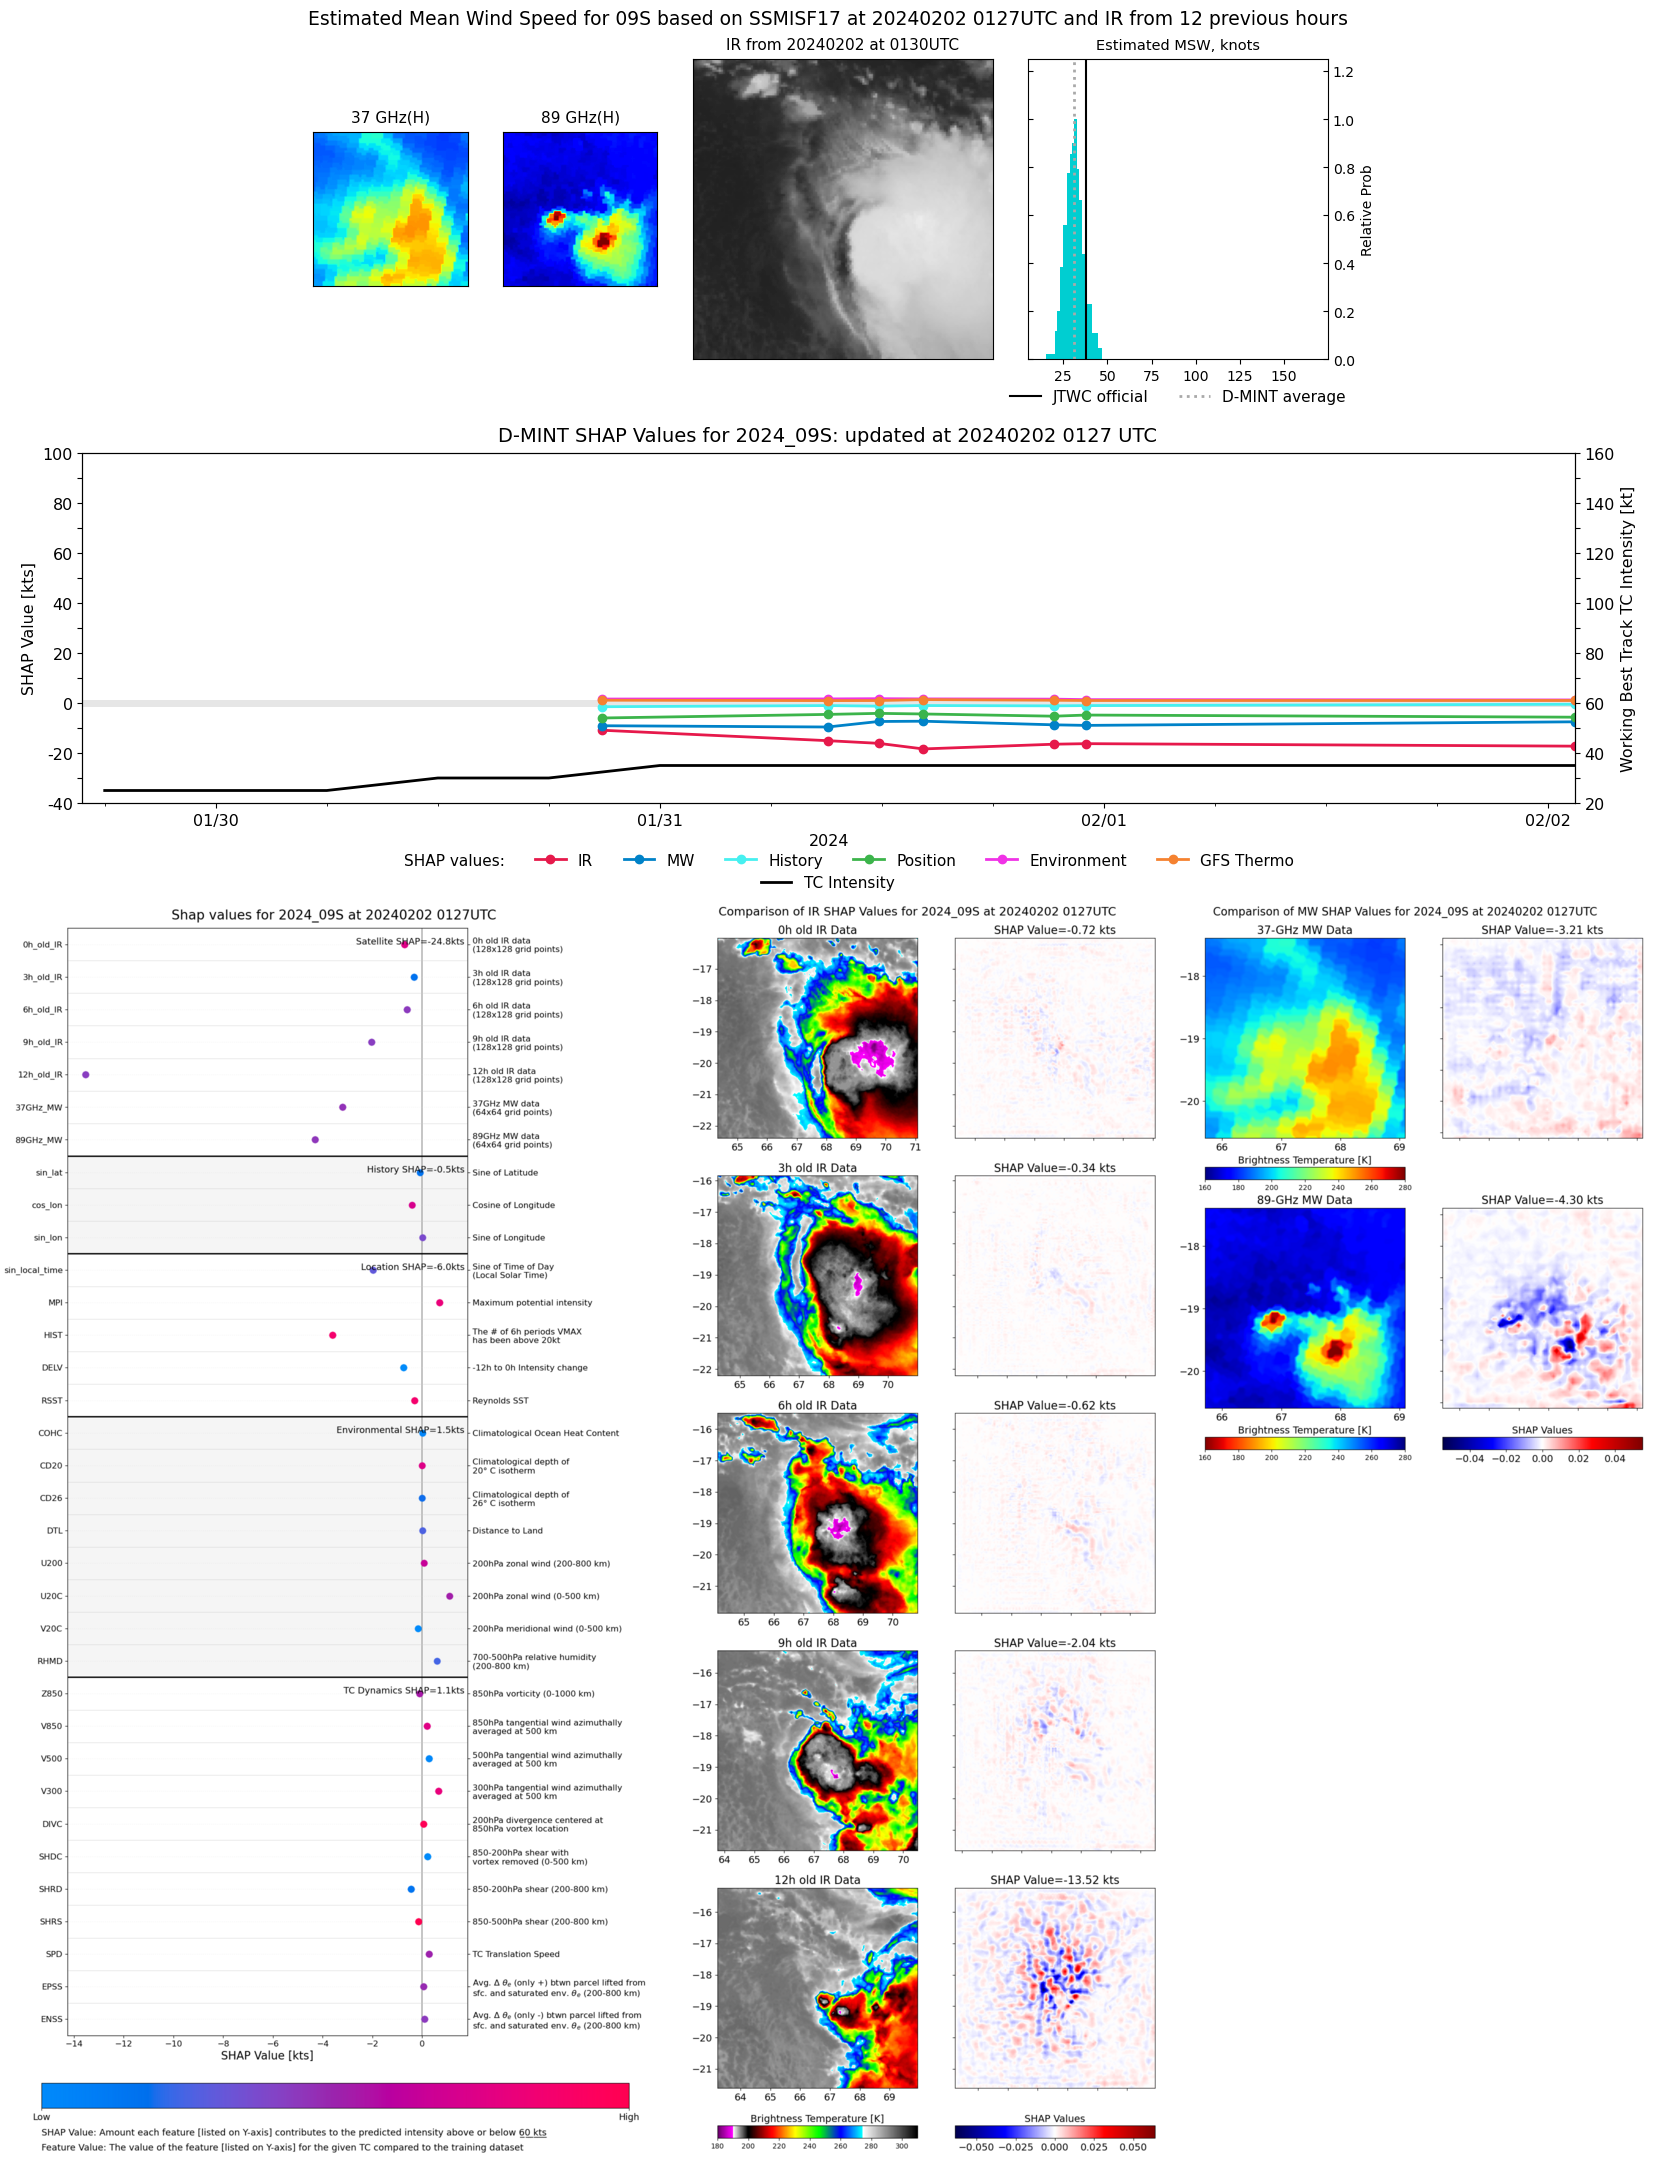 |
| 20240202 | 0056 UTC | SSMISF16 | 1004 hPa | 28 kts | 25 kts | 31 kts | 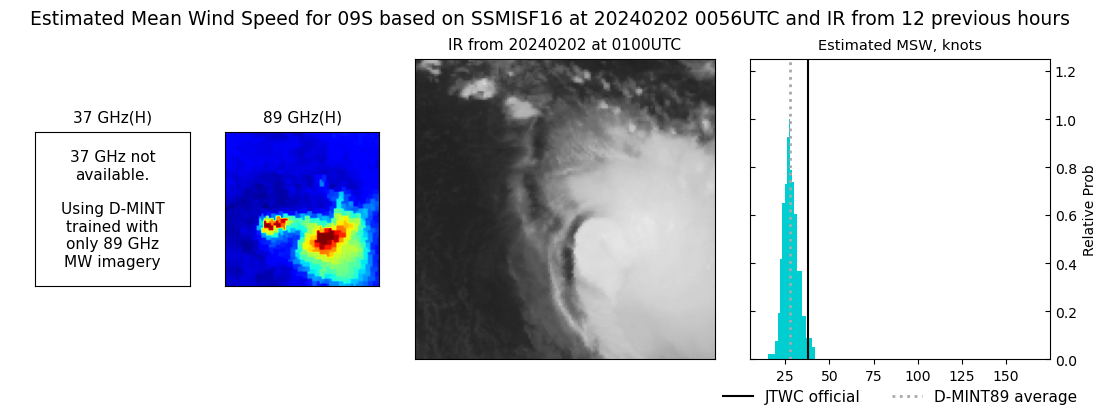 |
| 20240131 | 2302 UTC | SSMISF18 | 999 hPa | 31 kts | 28 kts | 34 kts | 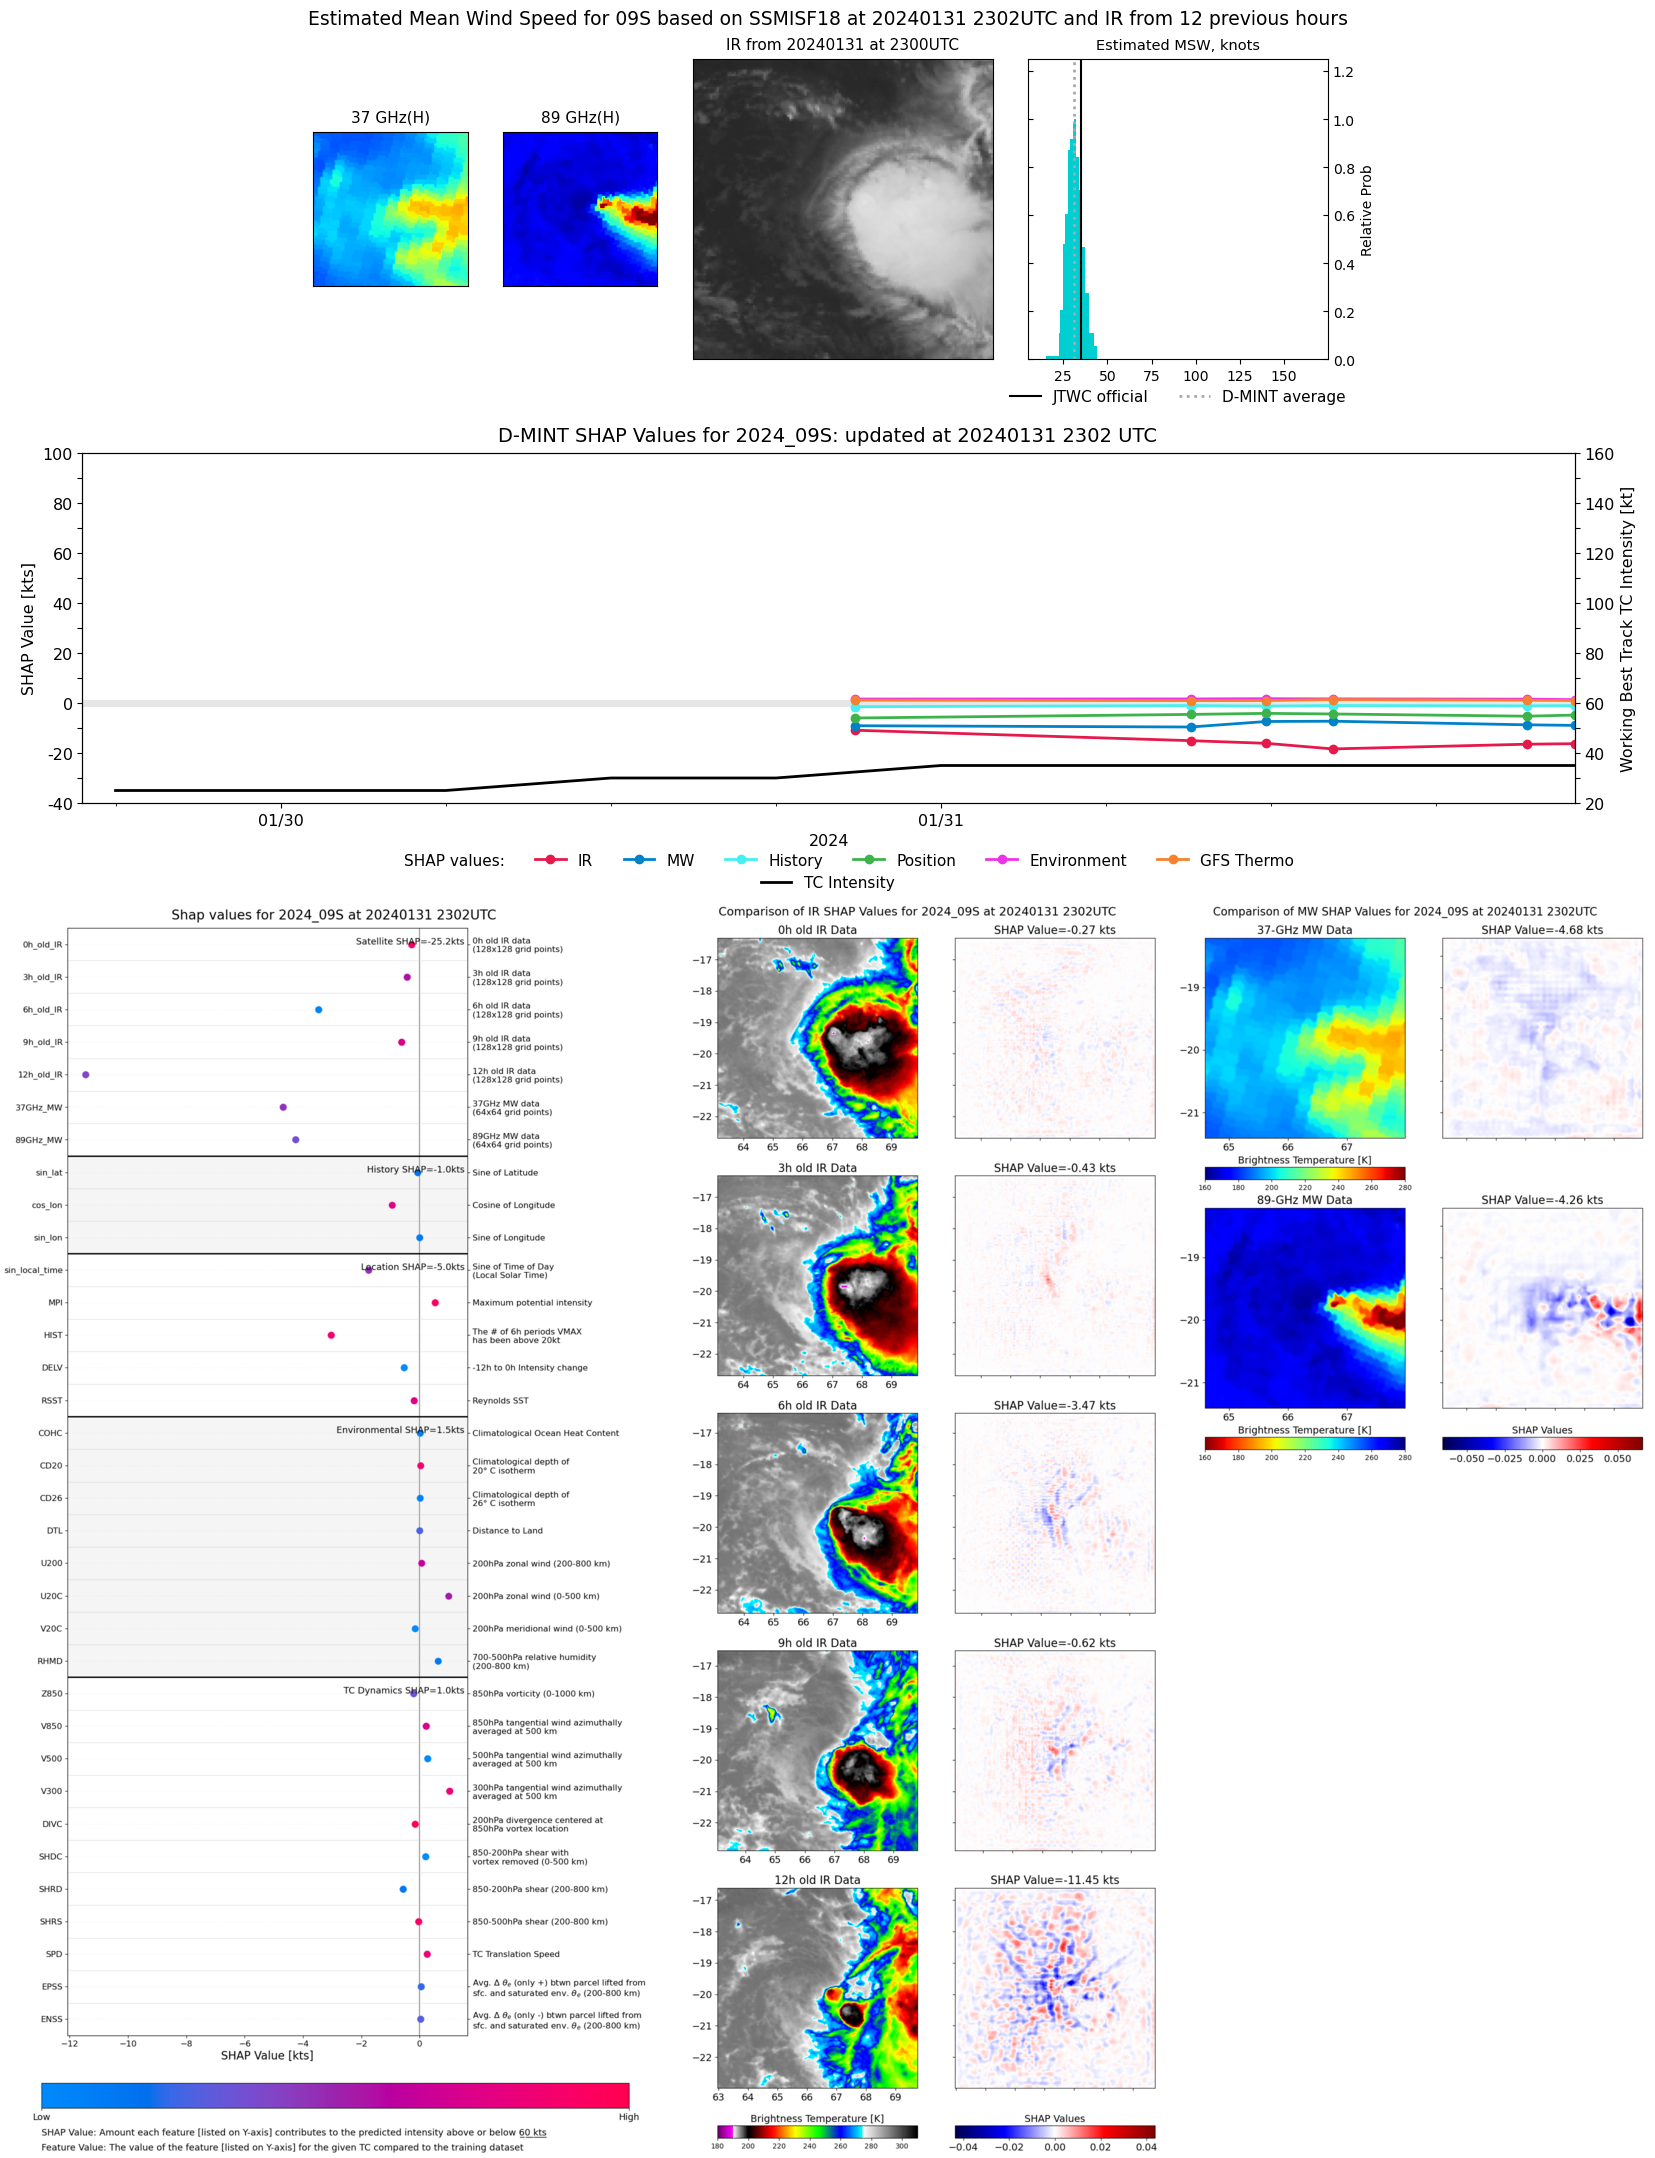 |
| 20240131 | 2118 UTC | GMI | 999 hPa | 31 kts | 29 kts | 34 kts | 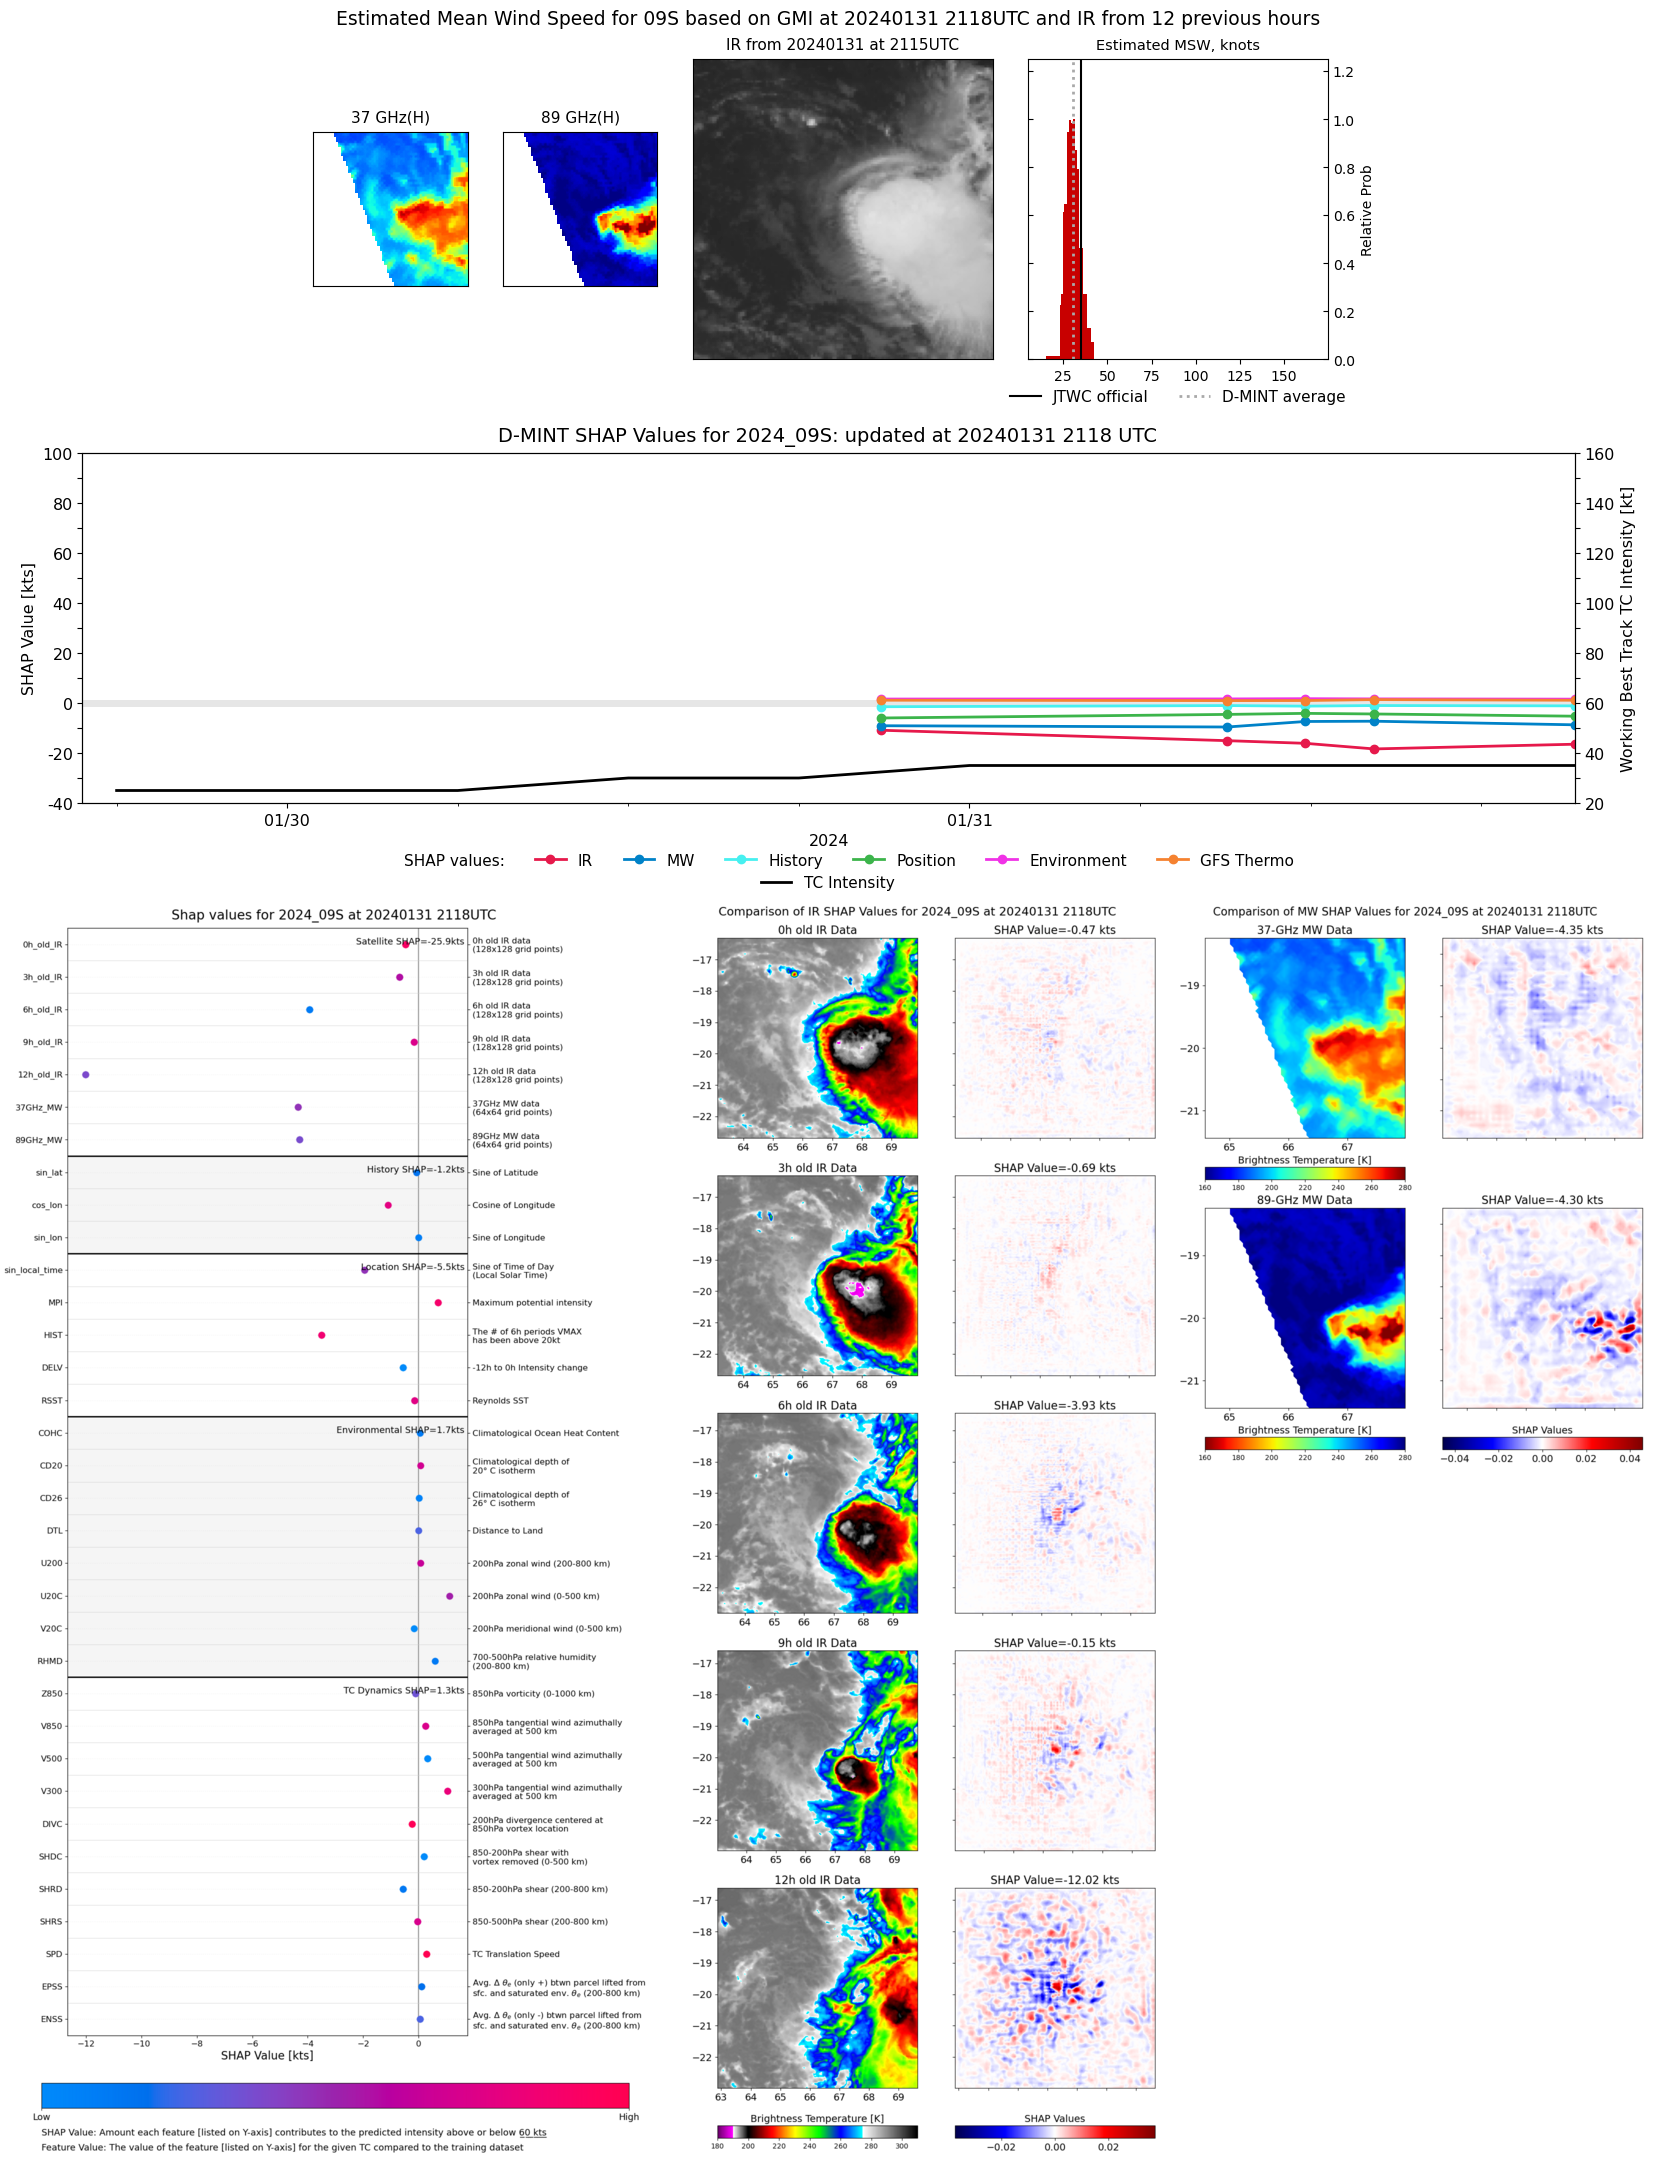 |
| 20240131 | 1414 UTC | SSMISF17 | 1000 hPa | 32 kts | 29 kts | 35 kts | 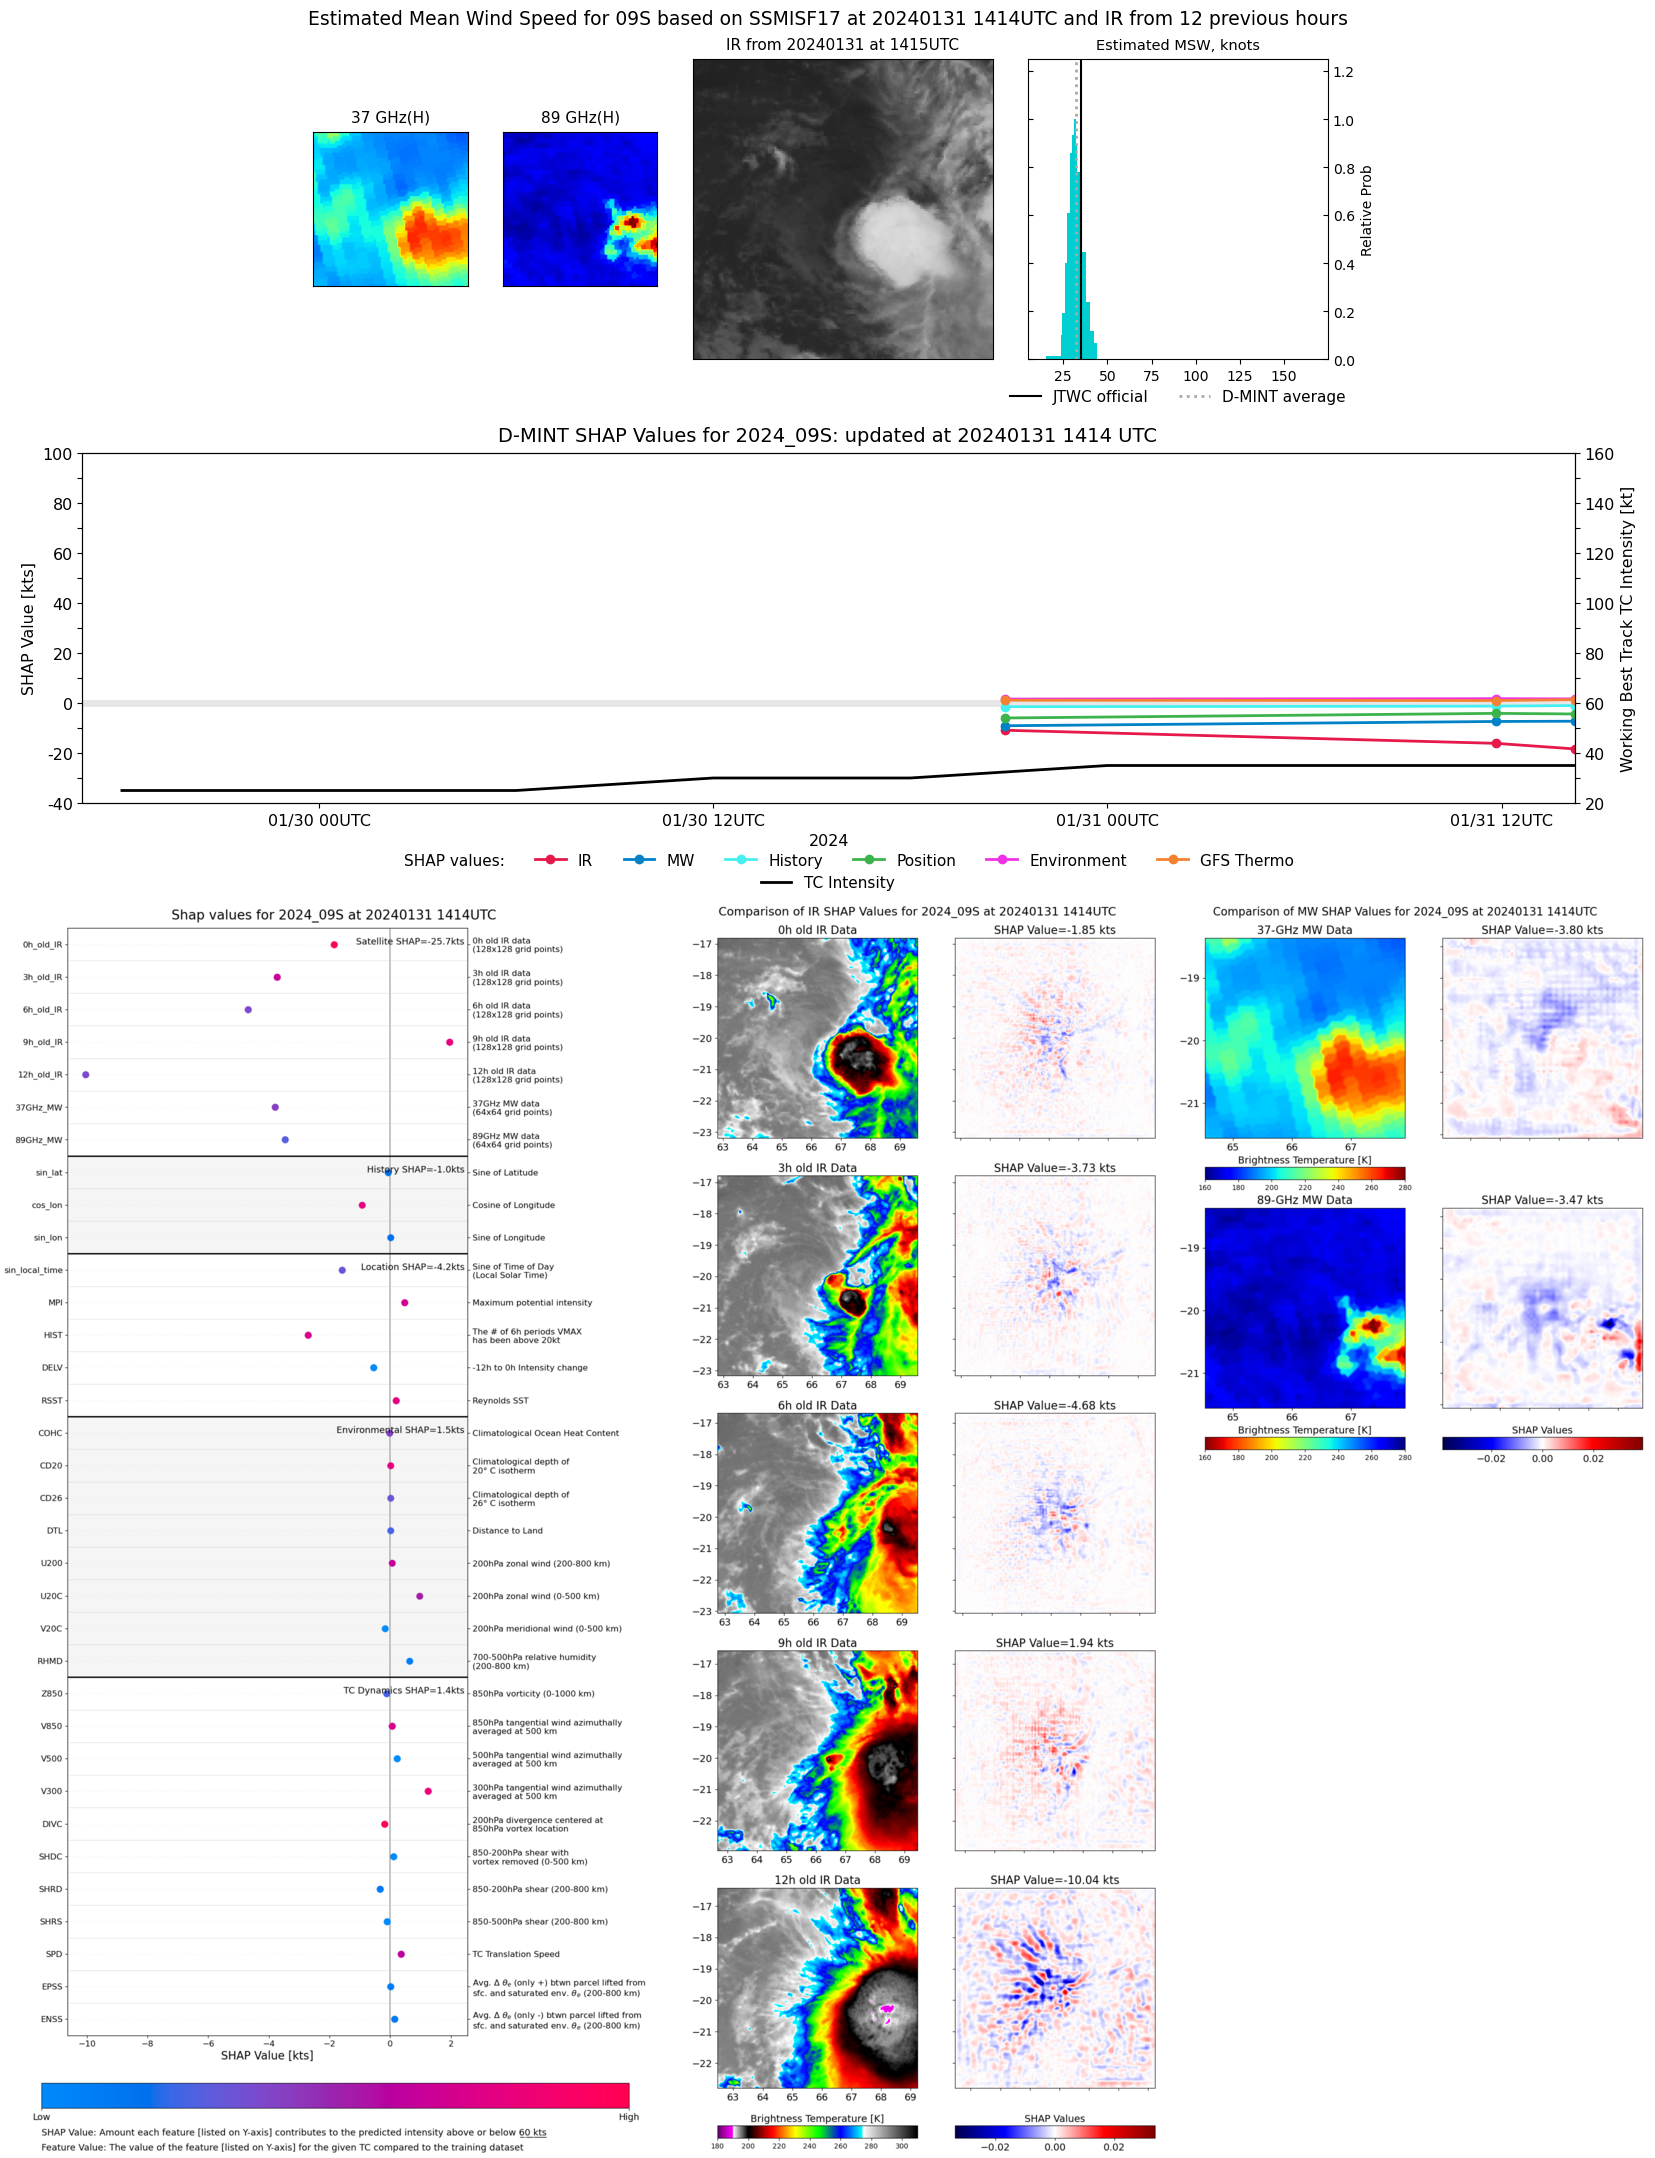 |
| 20240131 | 1343 UTC | SSMISF16 | 1002 hPa | 29 kts | 27 kts | 32 kts | 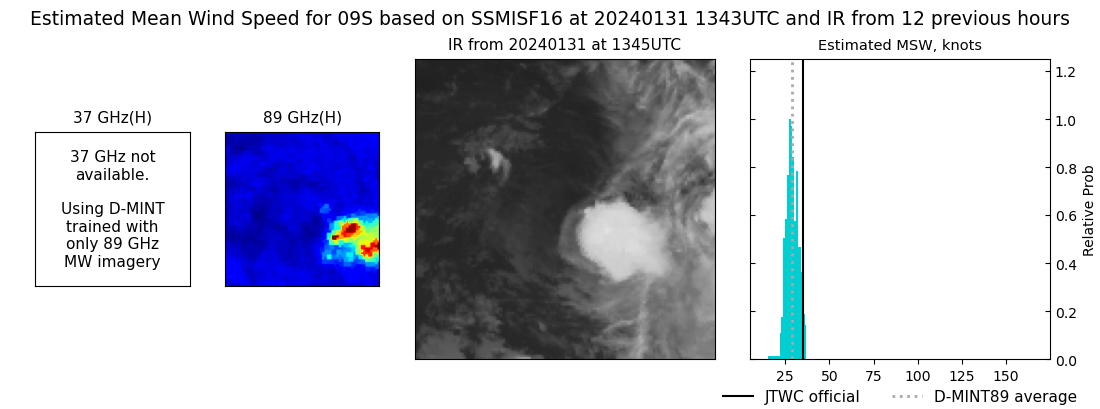 |
| 20240131 | 1149 UTC | SSMISF18 | 1002 hPa | 34 kts | 30 kts | 38 kts | 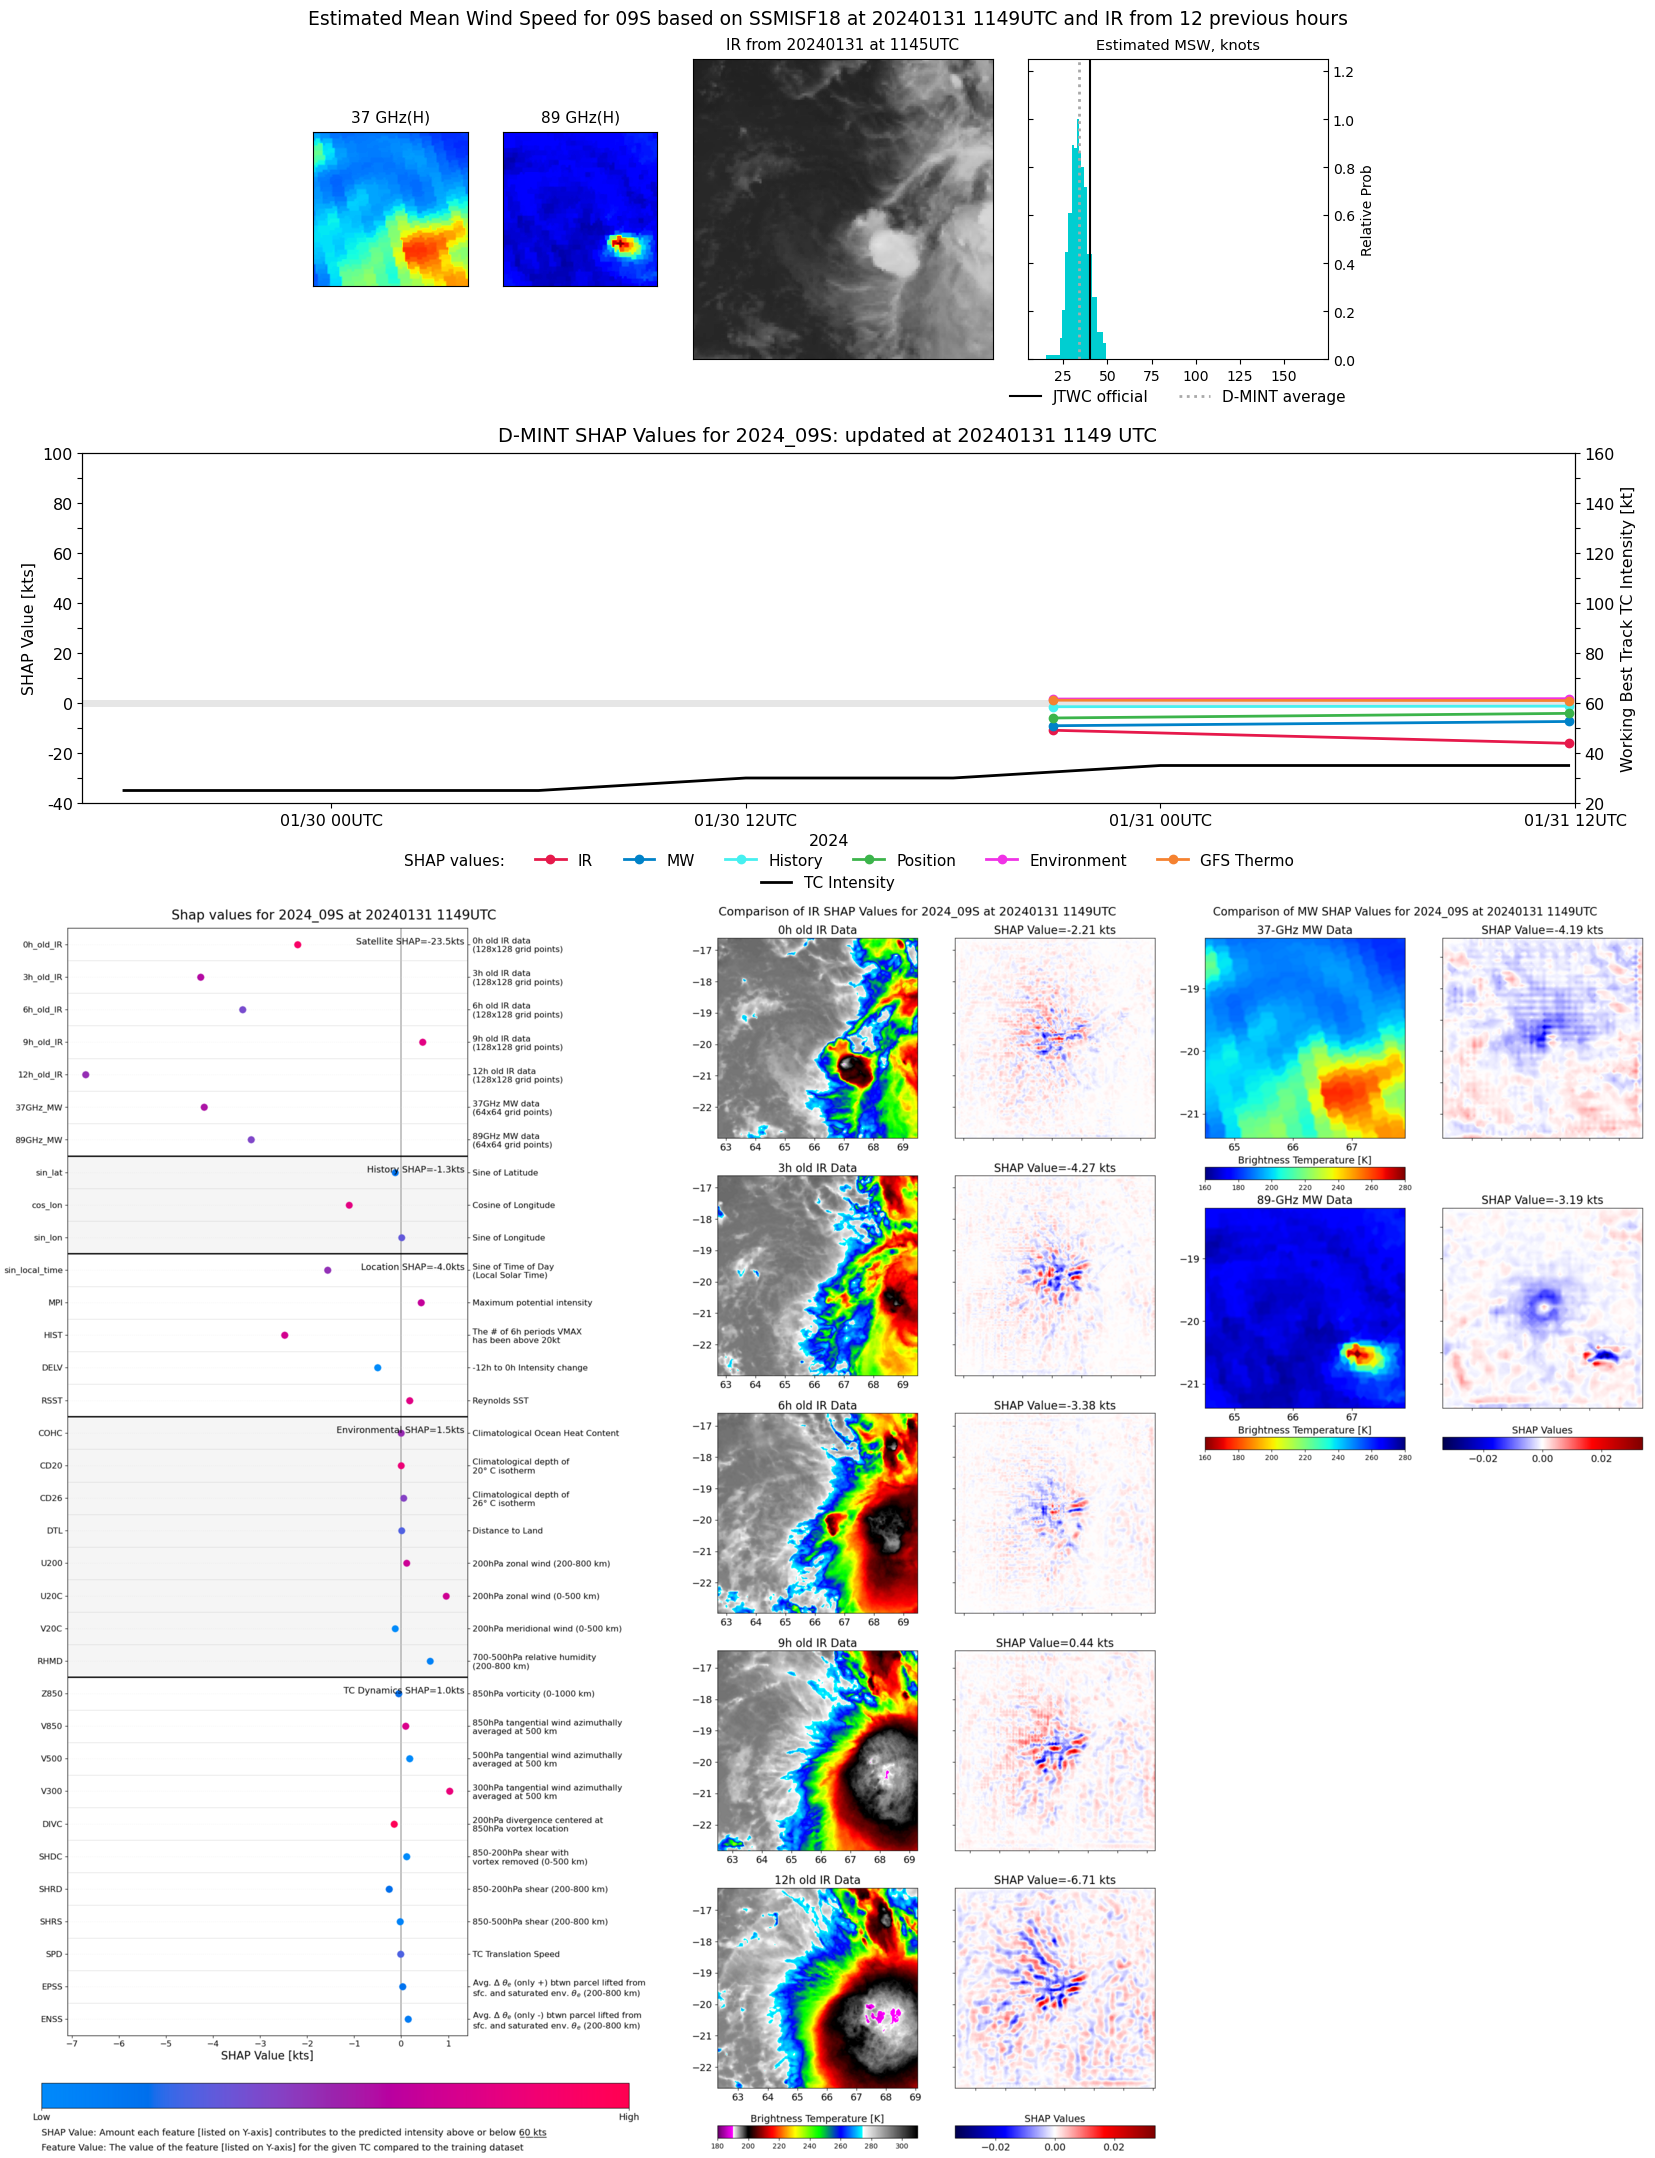 |
| 20240131 | 0904 UTC | AMSR2 | 1001 hPa | 32 kts | 29 kts | 36 kts | 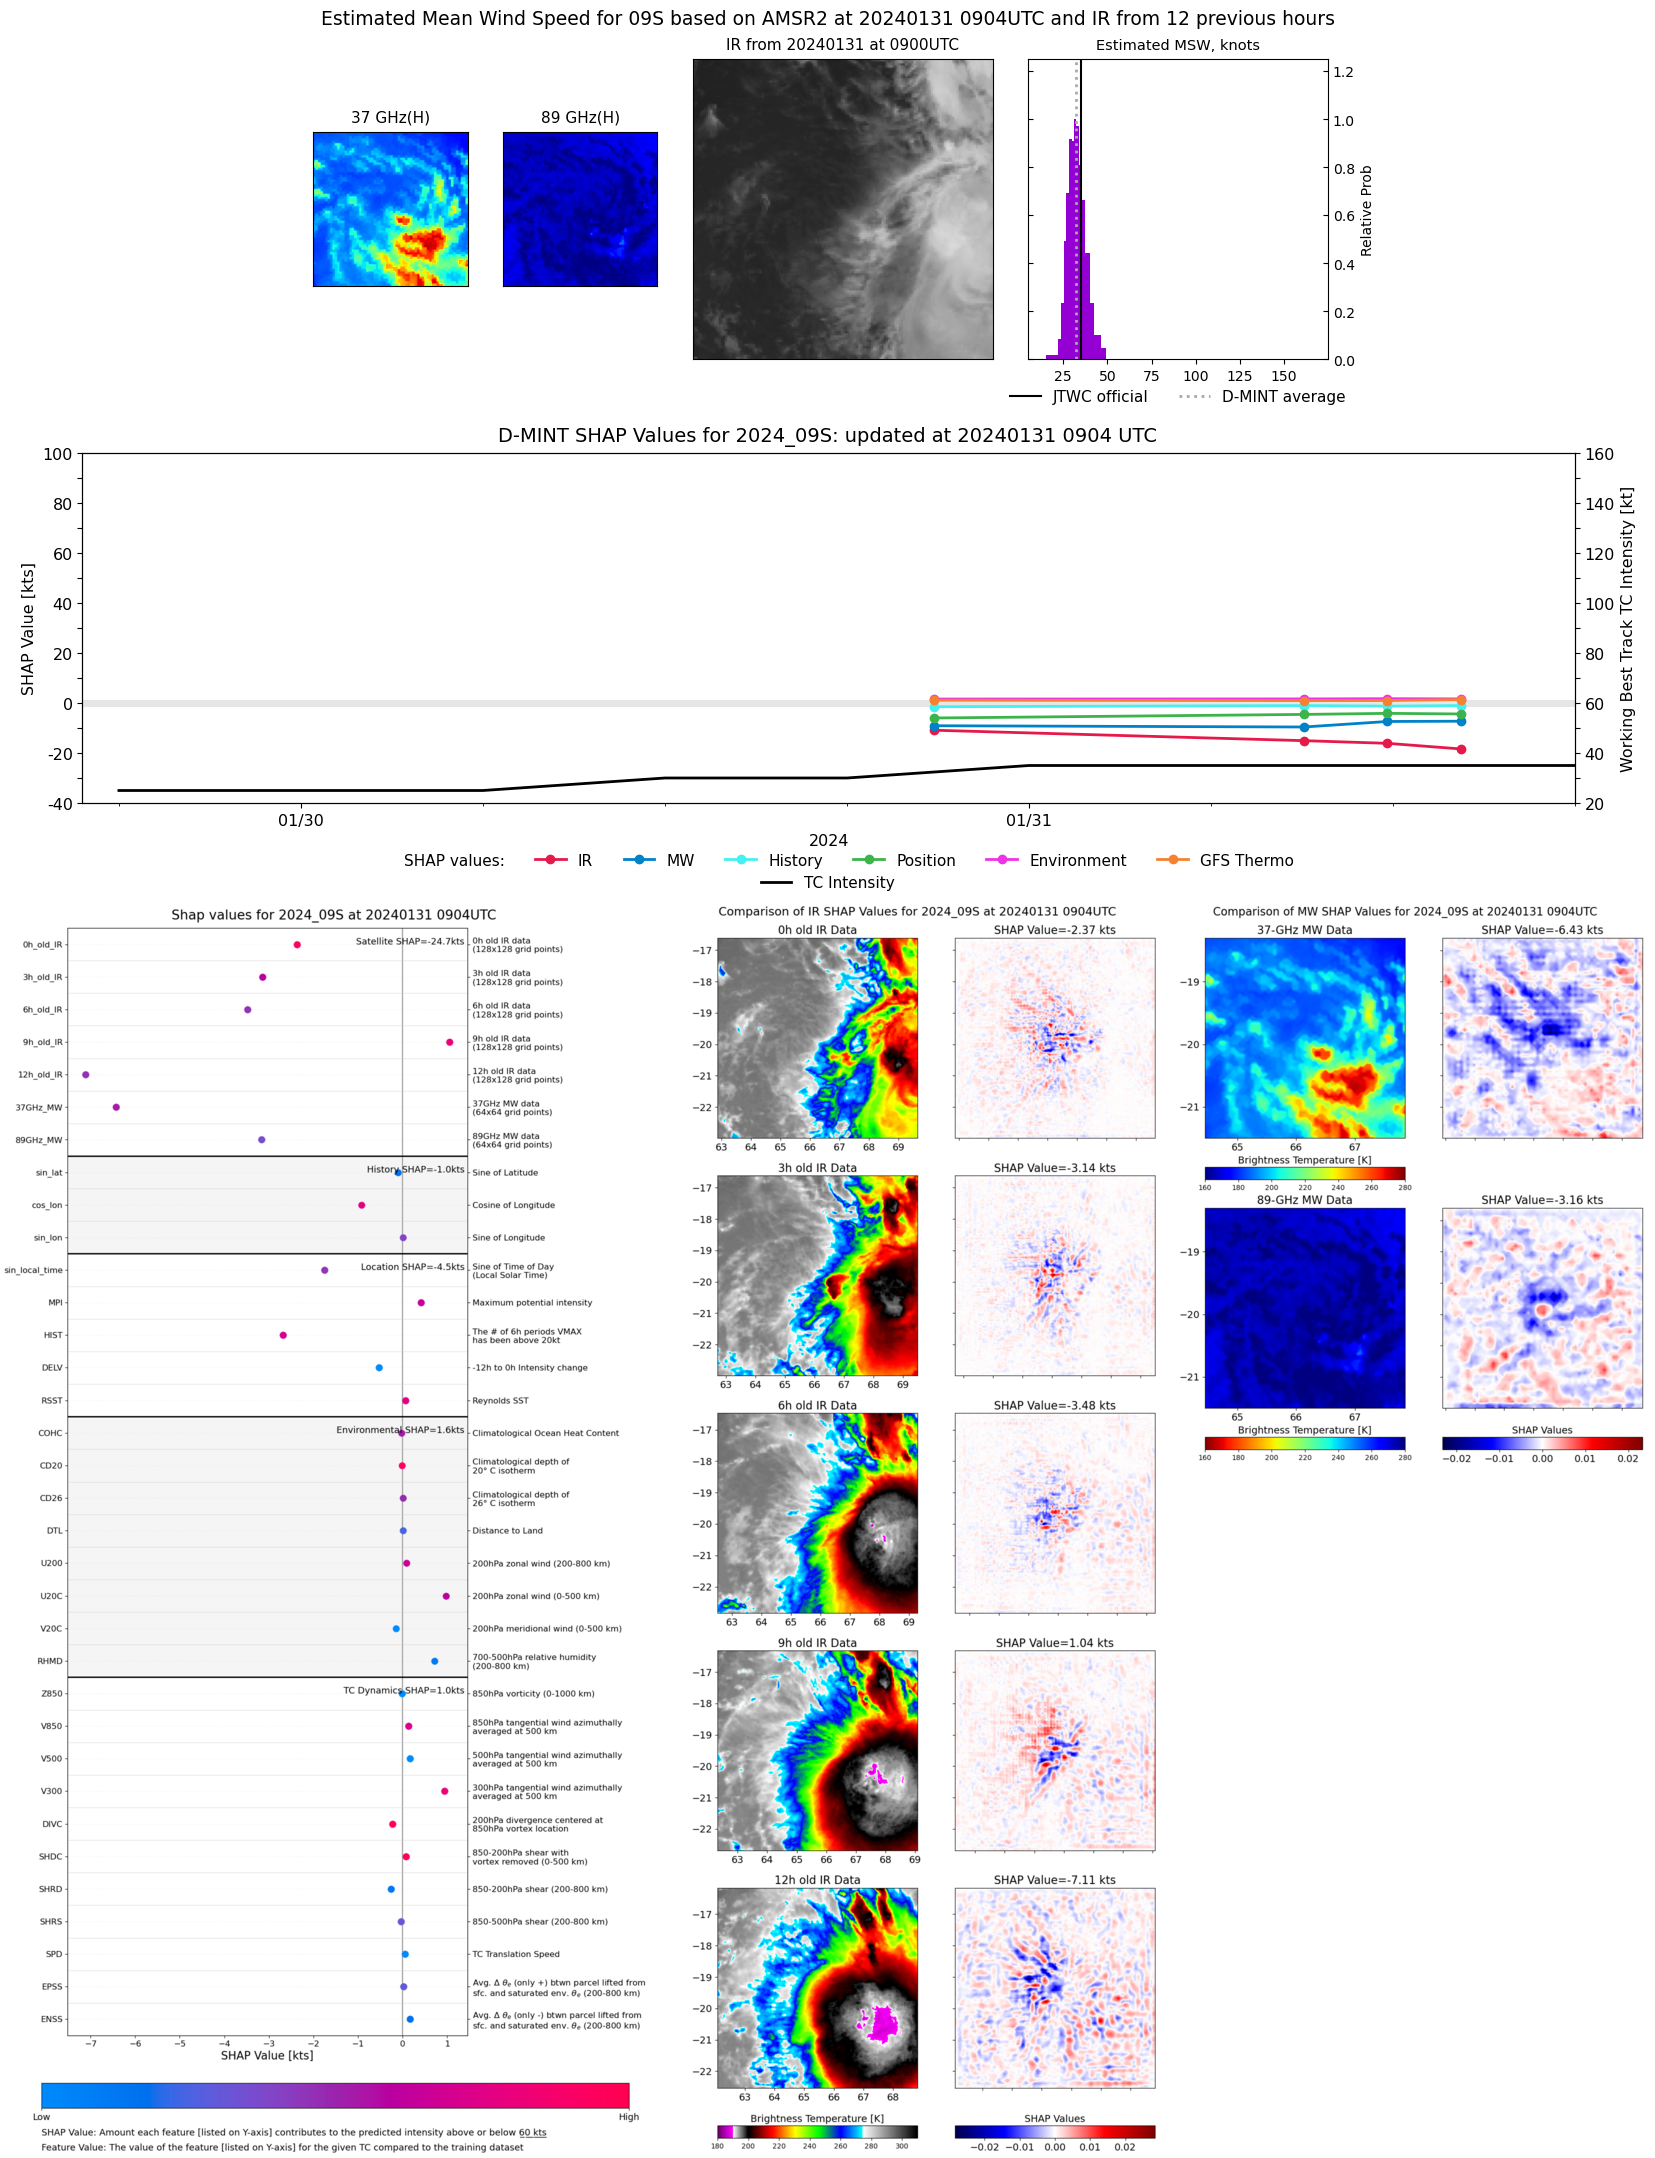 |
| 20240130 | 2053 UTC | AMSR2 | 998 hPa | 35 kts | 32 kts | 39 kts | 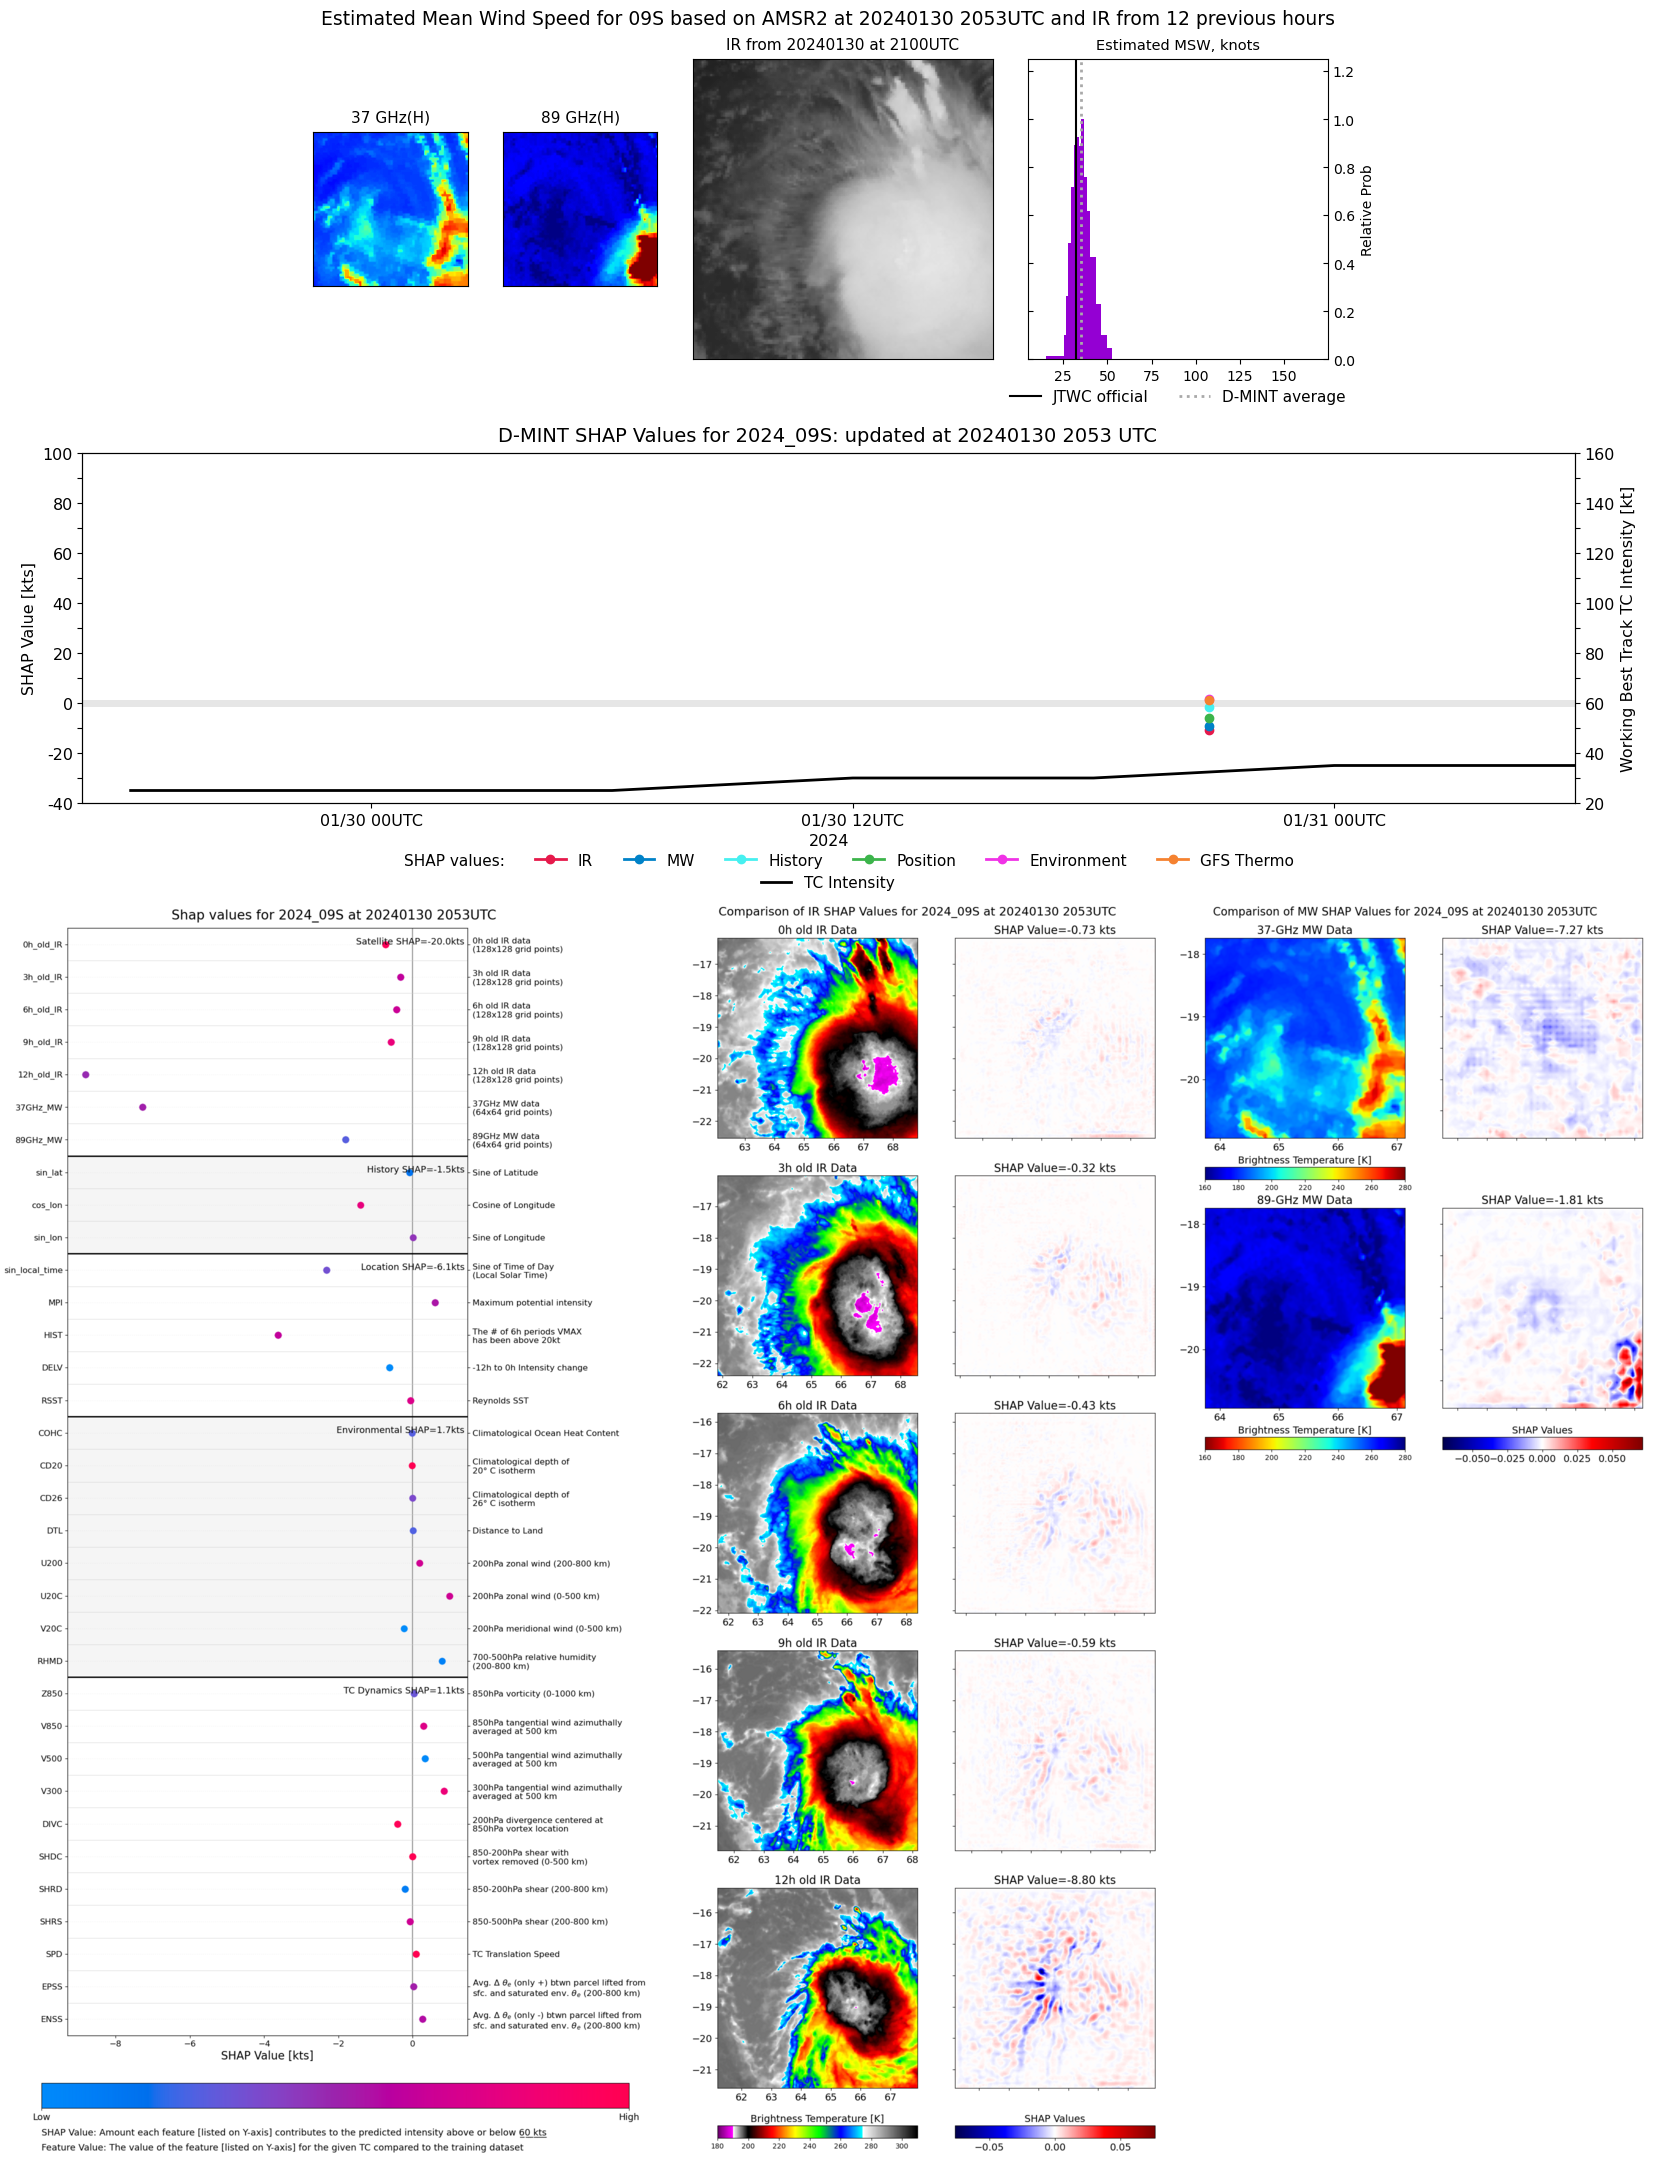 |