|
||

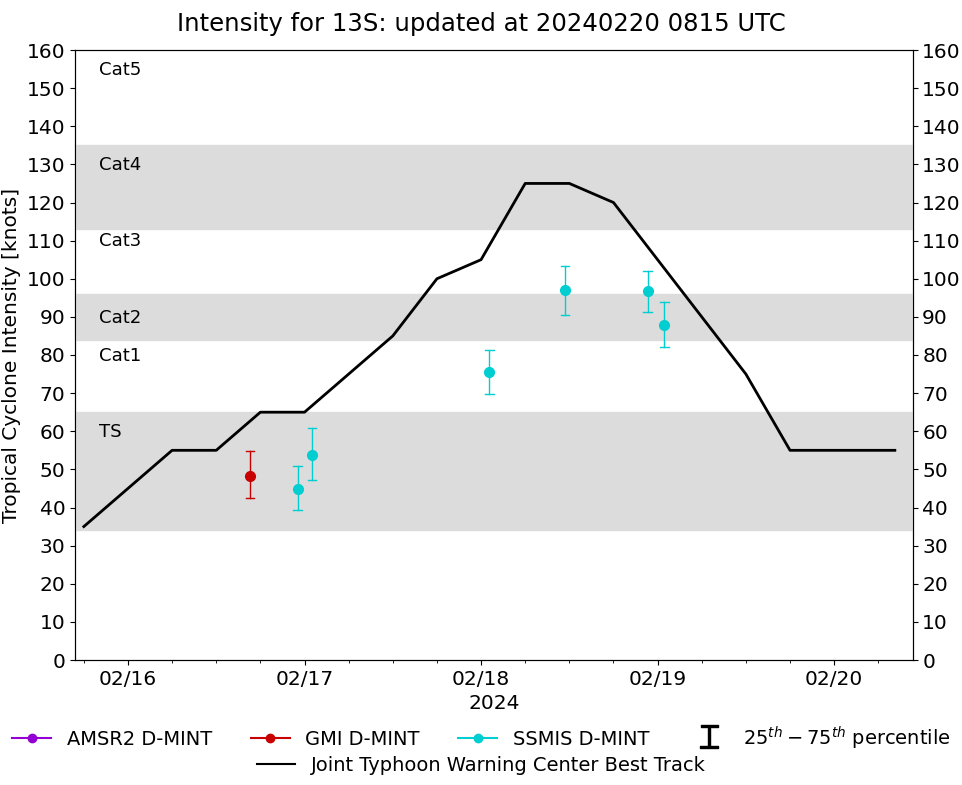 |
D-MINT HISTORY FILE for 2024_13S
| Date | Time | MW Sensor | MSLP | Vmax (30th-70th percentile average) | Vmax 25th percentile | Vmax 75th percentile | Image |
| 20240219 | 0056 UTC | SSMISF17 | 963 hPa | 88 kts | 82 kts | 94 kts | 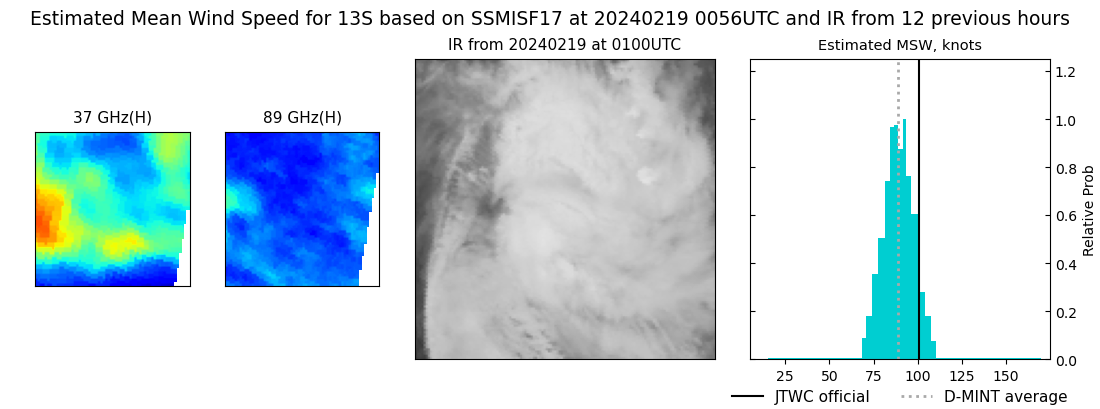 |
| 20240218 | 2239 UTC | SSMISF18 | 955 hPa | 97 kts | 91 kts | 102 kts | 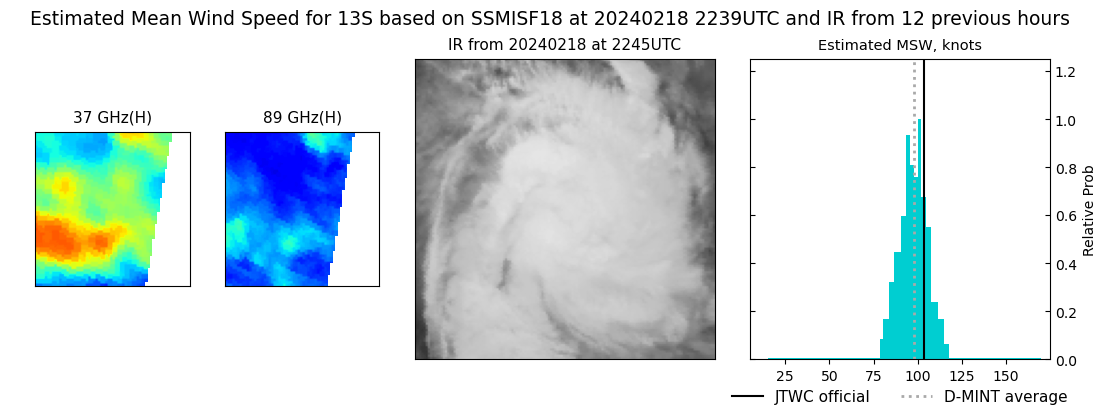 |
| 20240218 | 1125 UTC | SSMISF18 | 956 hPa | 97 kts | 90 kts | 103 kts | 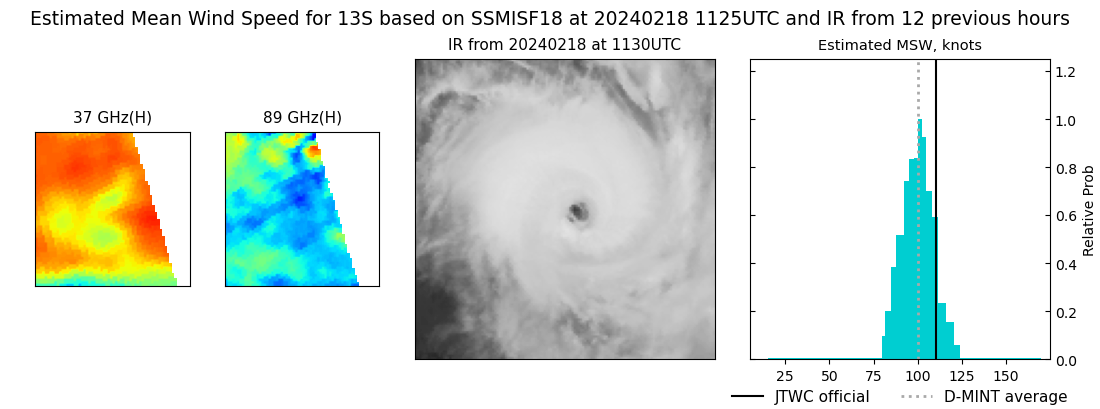 |
| 20240218 | 0108 UTC | SSMISF17 | 966 hPa | 75 kts | 70 kts | 81 kts | 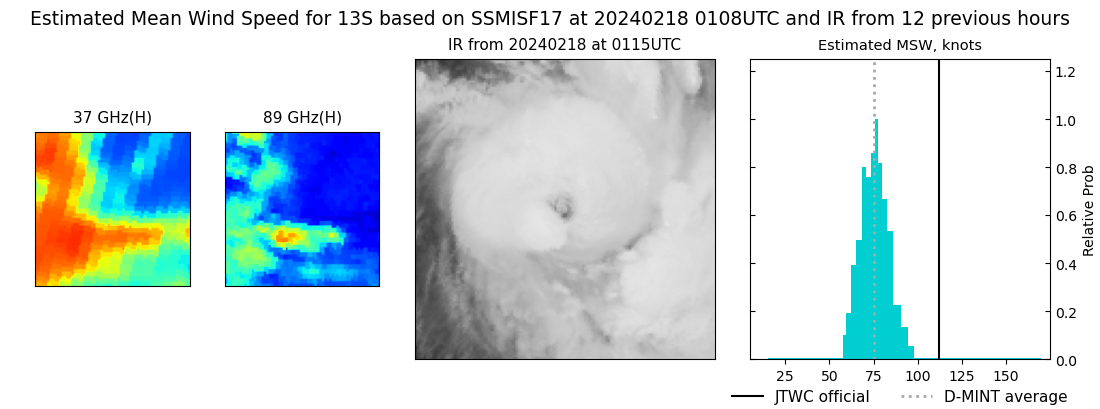 |
| 20240217 | 0059 UTC | SSMISF16 | 975 hPa | 54 kts | 47 kts | 61 kts | 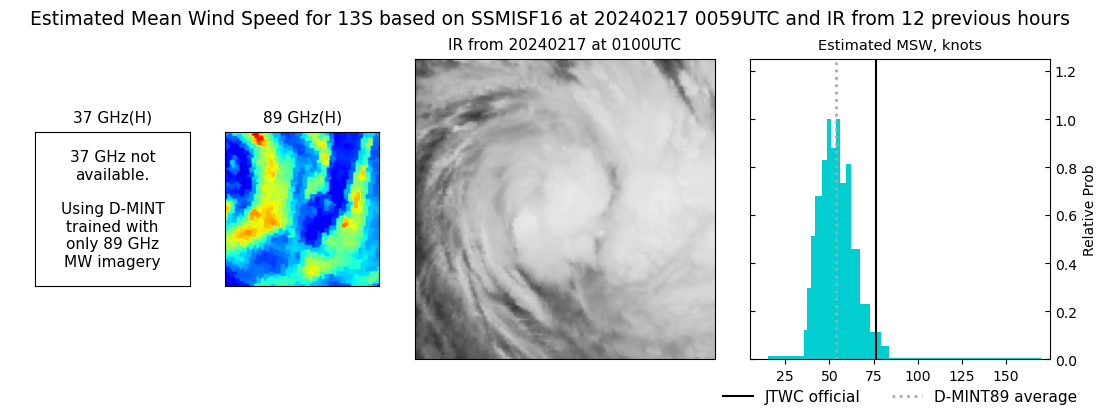 |
| 20240216 | 2304 UTC | SSMISF18 | 989 hPa | 45 kts | 39 kts | 51 kts | 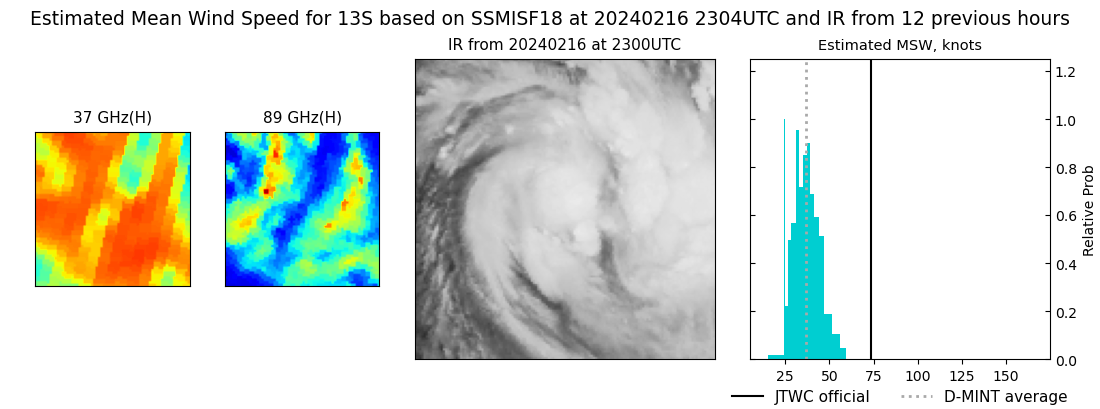 |
| 20240216 | 1633 UTC | GMI | 988 hPa | 48 kts | 42 kts | 55 kts | 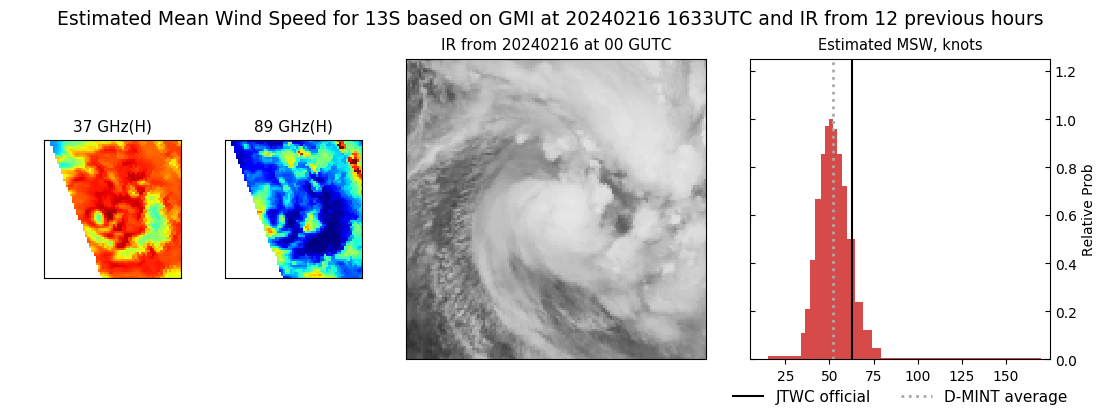 |