|
||

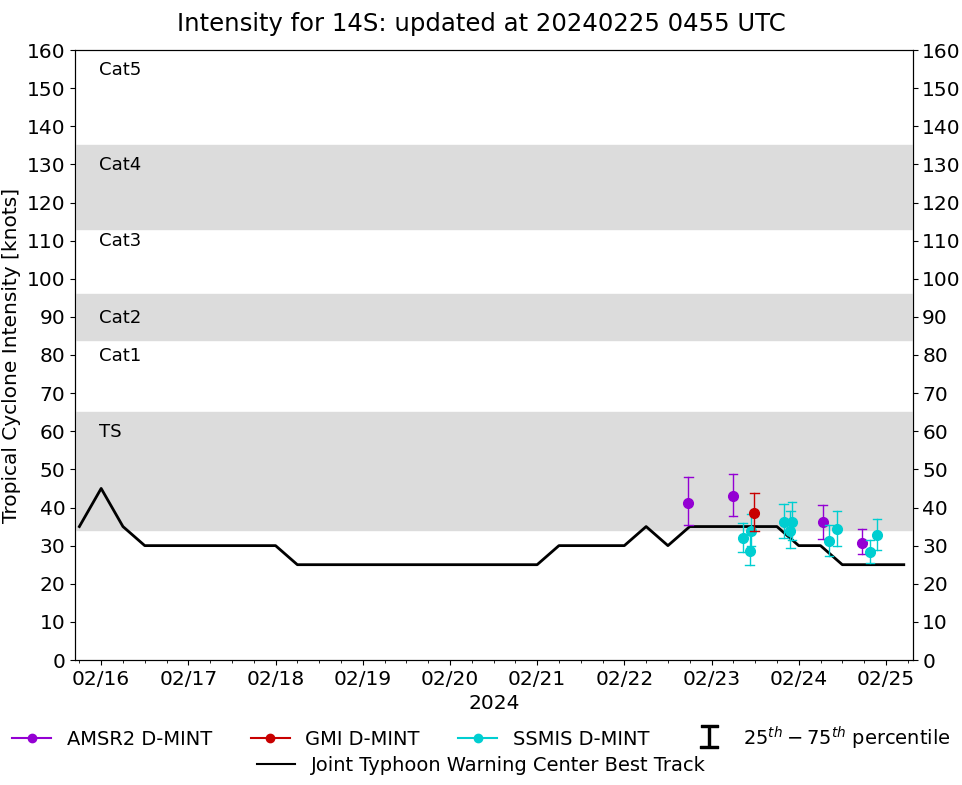 |
D-MINT HISTORY FILE for 2024_14S
| Date | Time | MW Sensor | MSLP | Vmax (30th-70th percentile average) | Vmax 25th percentile | Vmax 75th percentile | Image |
| 20240224 | 2132 UTC | SSMISF16 | 997 hPa | 33 kts | 29 kts | 37 kts | 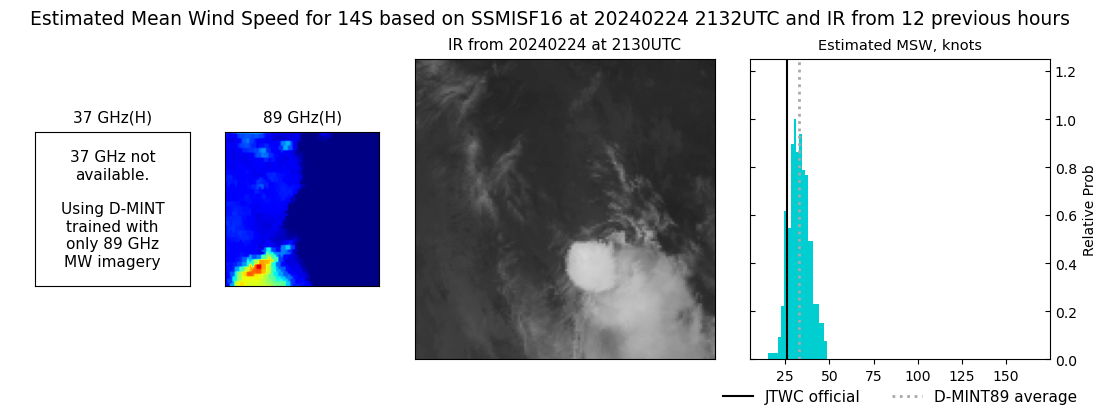 |
| 20240224 | 1937 UTC | SSMISF18 | 998 hPa | 28 kts | 26 kts | 32 kts | 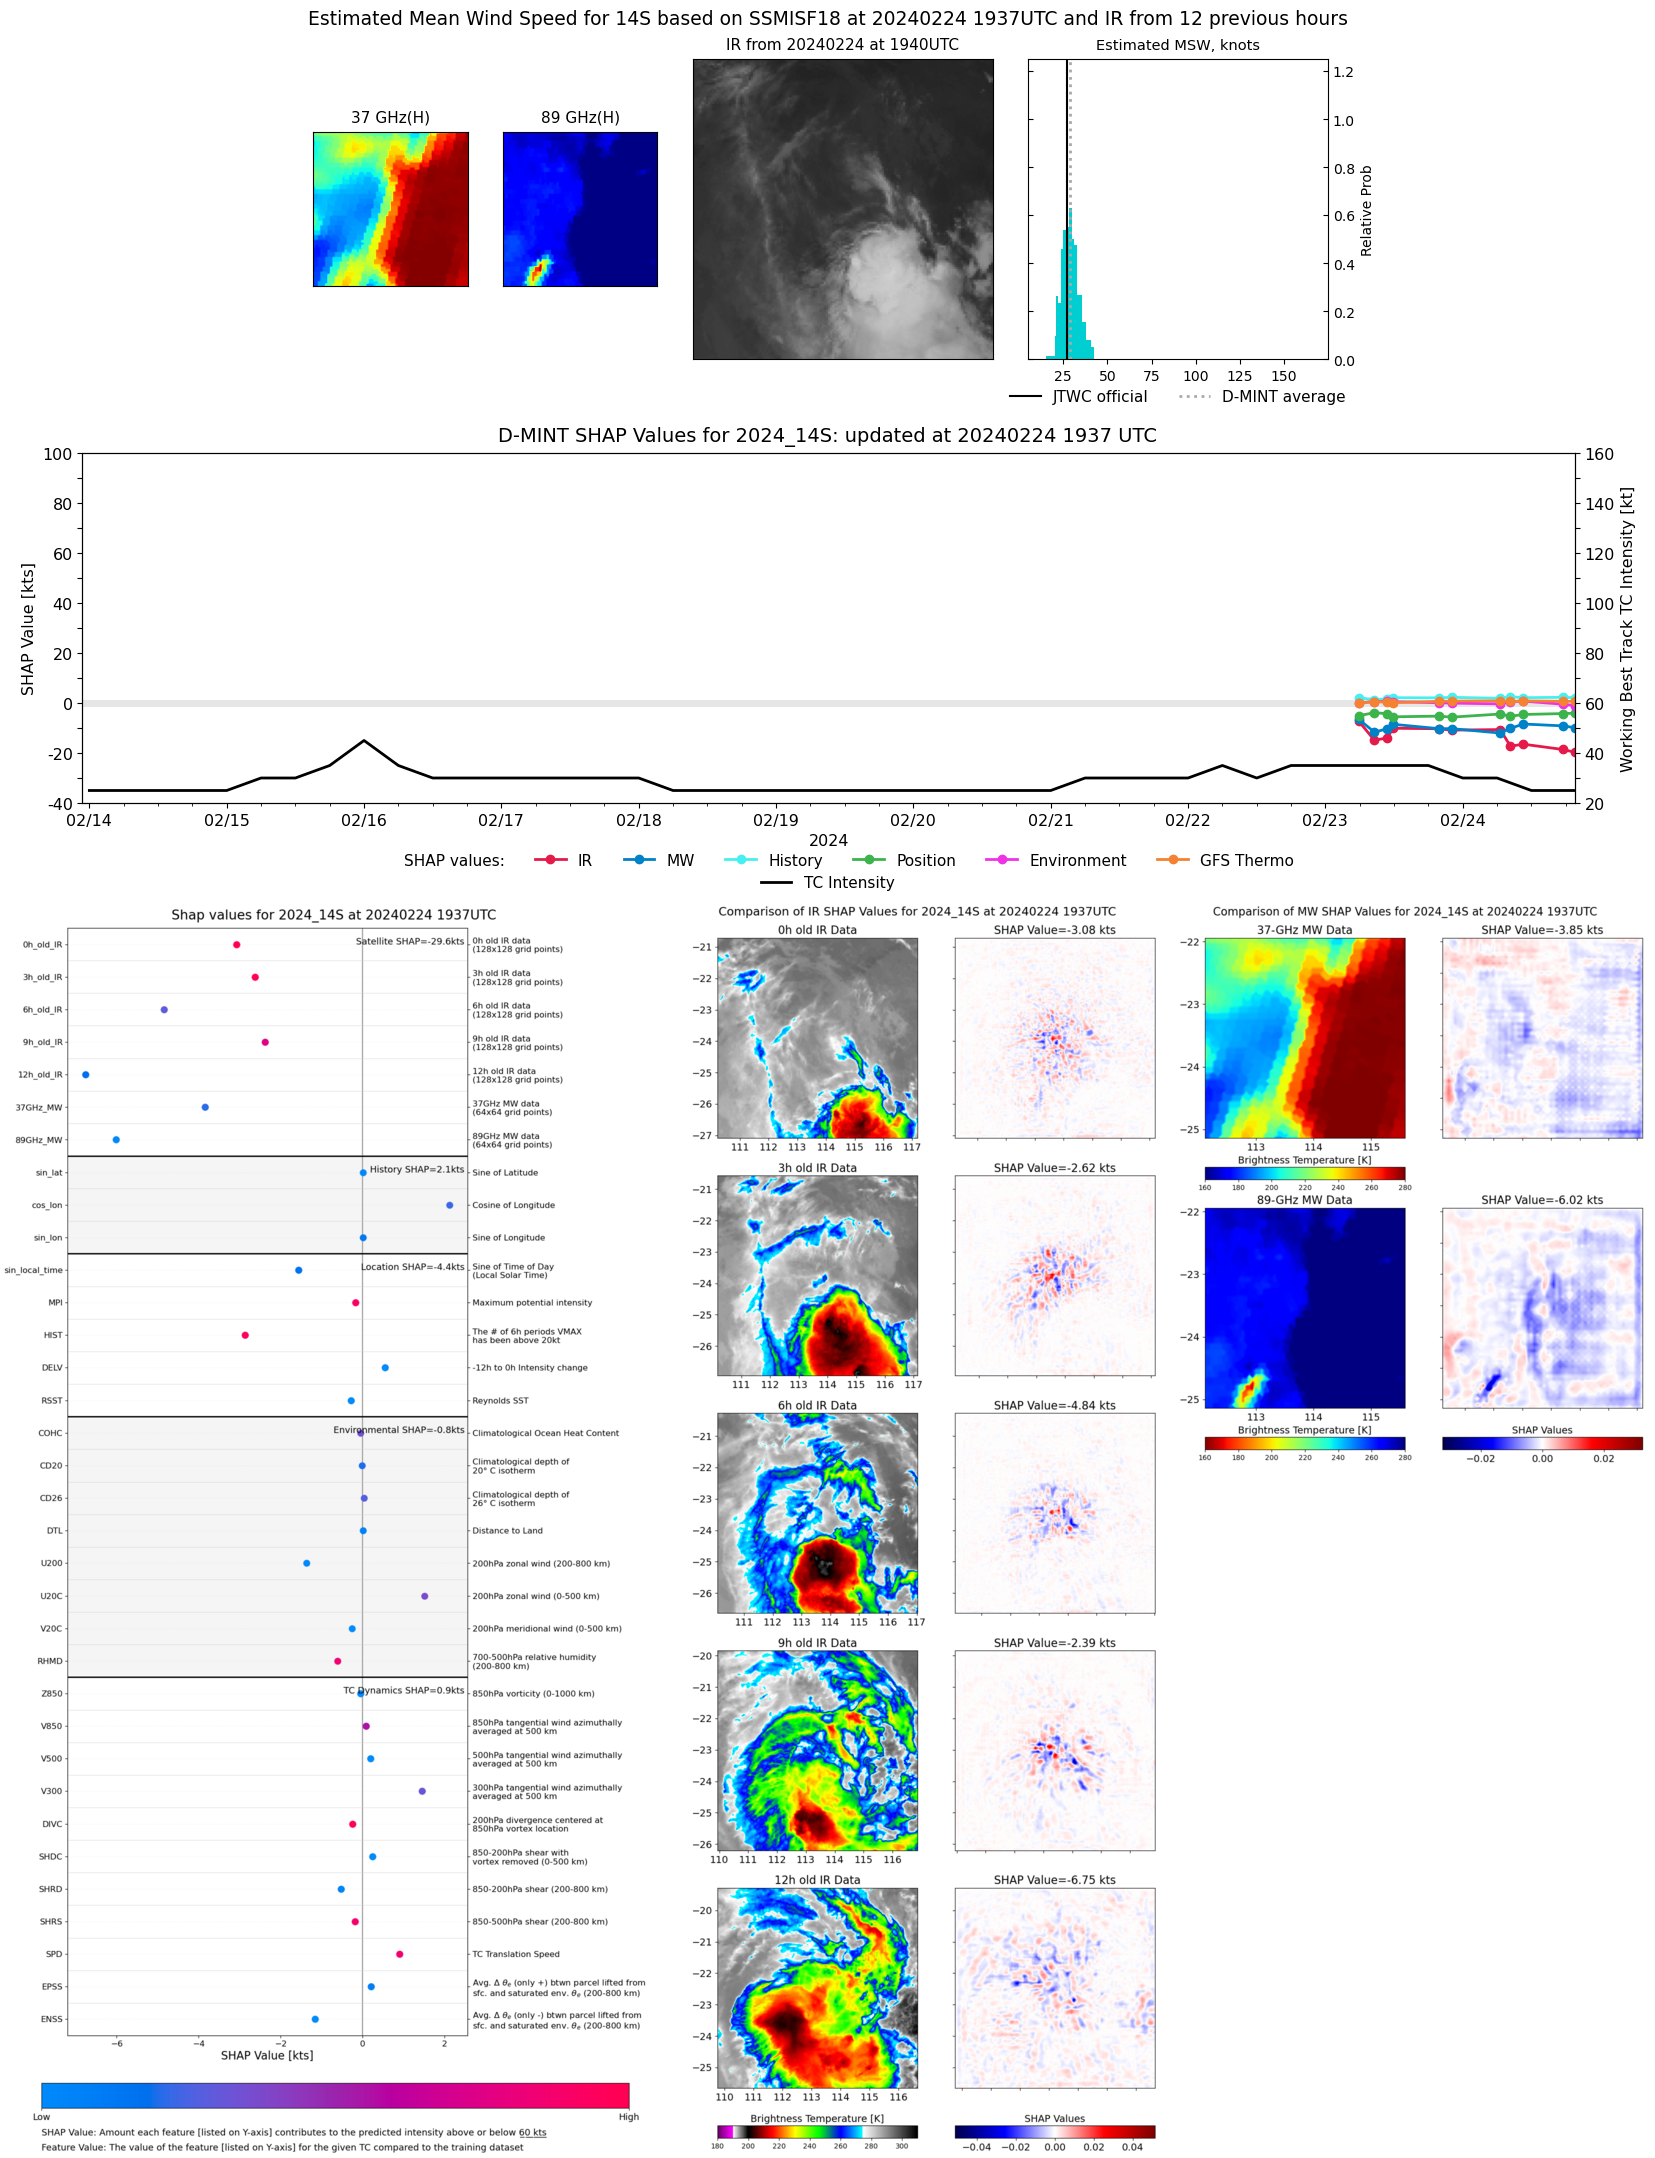 |
| 20240224 | 1729 UTC | AMSR2 | 1000 hPa | 31 kts | 28 kts | 34 kts | 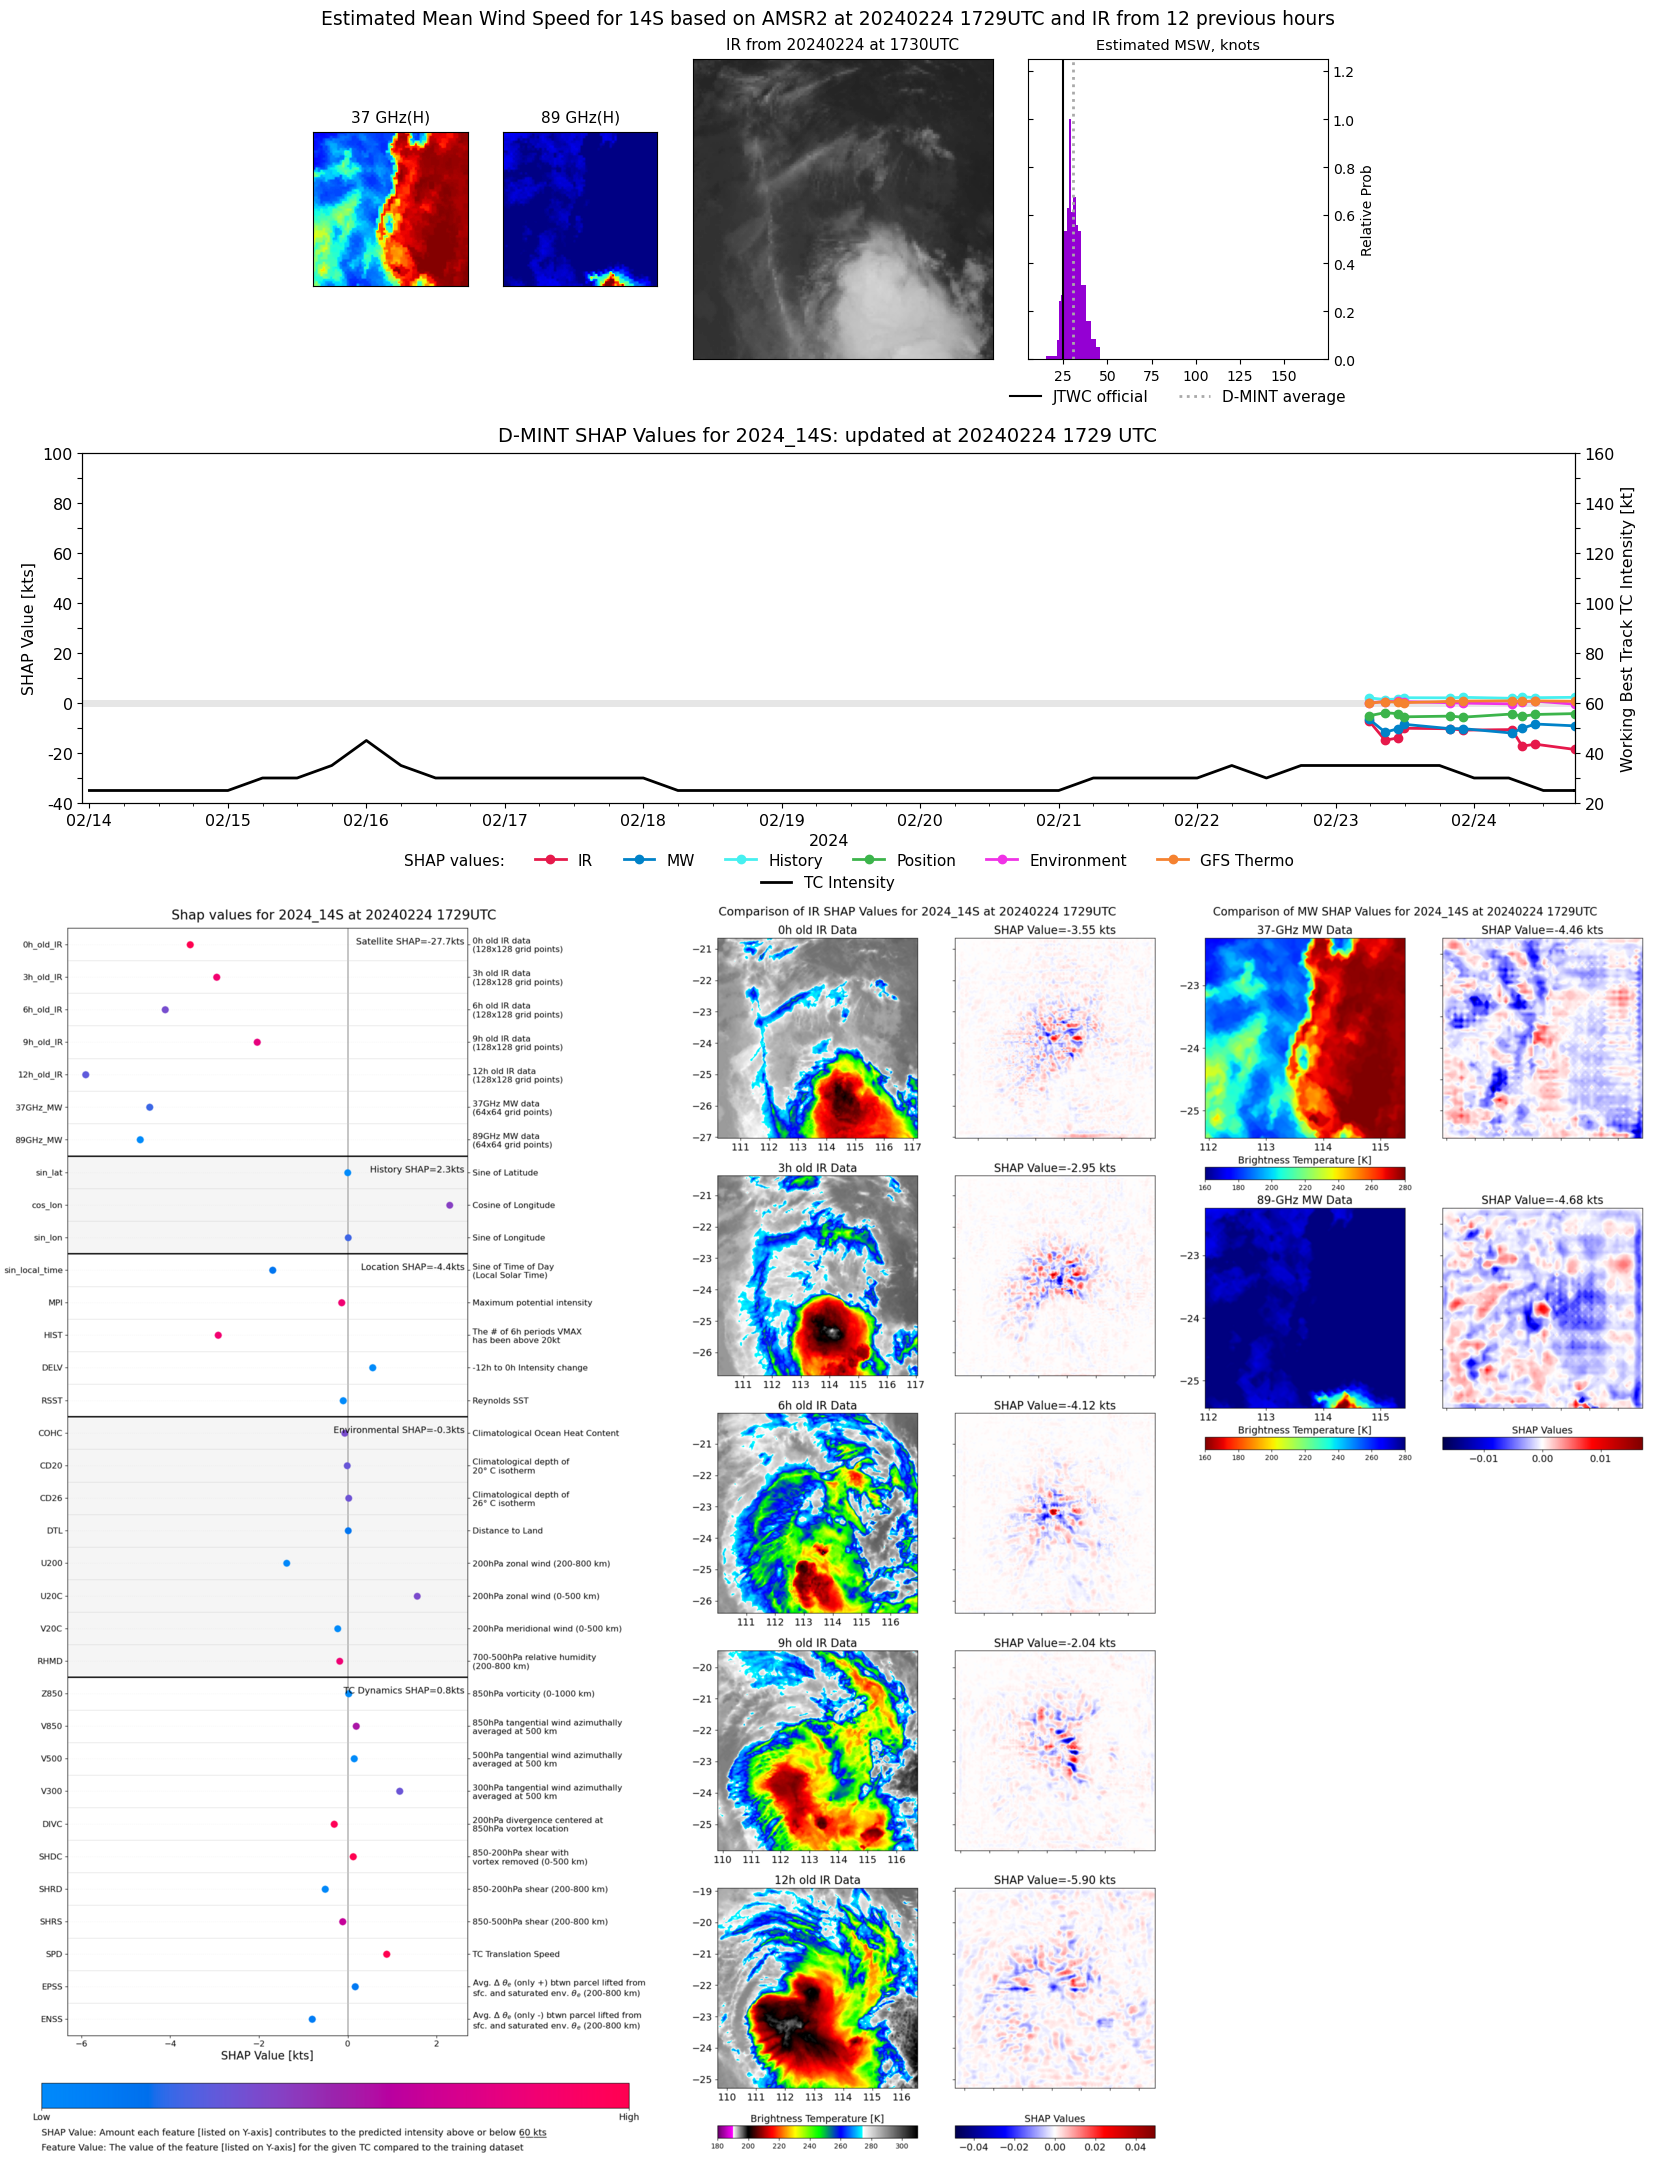 |
| 20240224 | 1036 UTC | SSMISF17 | 999 hPa | 34 kts | 30 kts | 39 kts | 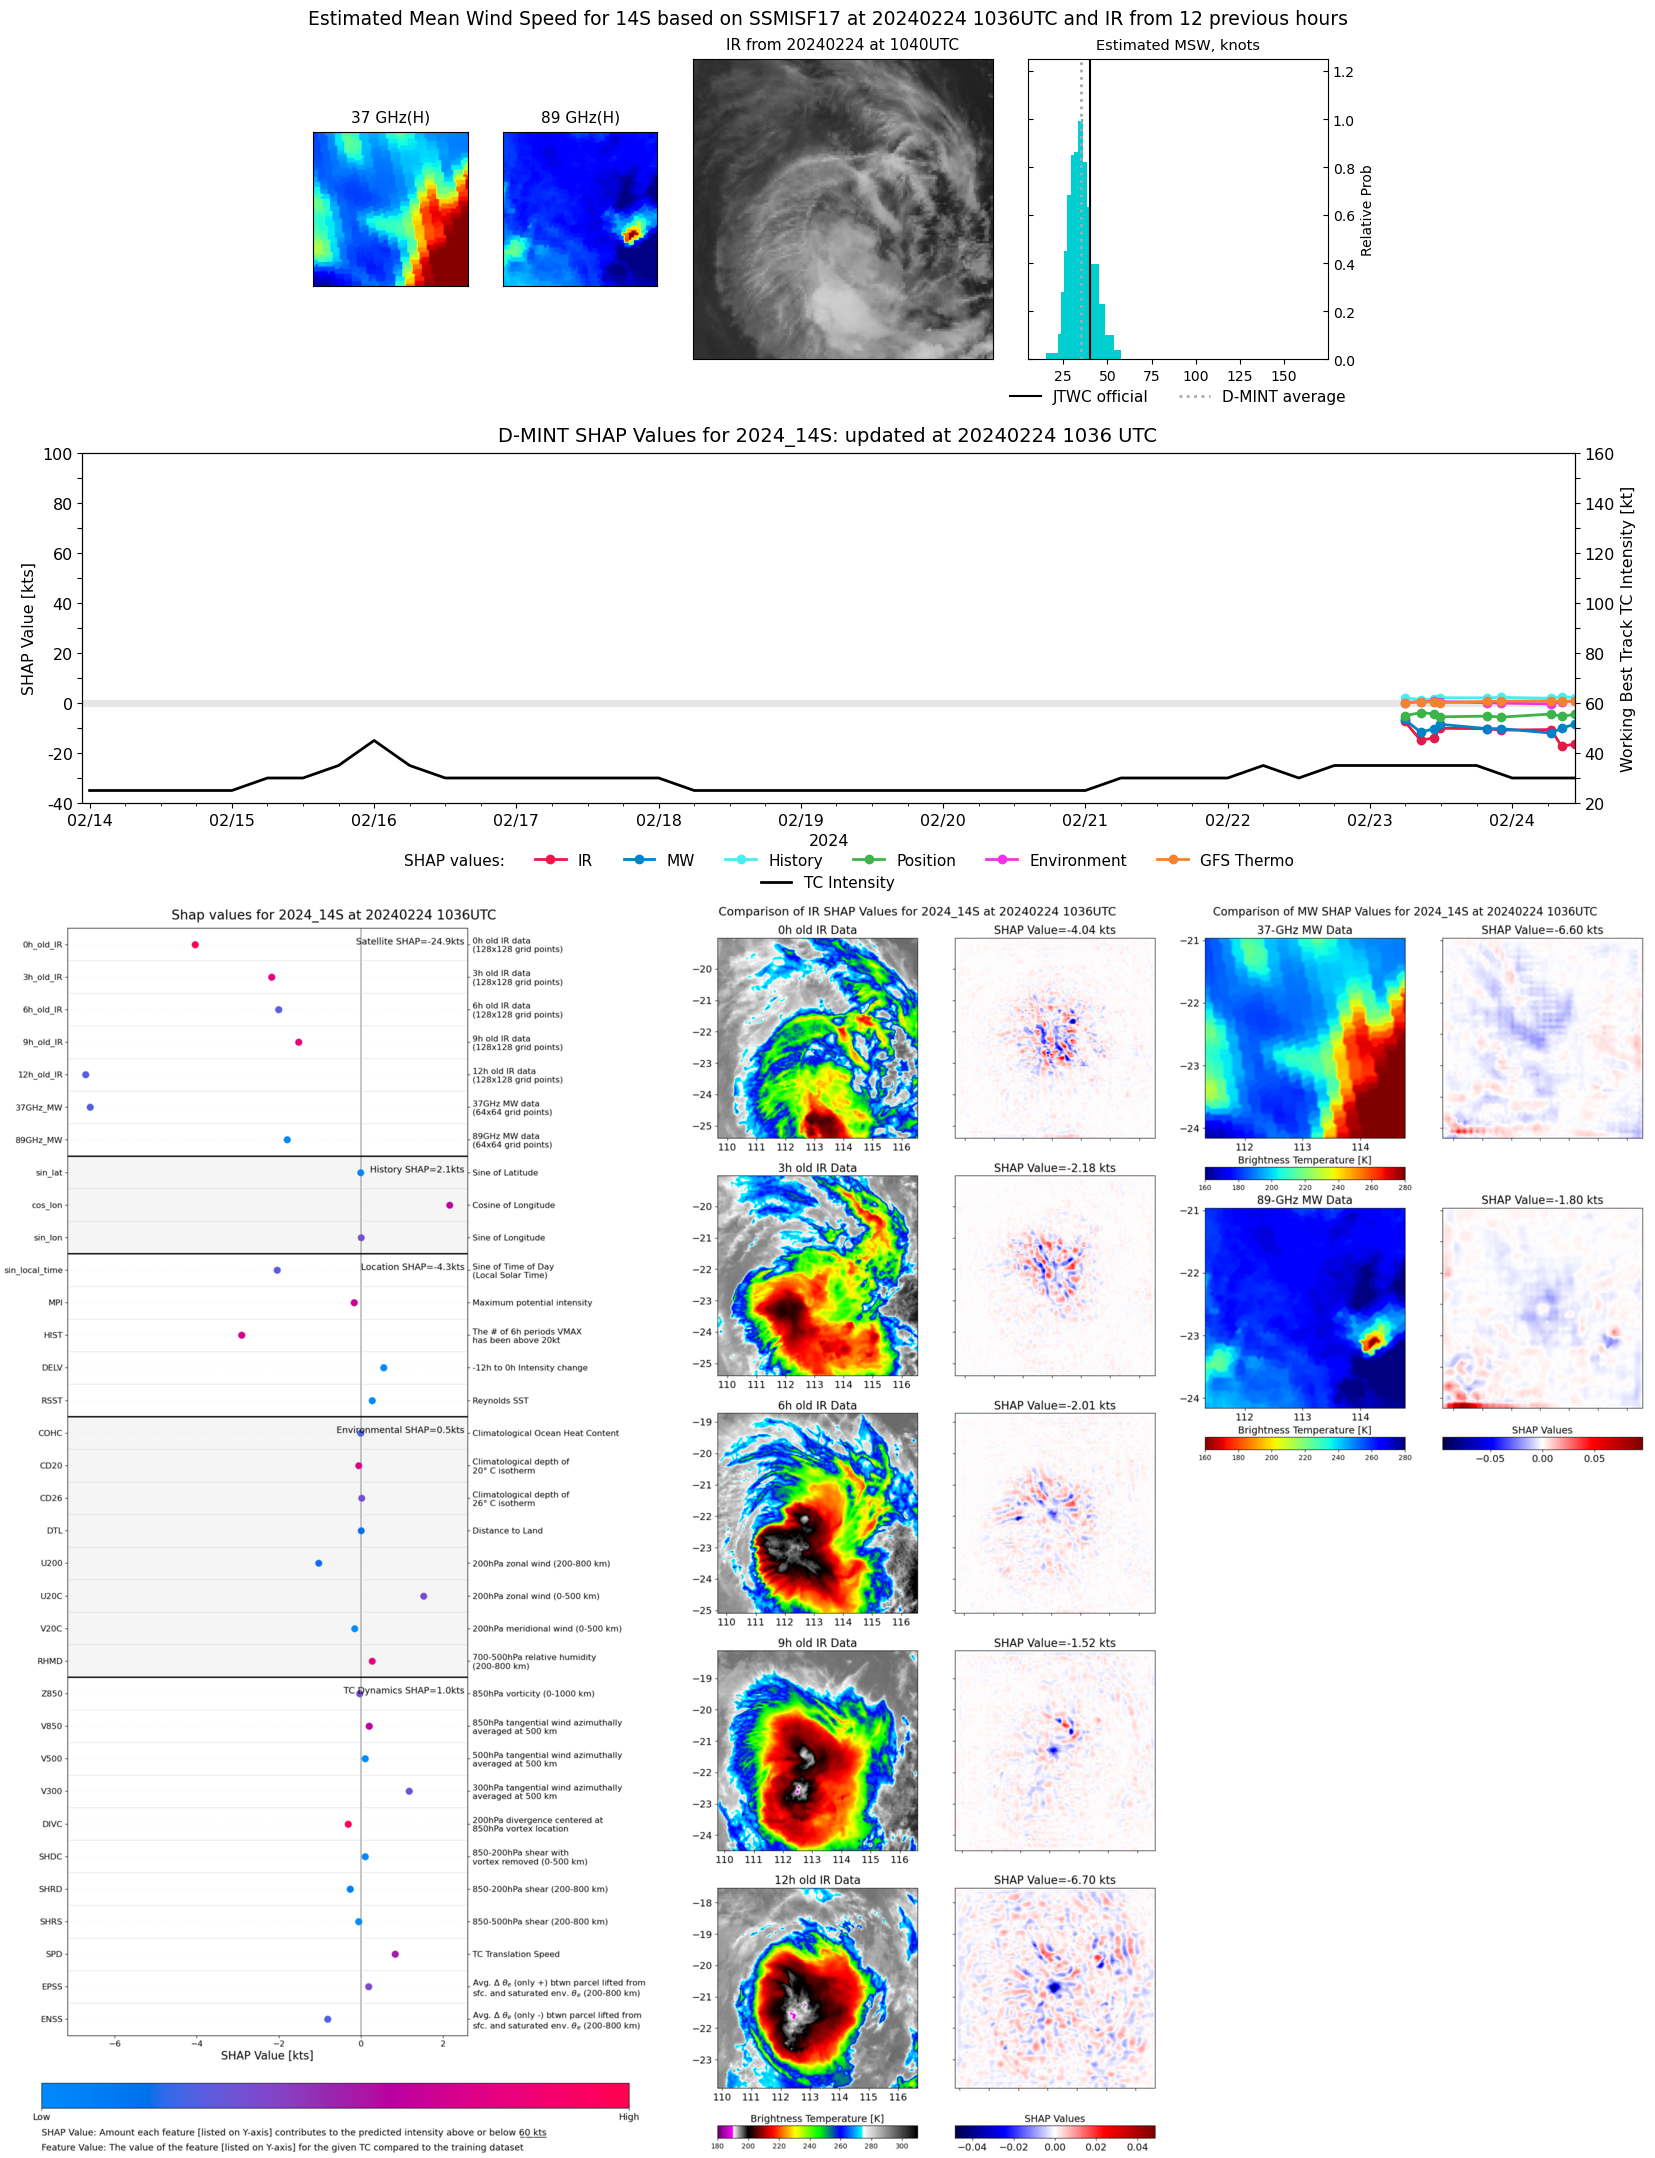 |
| 20240224 | 0820 UTC | SSMISF18 | 998 hPa | 31 kts | 27 kts | 35 kts | 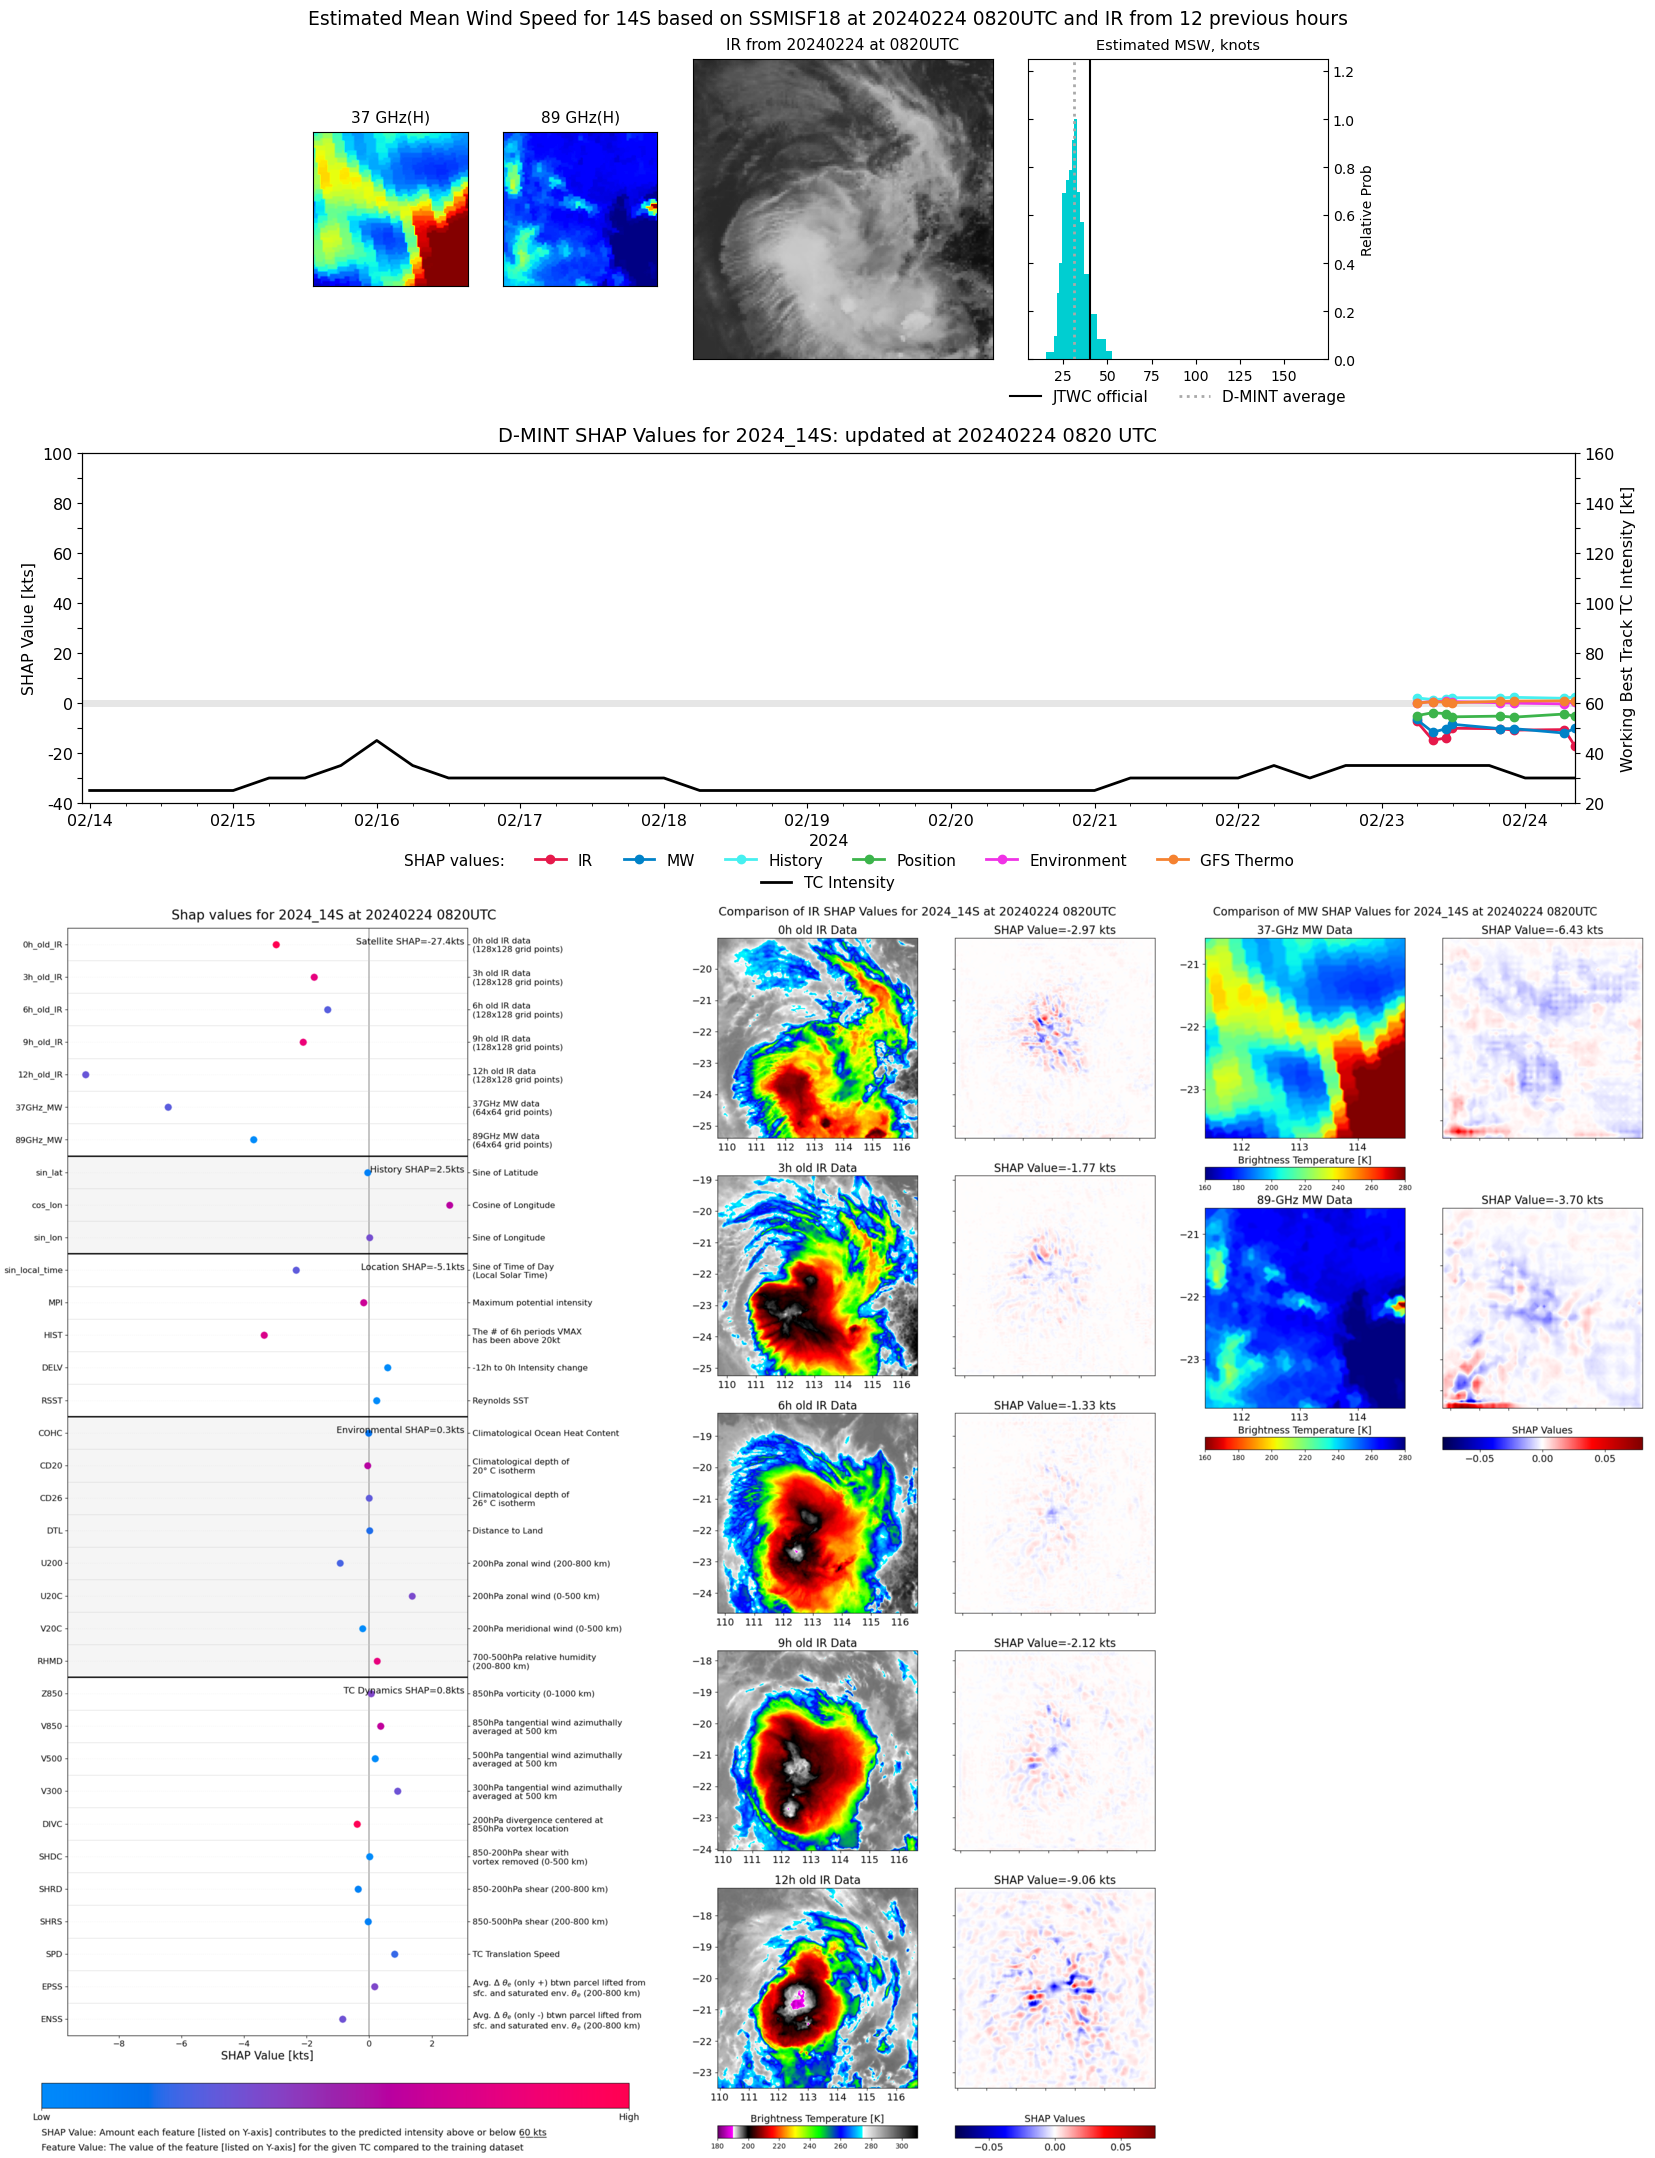 |
| 20240224 | 0633 UTC | AMSR2 | 996 hPa | 36 kts | 32 kts | 41 kts | 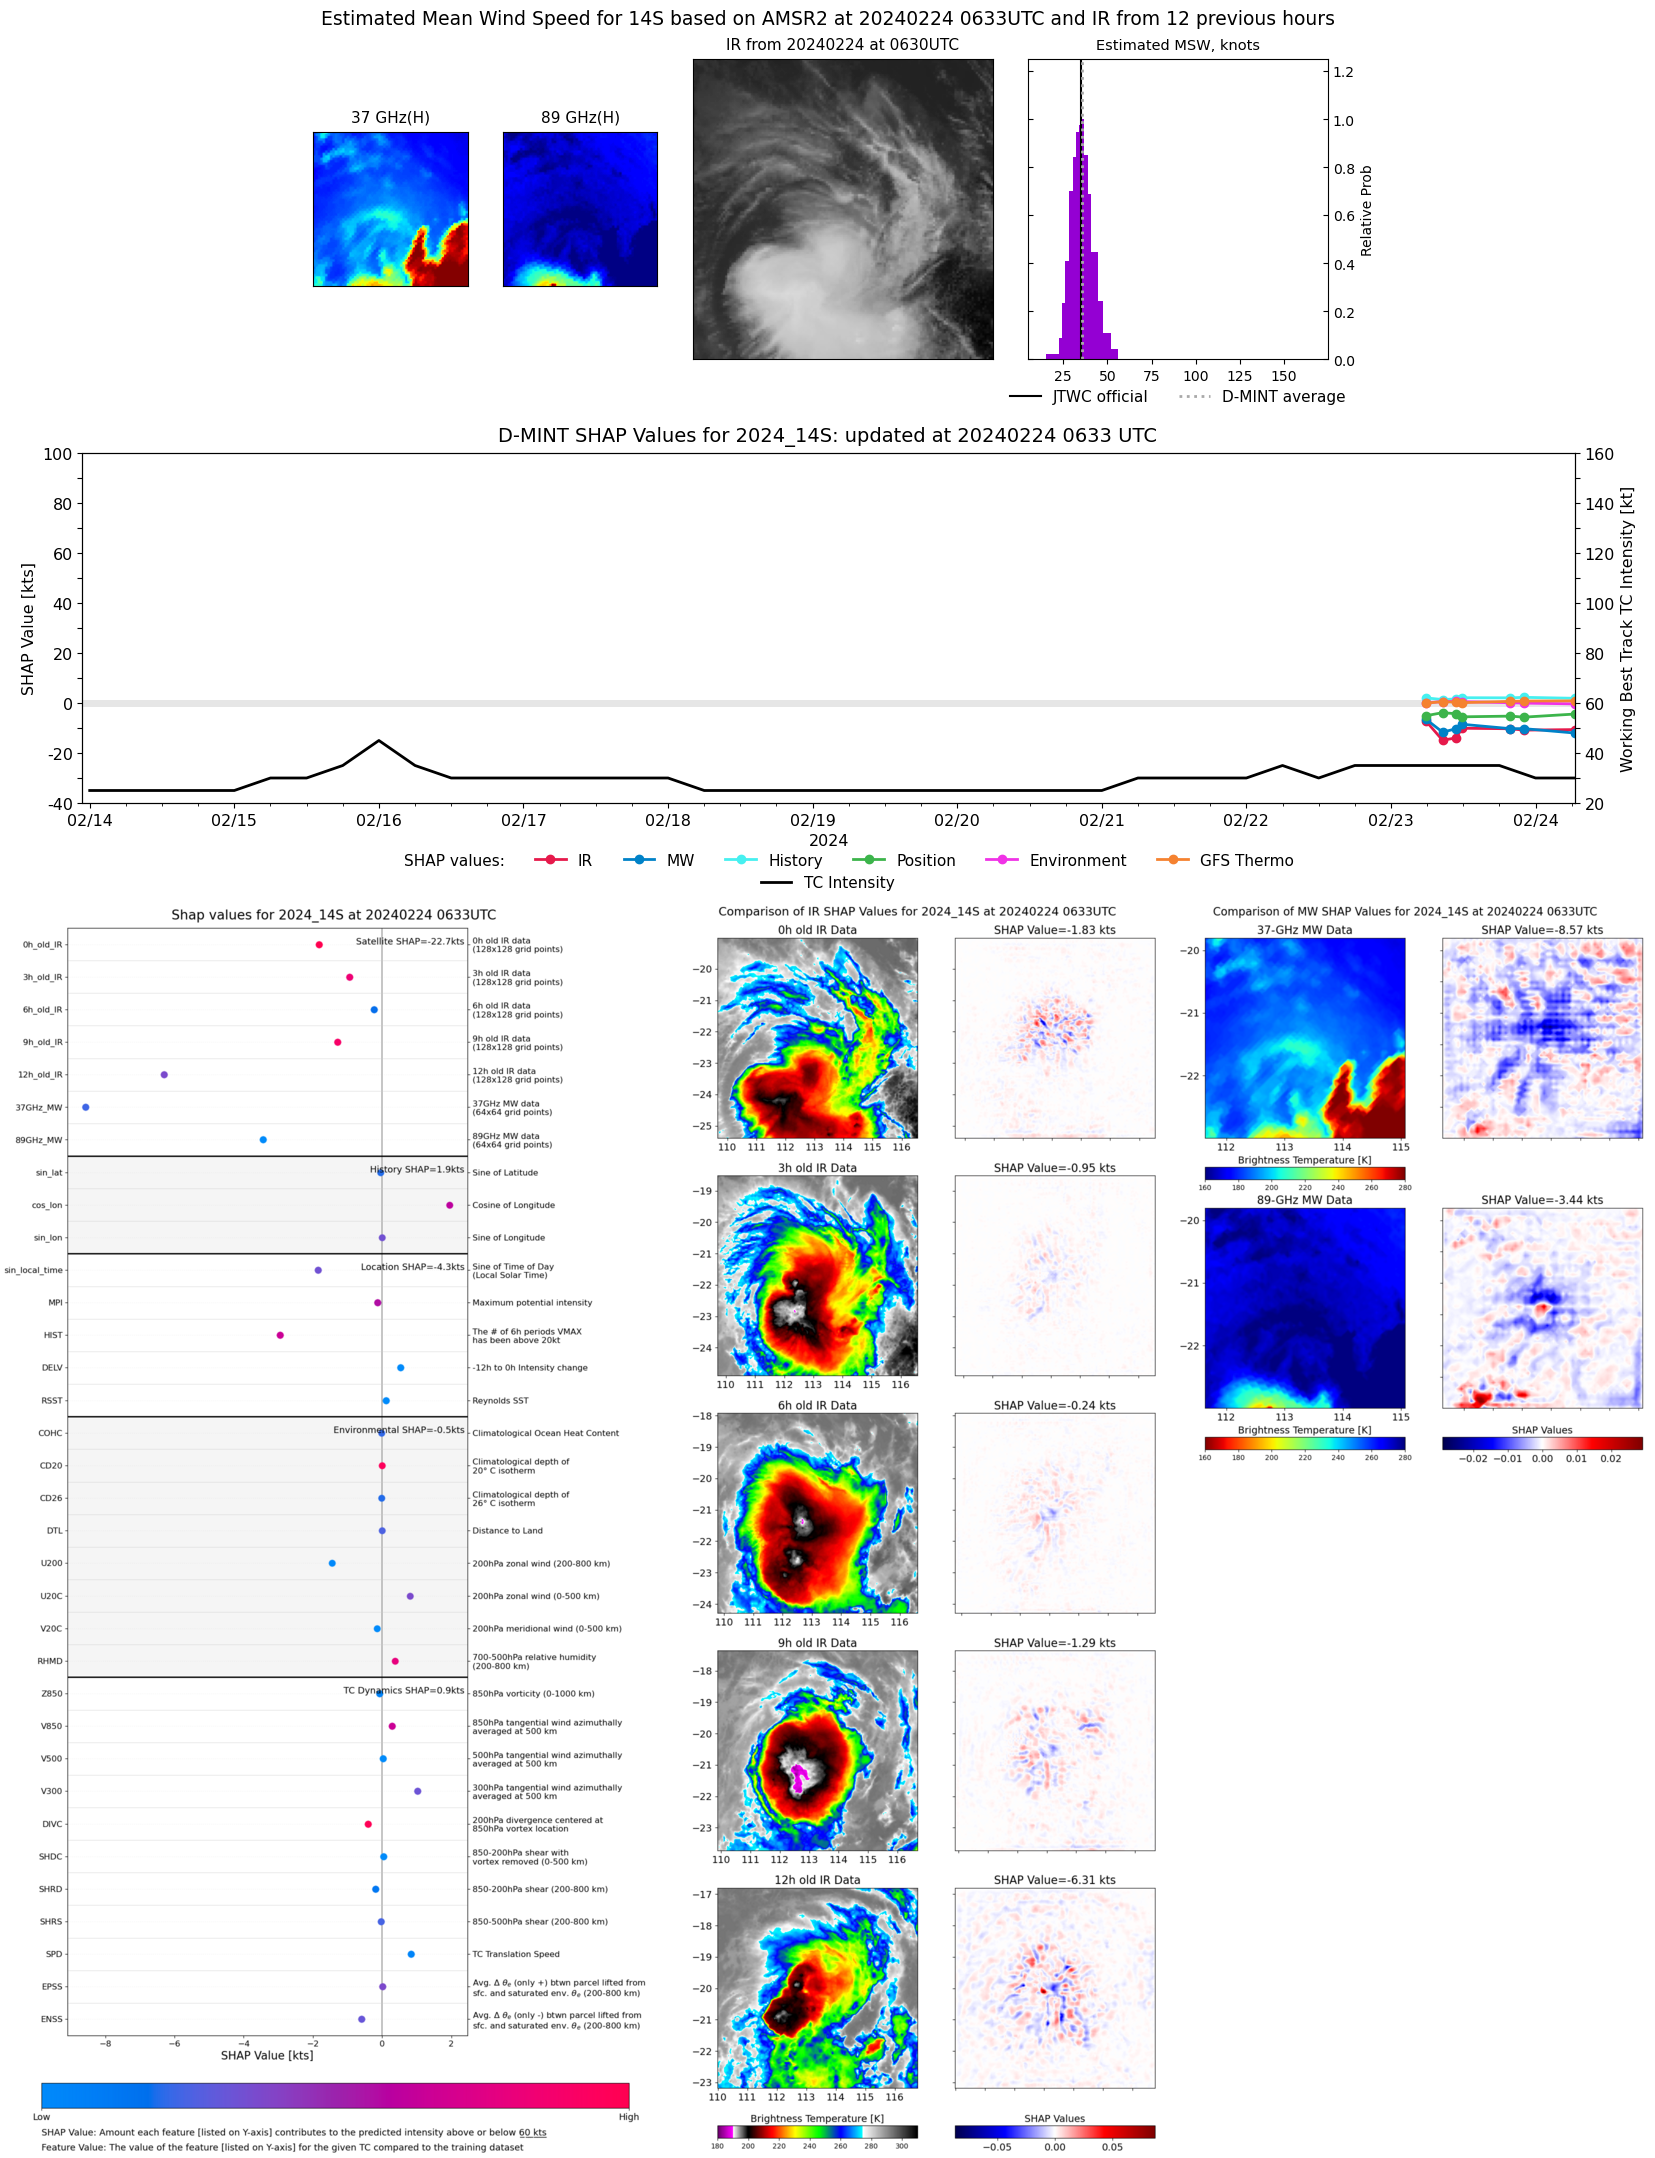 |
| 20240223 | 2205 UTC | SSMISF17 | 999 hPa | 36 kts | 32 kts | 42 kts | 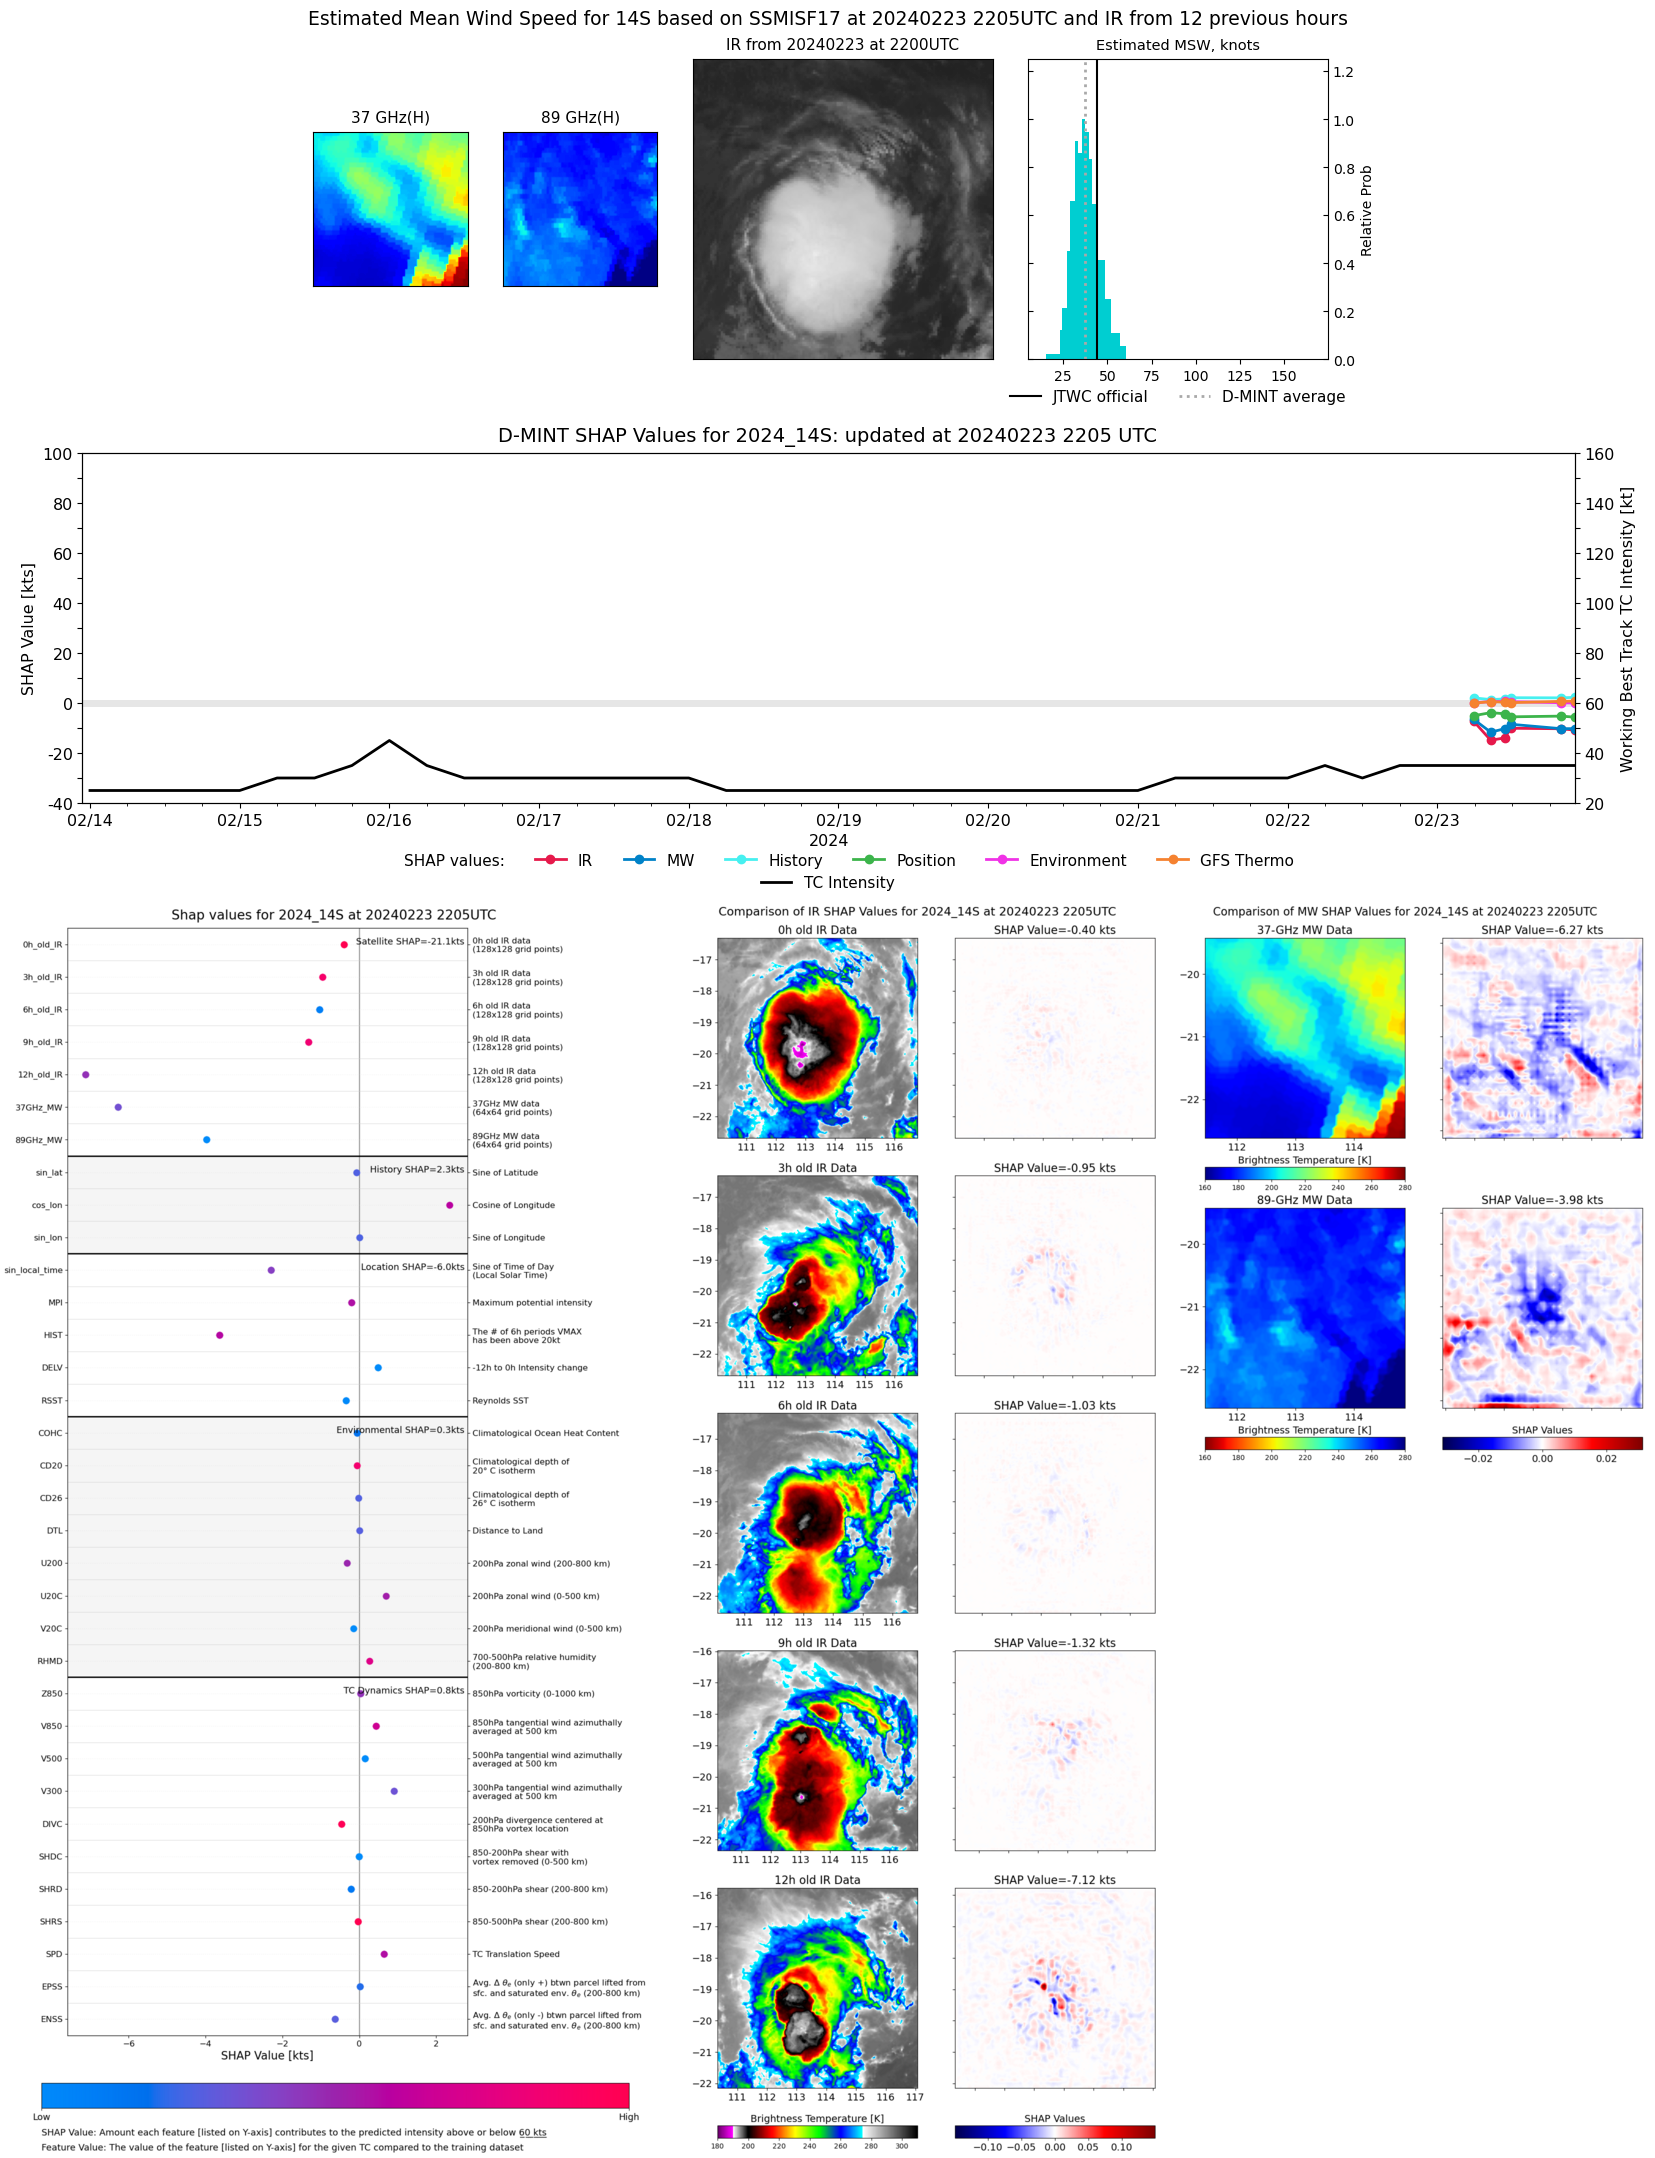 |
| 20240223 | 2144 UTC | SSMISF16 | 998 hPa | 34 kts | 29 kts | 39 kts | 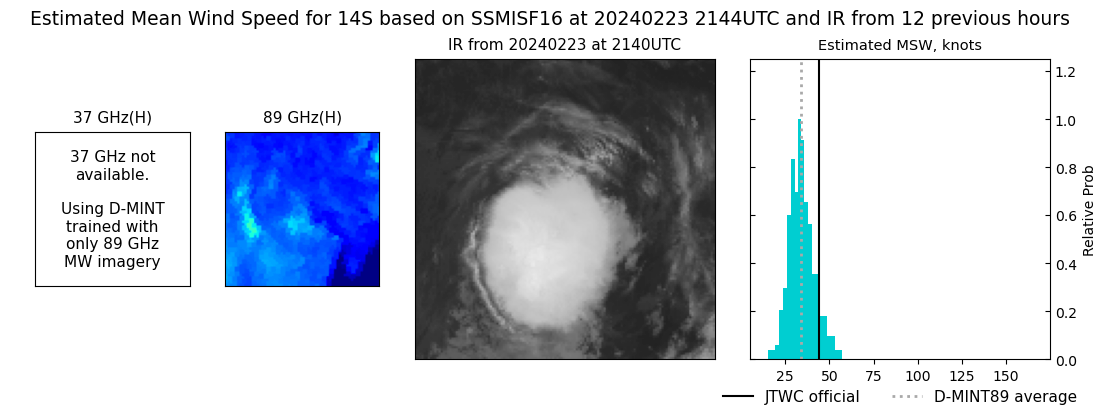 |
| 20240223 | 1949 UTC | SSMISF18 | 998 hPa | 36 kts | 32 kts | 41 kts | 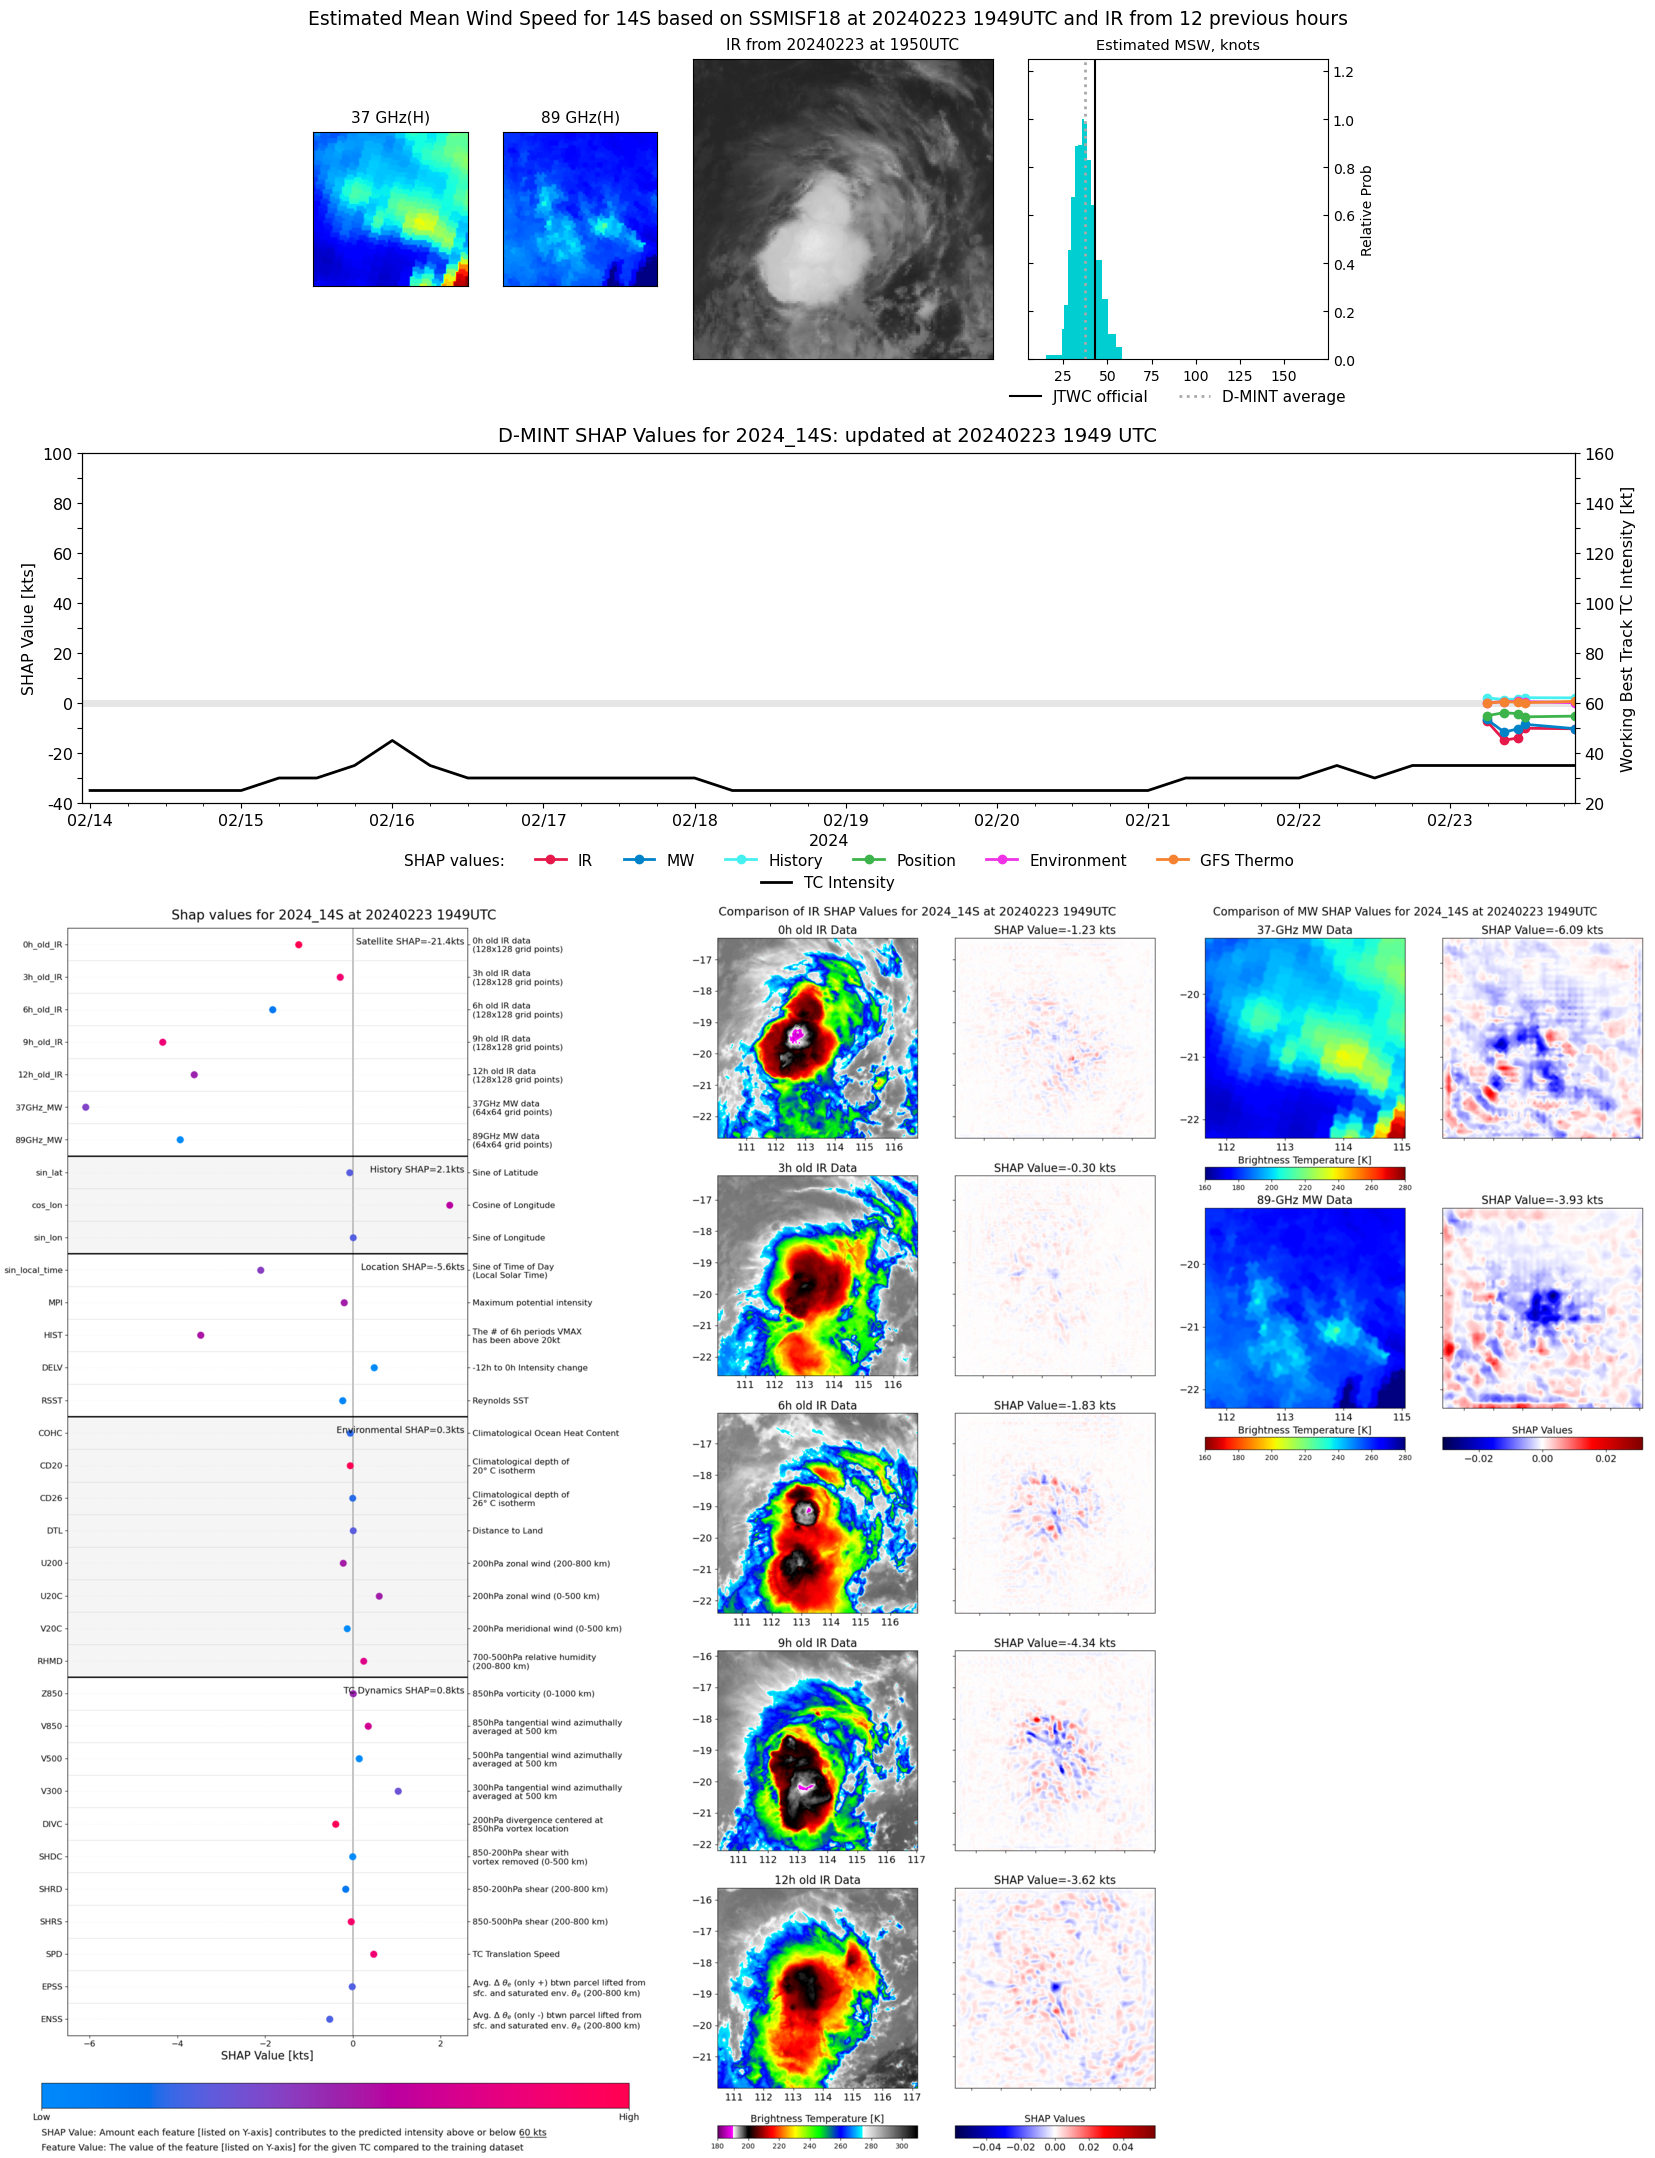 |
| 20240223 | 1148 UTC | GMI | 995 hPa | 39 kts | 34 kts | 44 kts | 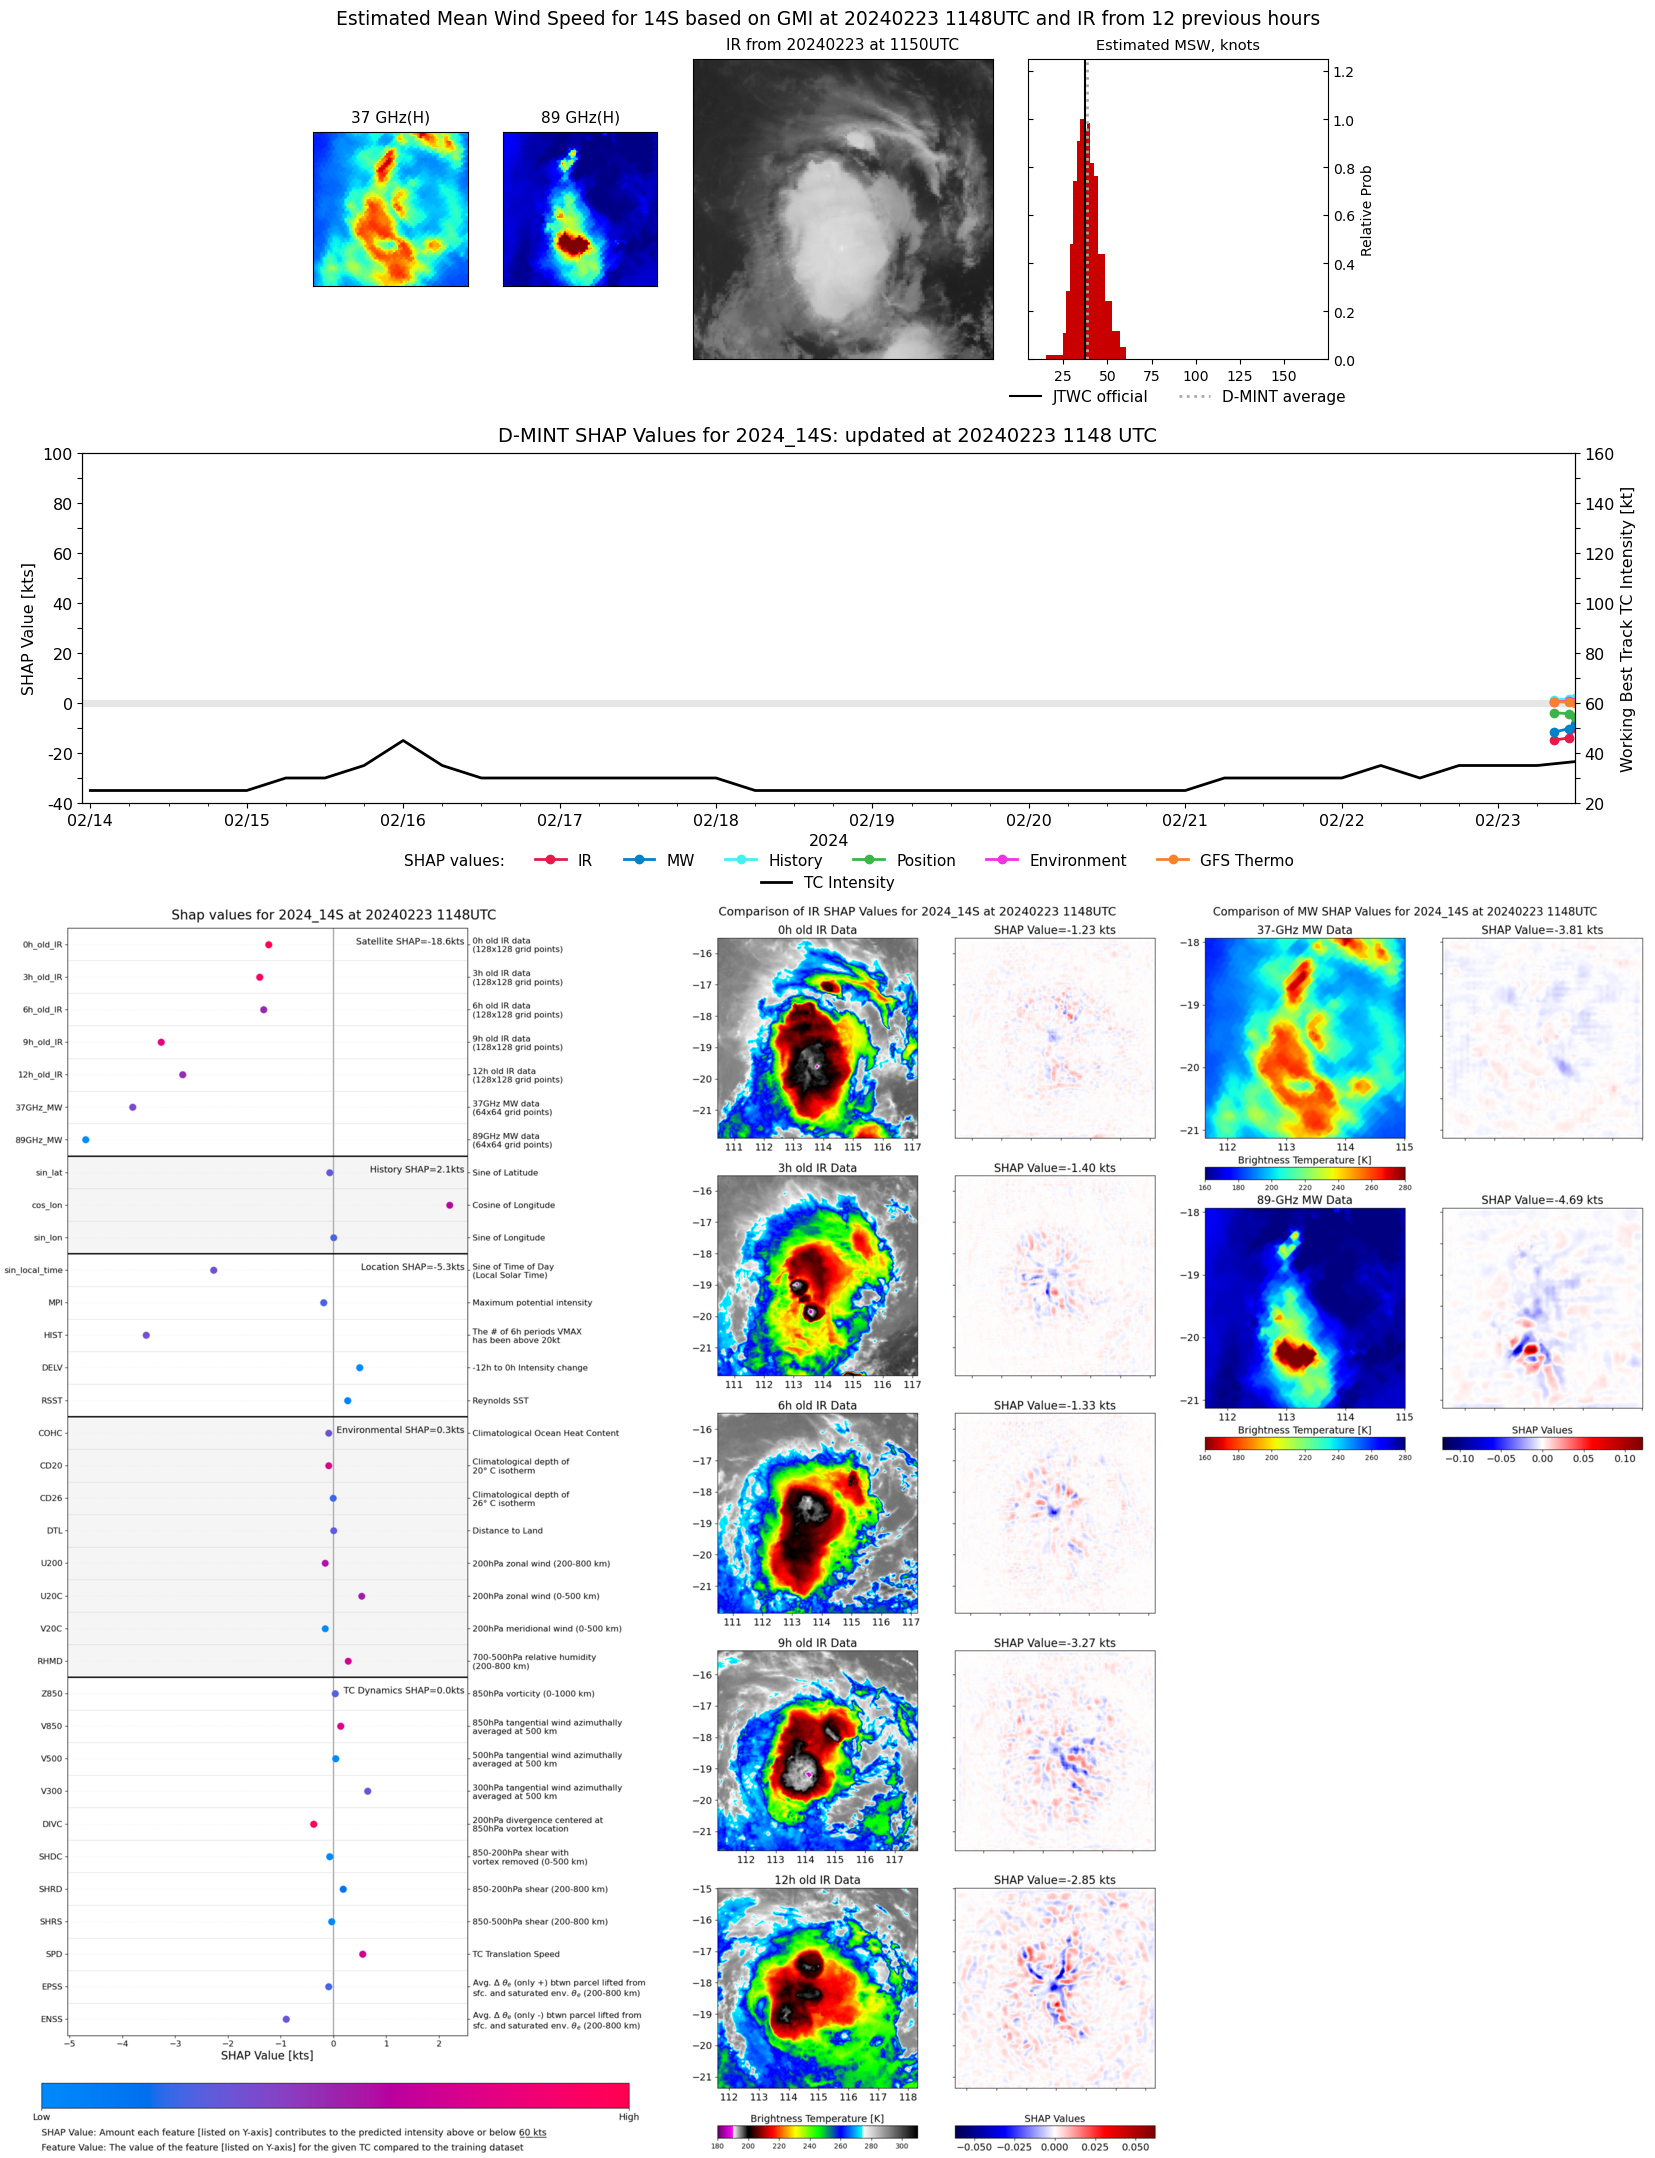 |
| 20240223 | 1050 UTC | SSMISF17 | 995 hPa | 34 kts | 30 kts | 38 kts | 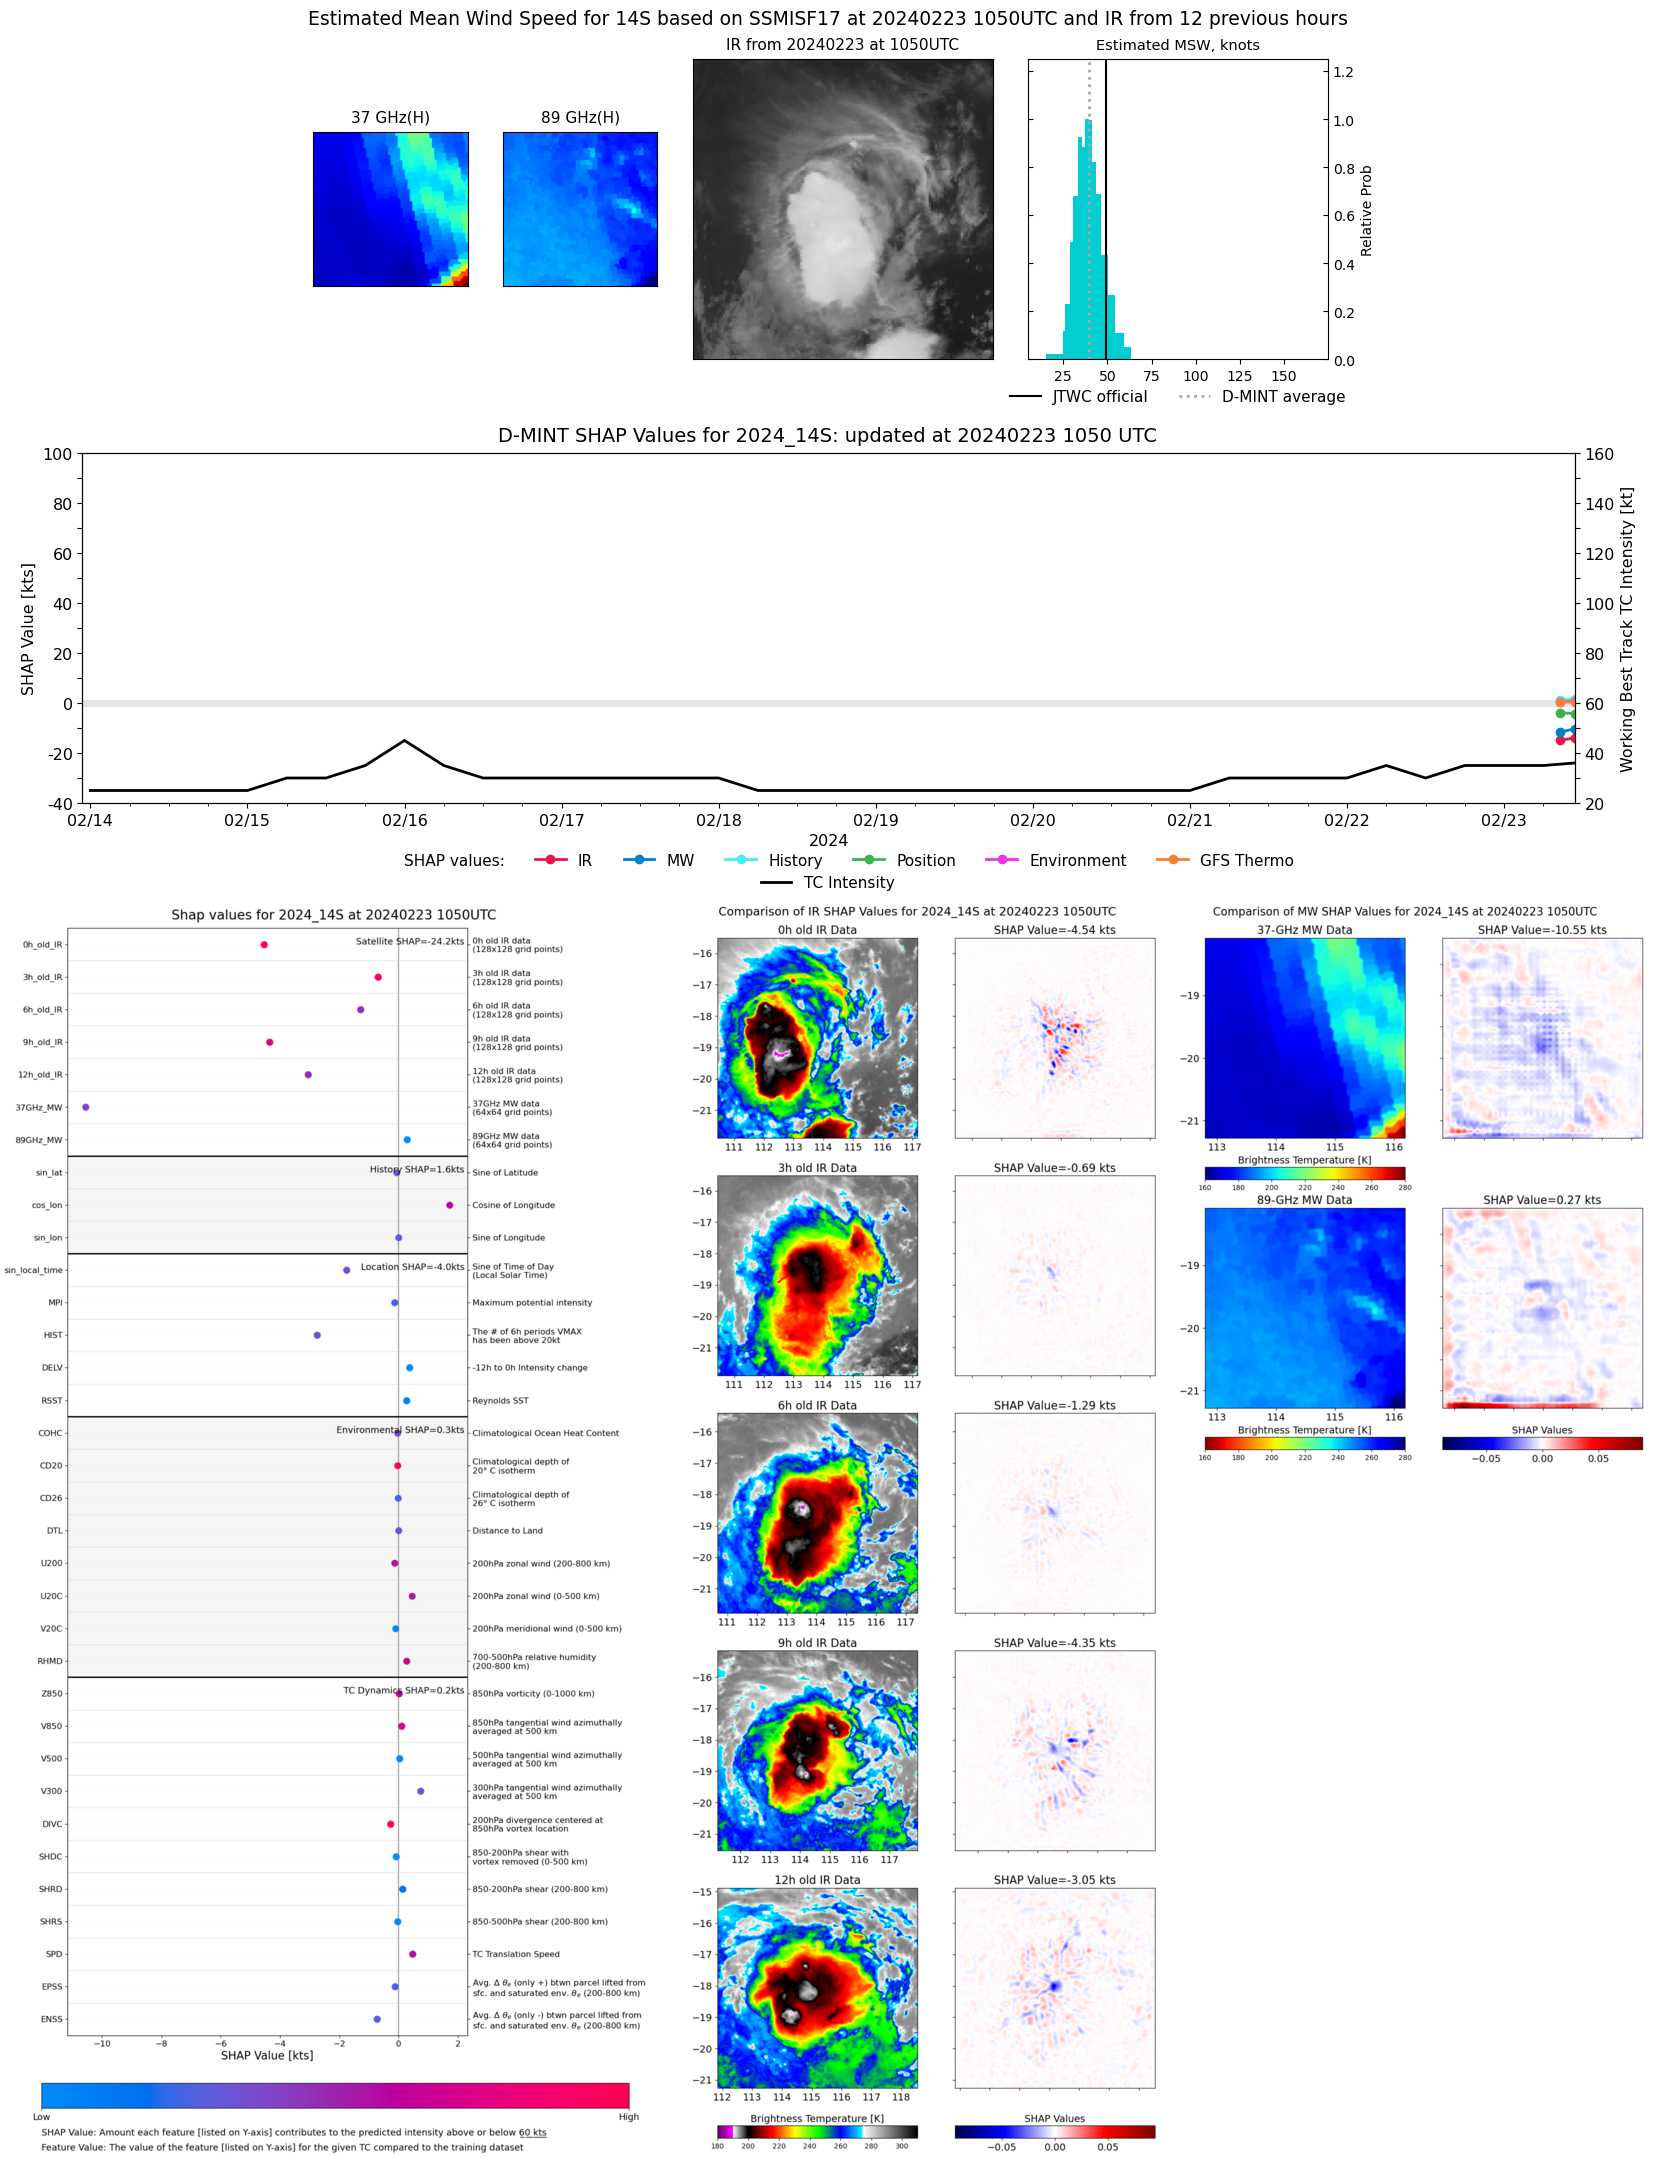 |
| 20240223 | 1030 UTC | SSMISF16 | 994 hPa | 29 kts | 25 kts | 33 kts | 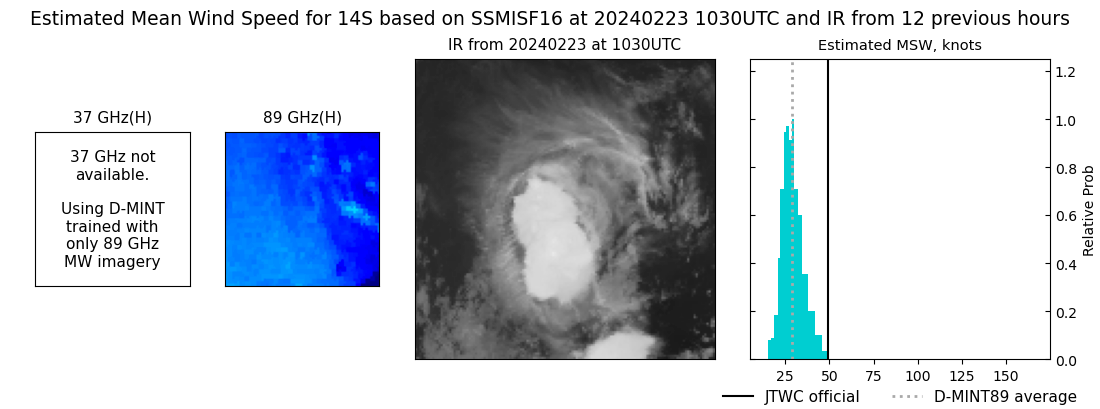 |
| 20240223 | 0834 UTC | SSMISF18 | 997 hPa | 32 kts | 28 kts | 36 kts | 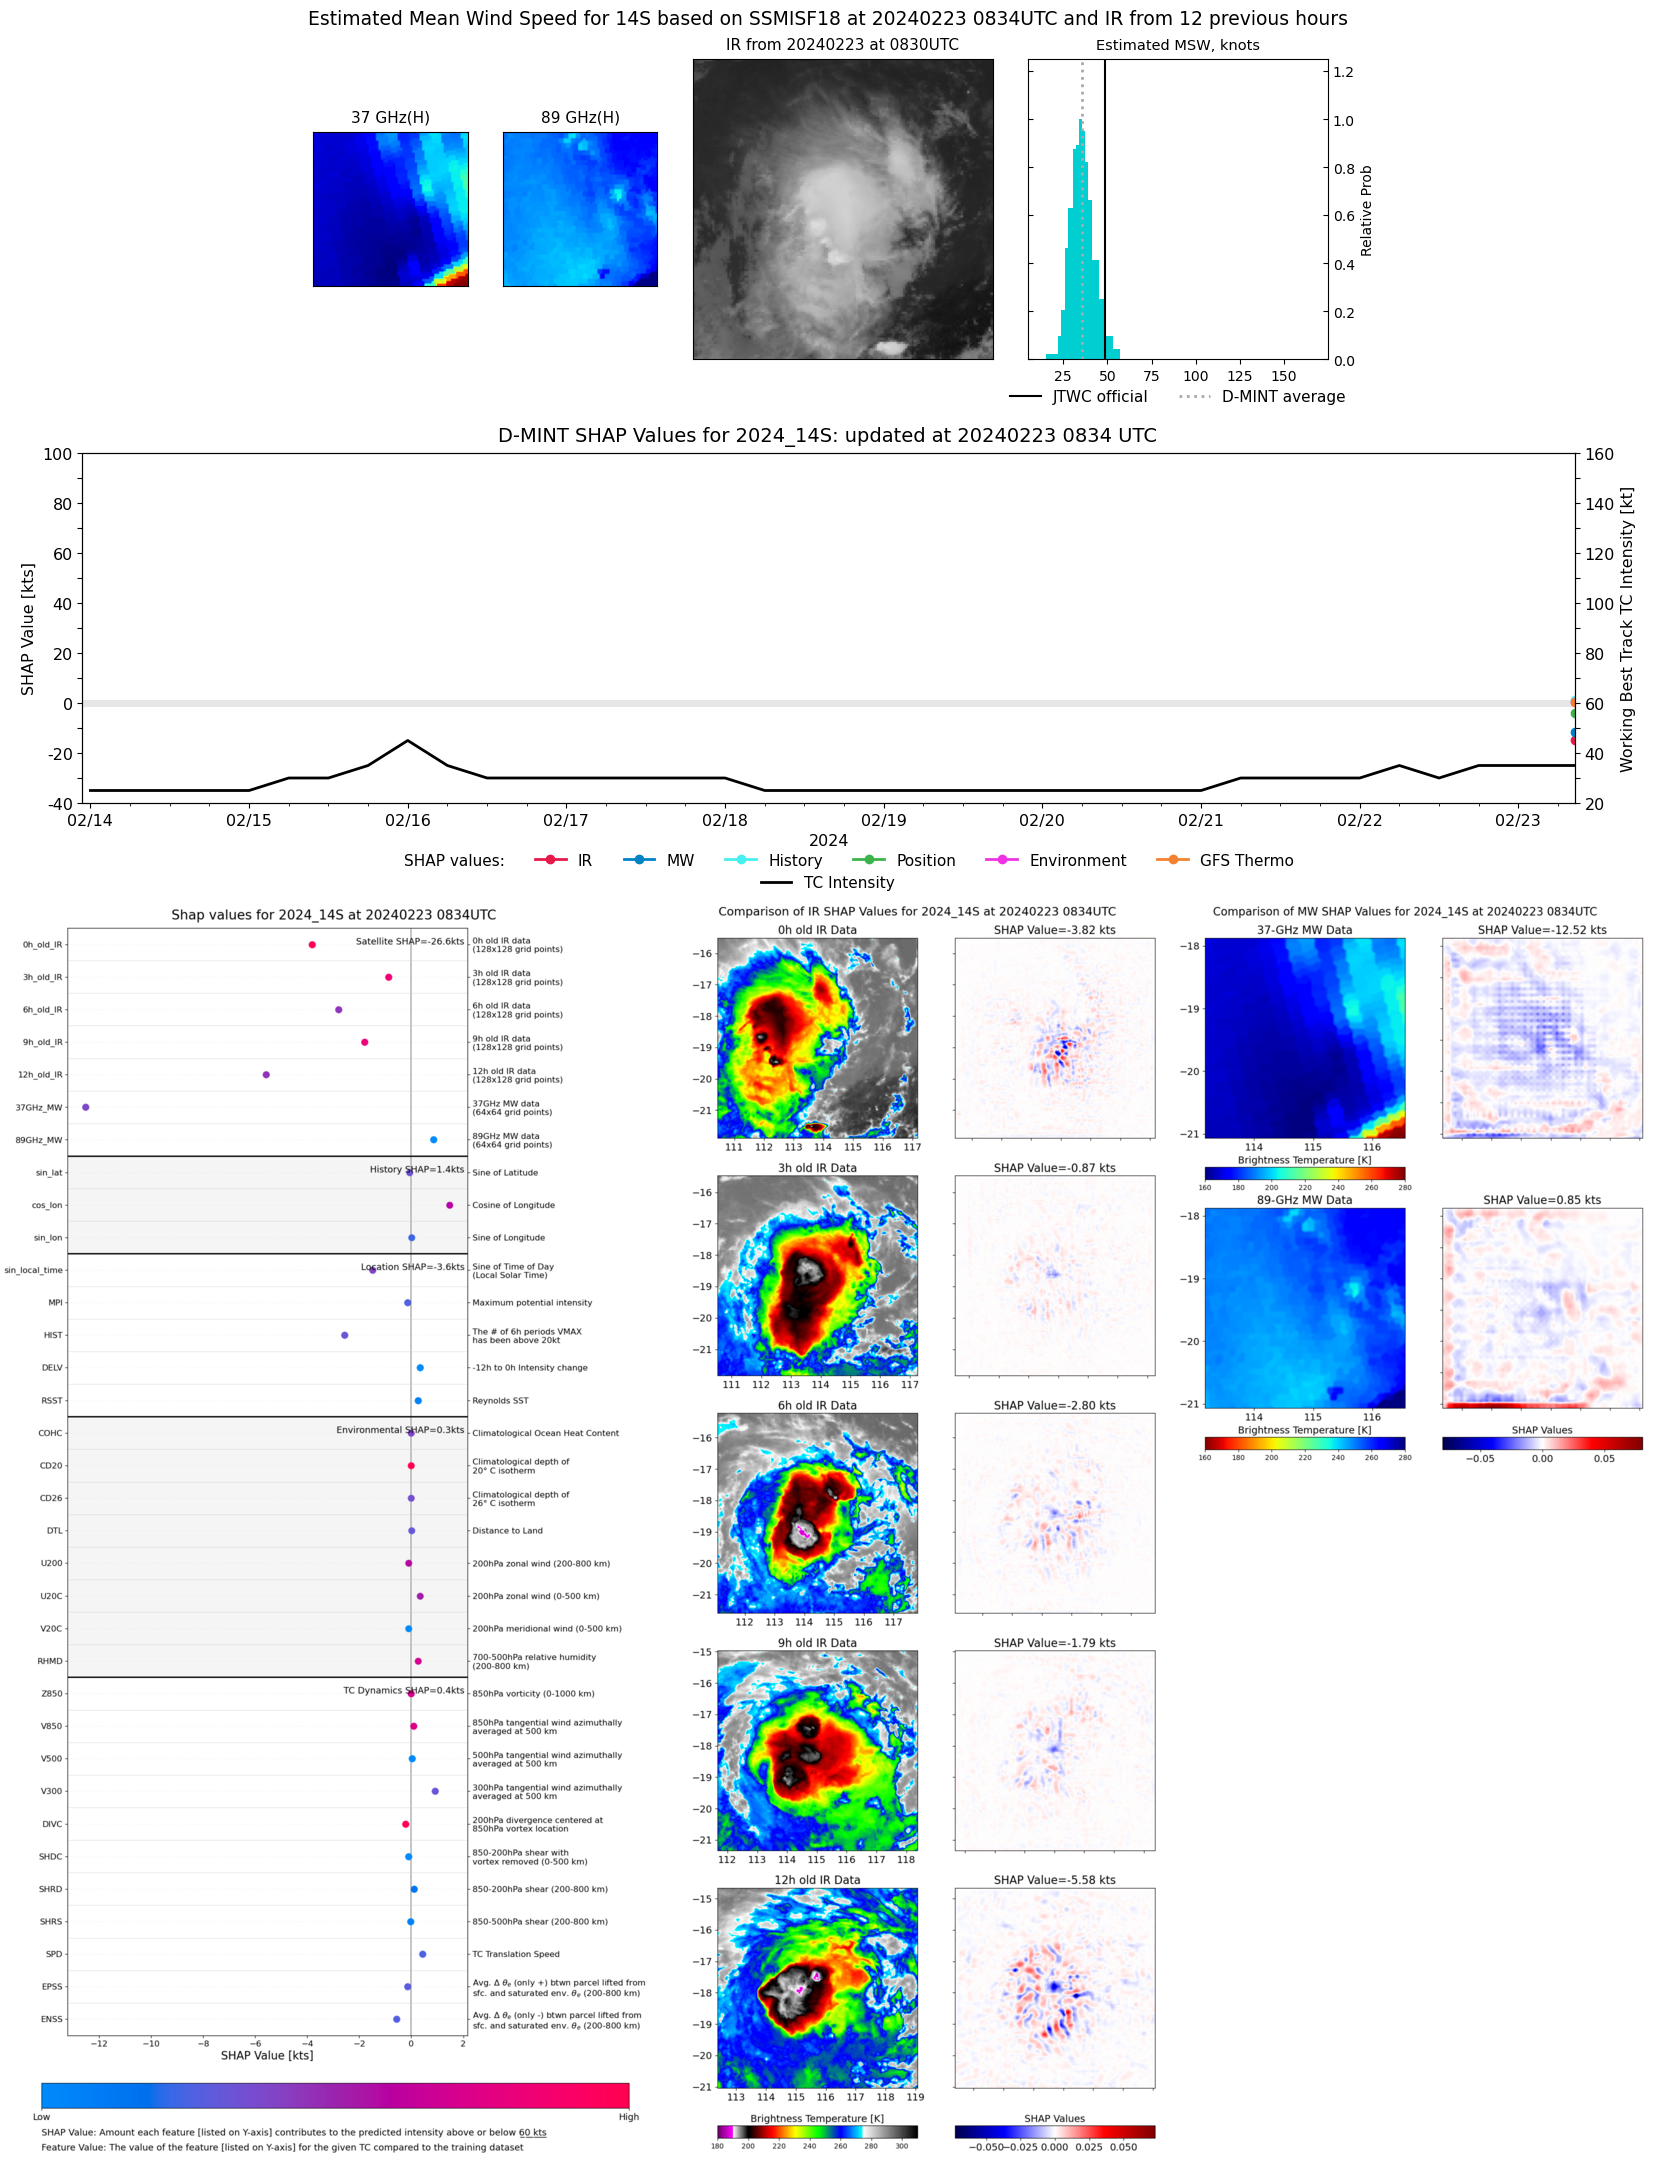 |
| 20240223 | 0551 UTC | AMSR2 | 991 hPa | 43 kts | 38 kts | 49 kts | 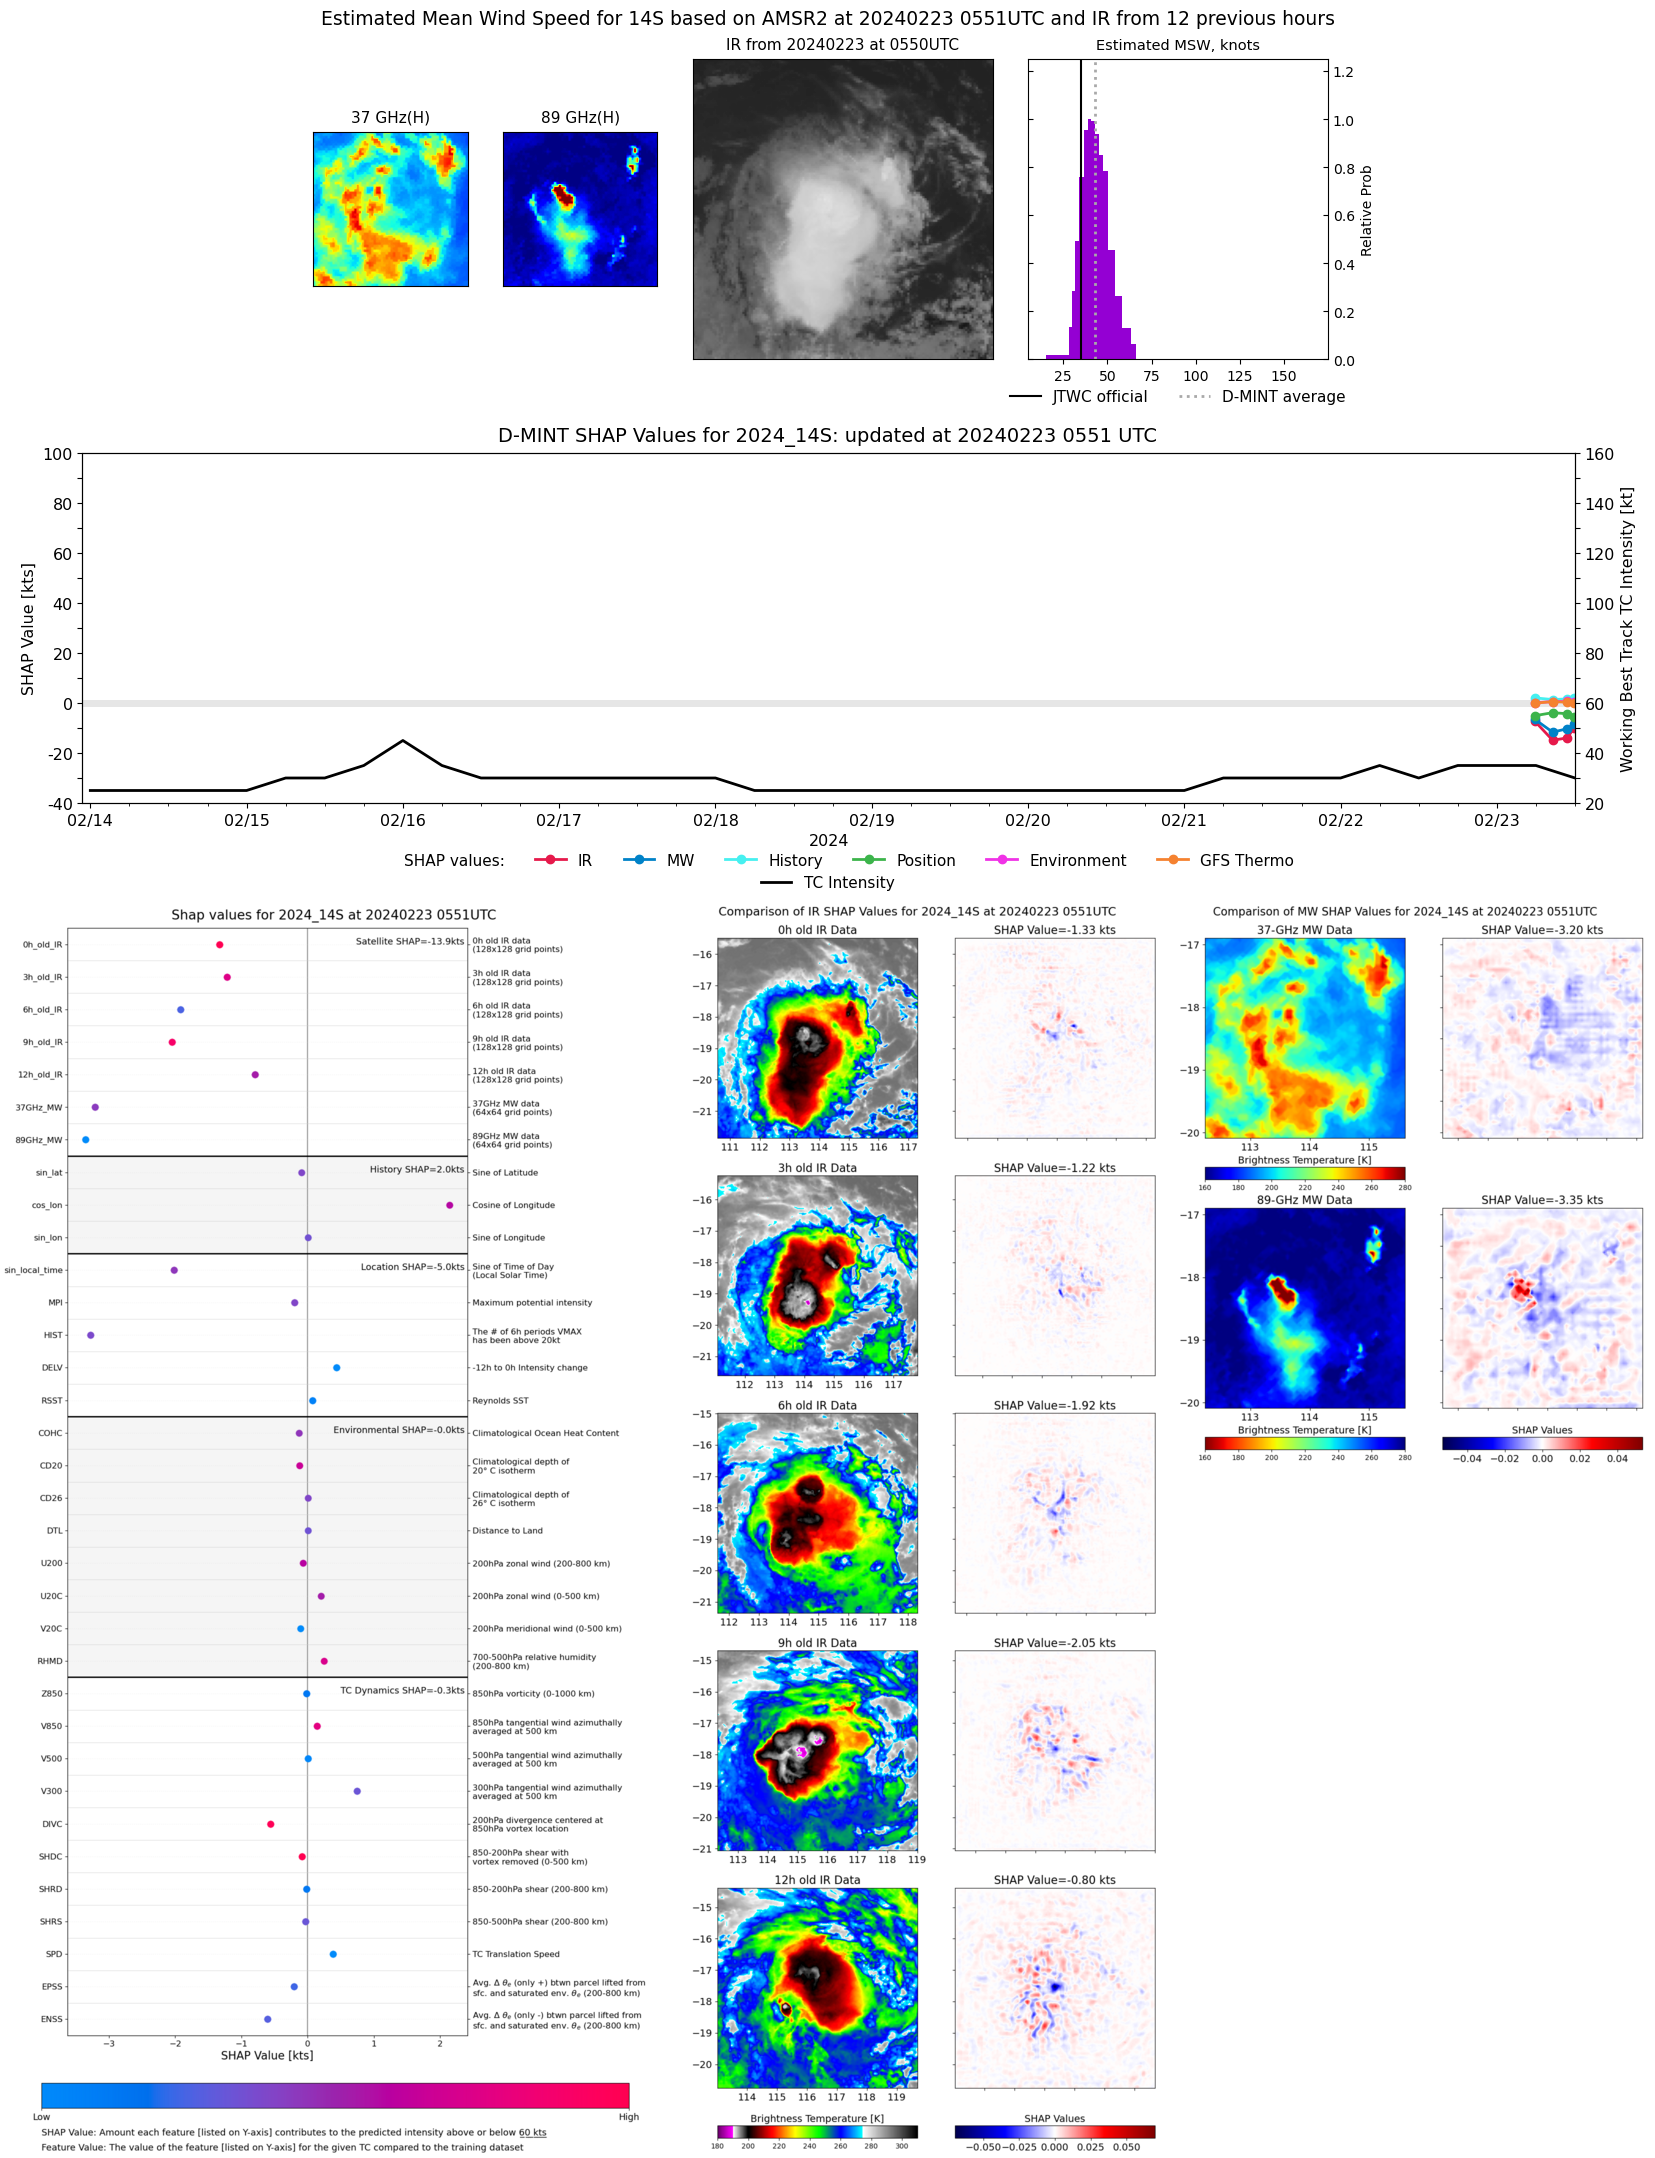 |
| 20240222 | 1739 UTC | AMSR2 | 989 hPa | 41 kts | 35 kts | 48 kts | 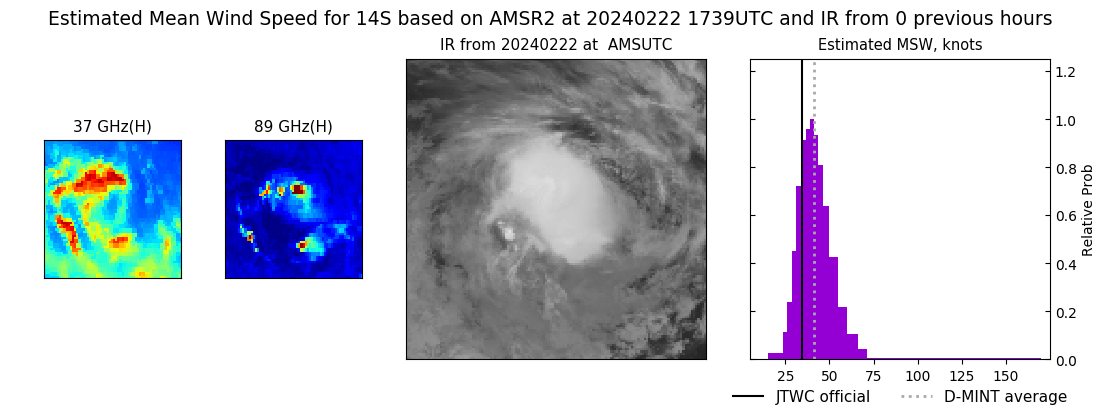 |