|
||

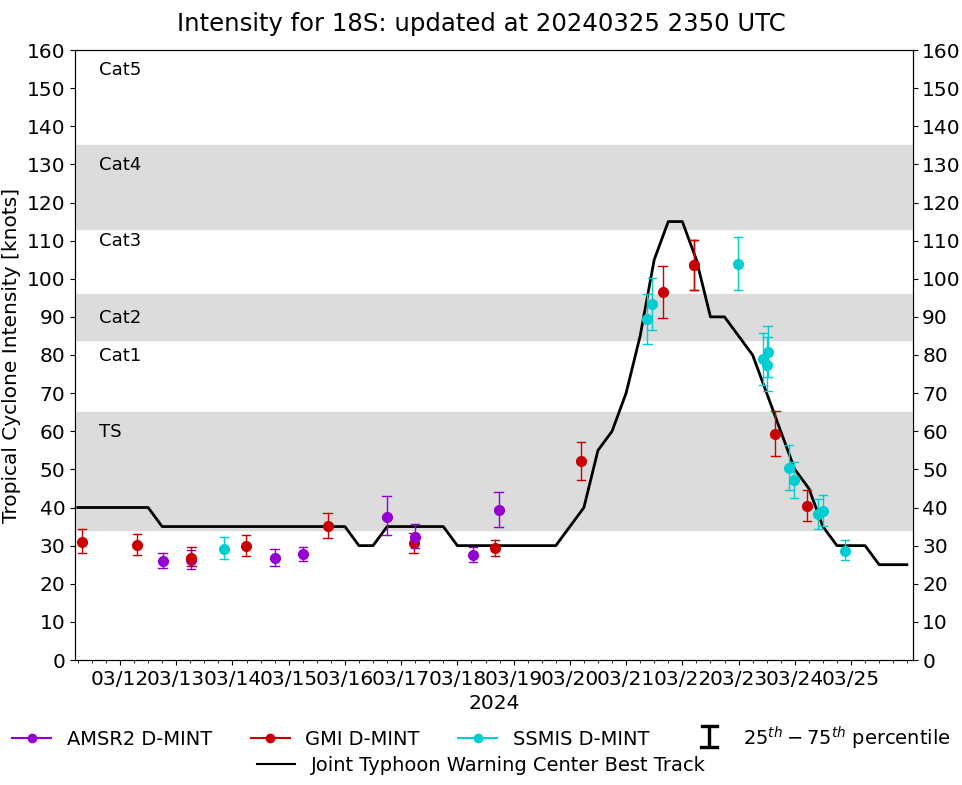 |
D-MINT HISTORY FILE for 2024_18S
| Date | Time | MW Sensor | MSLP | Vmax (30th-70th percentile average) | Vmax 25th percentile | Vmax 75th percentile | Image |
| 20240324 | 2121 UTC | SSMISF18 | 1004 hPa | 29 kts | 26 kts | 31 kts | 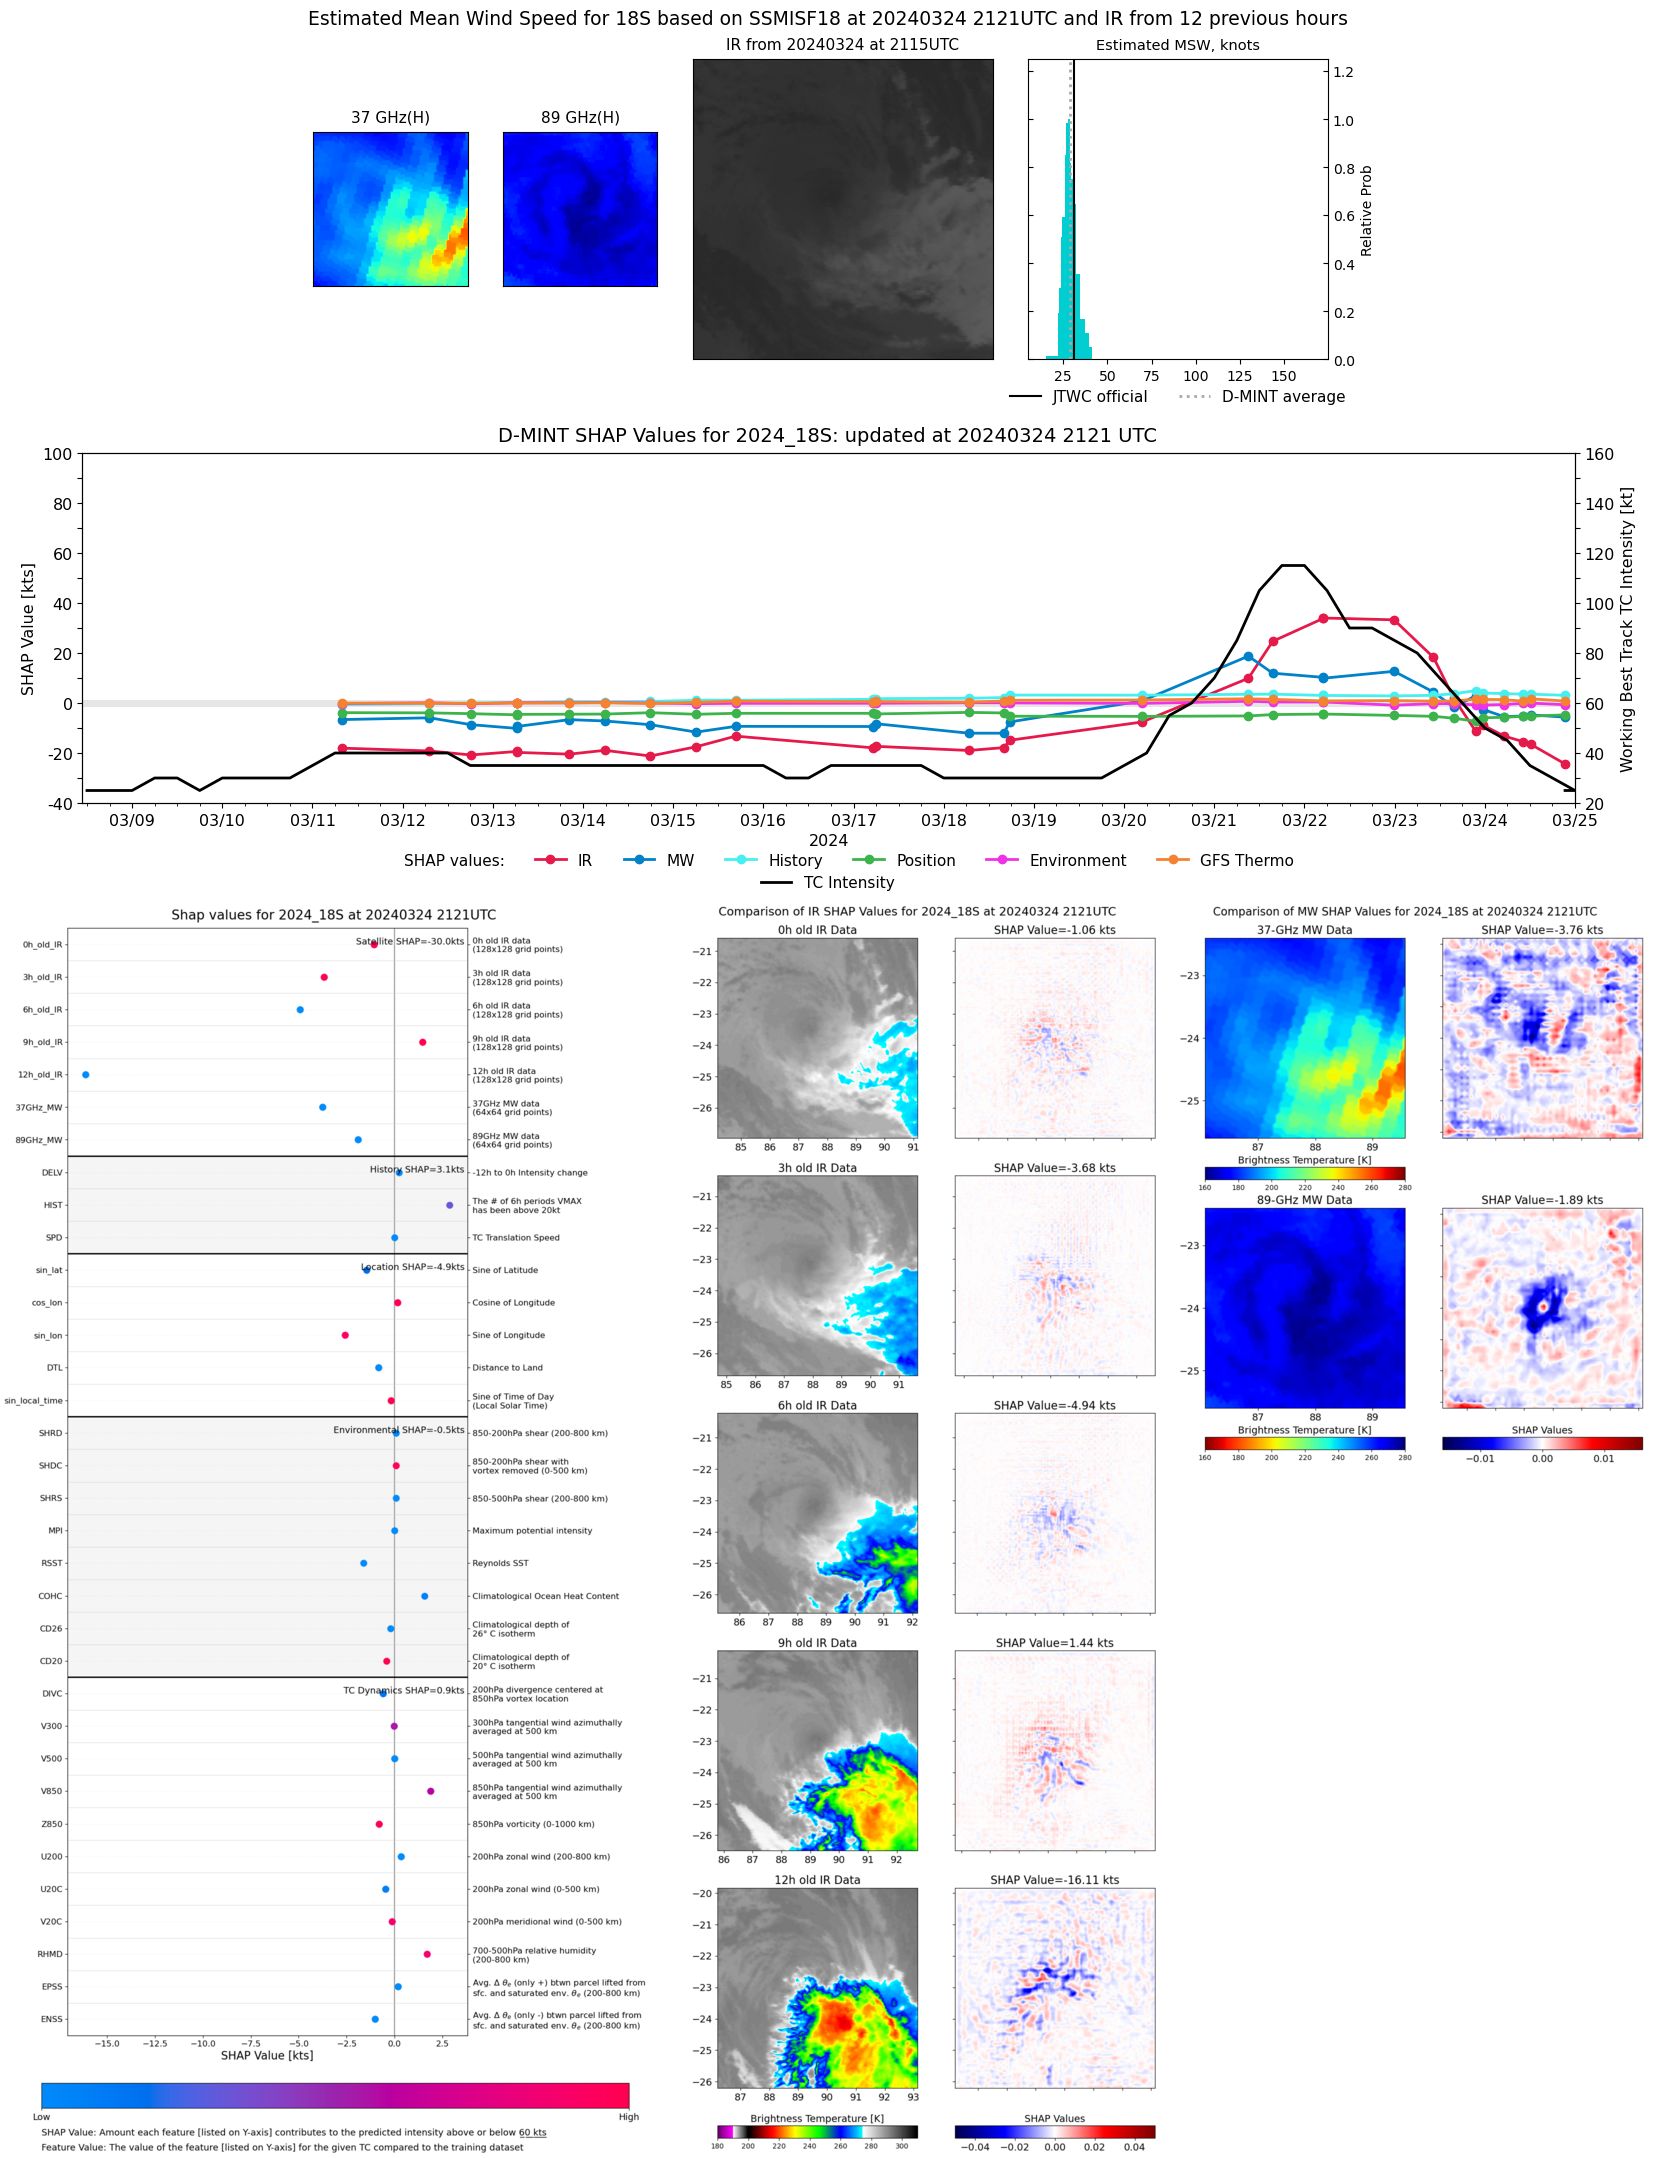 |
| 20240324 | 1210 UTC | SSMISF17 | 1001 hPa | 39 kts | 35 kts | 43 kts |  |
| 20240324 | 1005 UTC | SSMISF18 | 999 hPa | 38 kts | 34 kts | 42 kts | 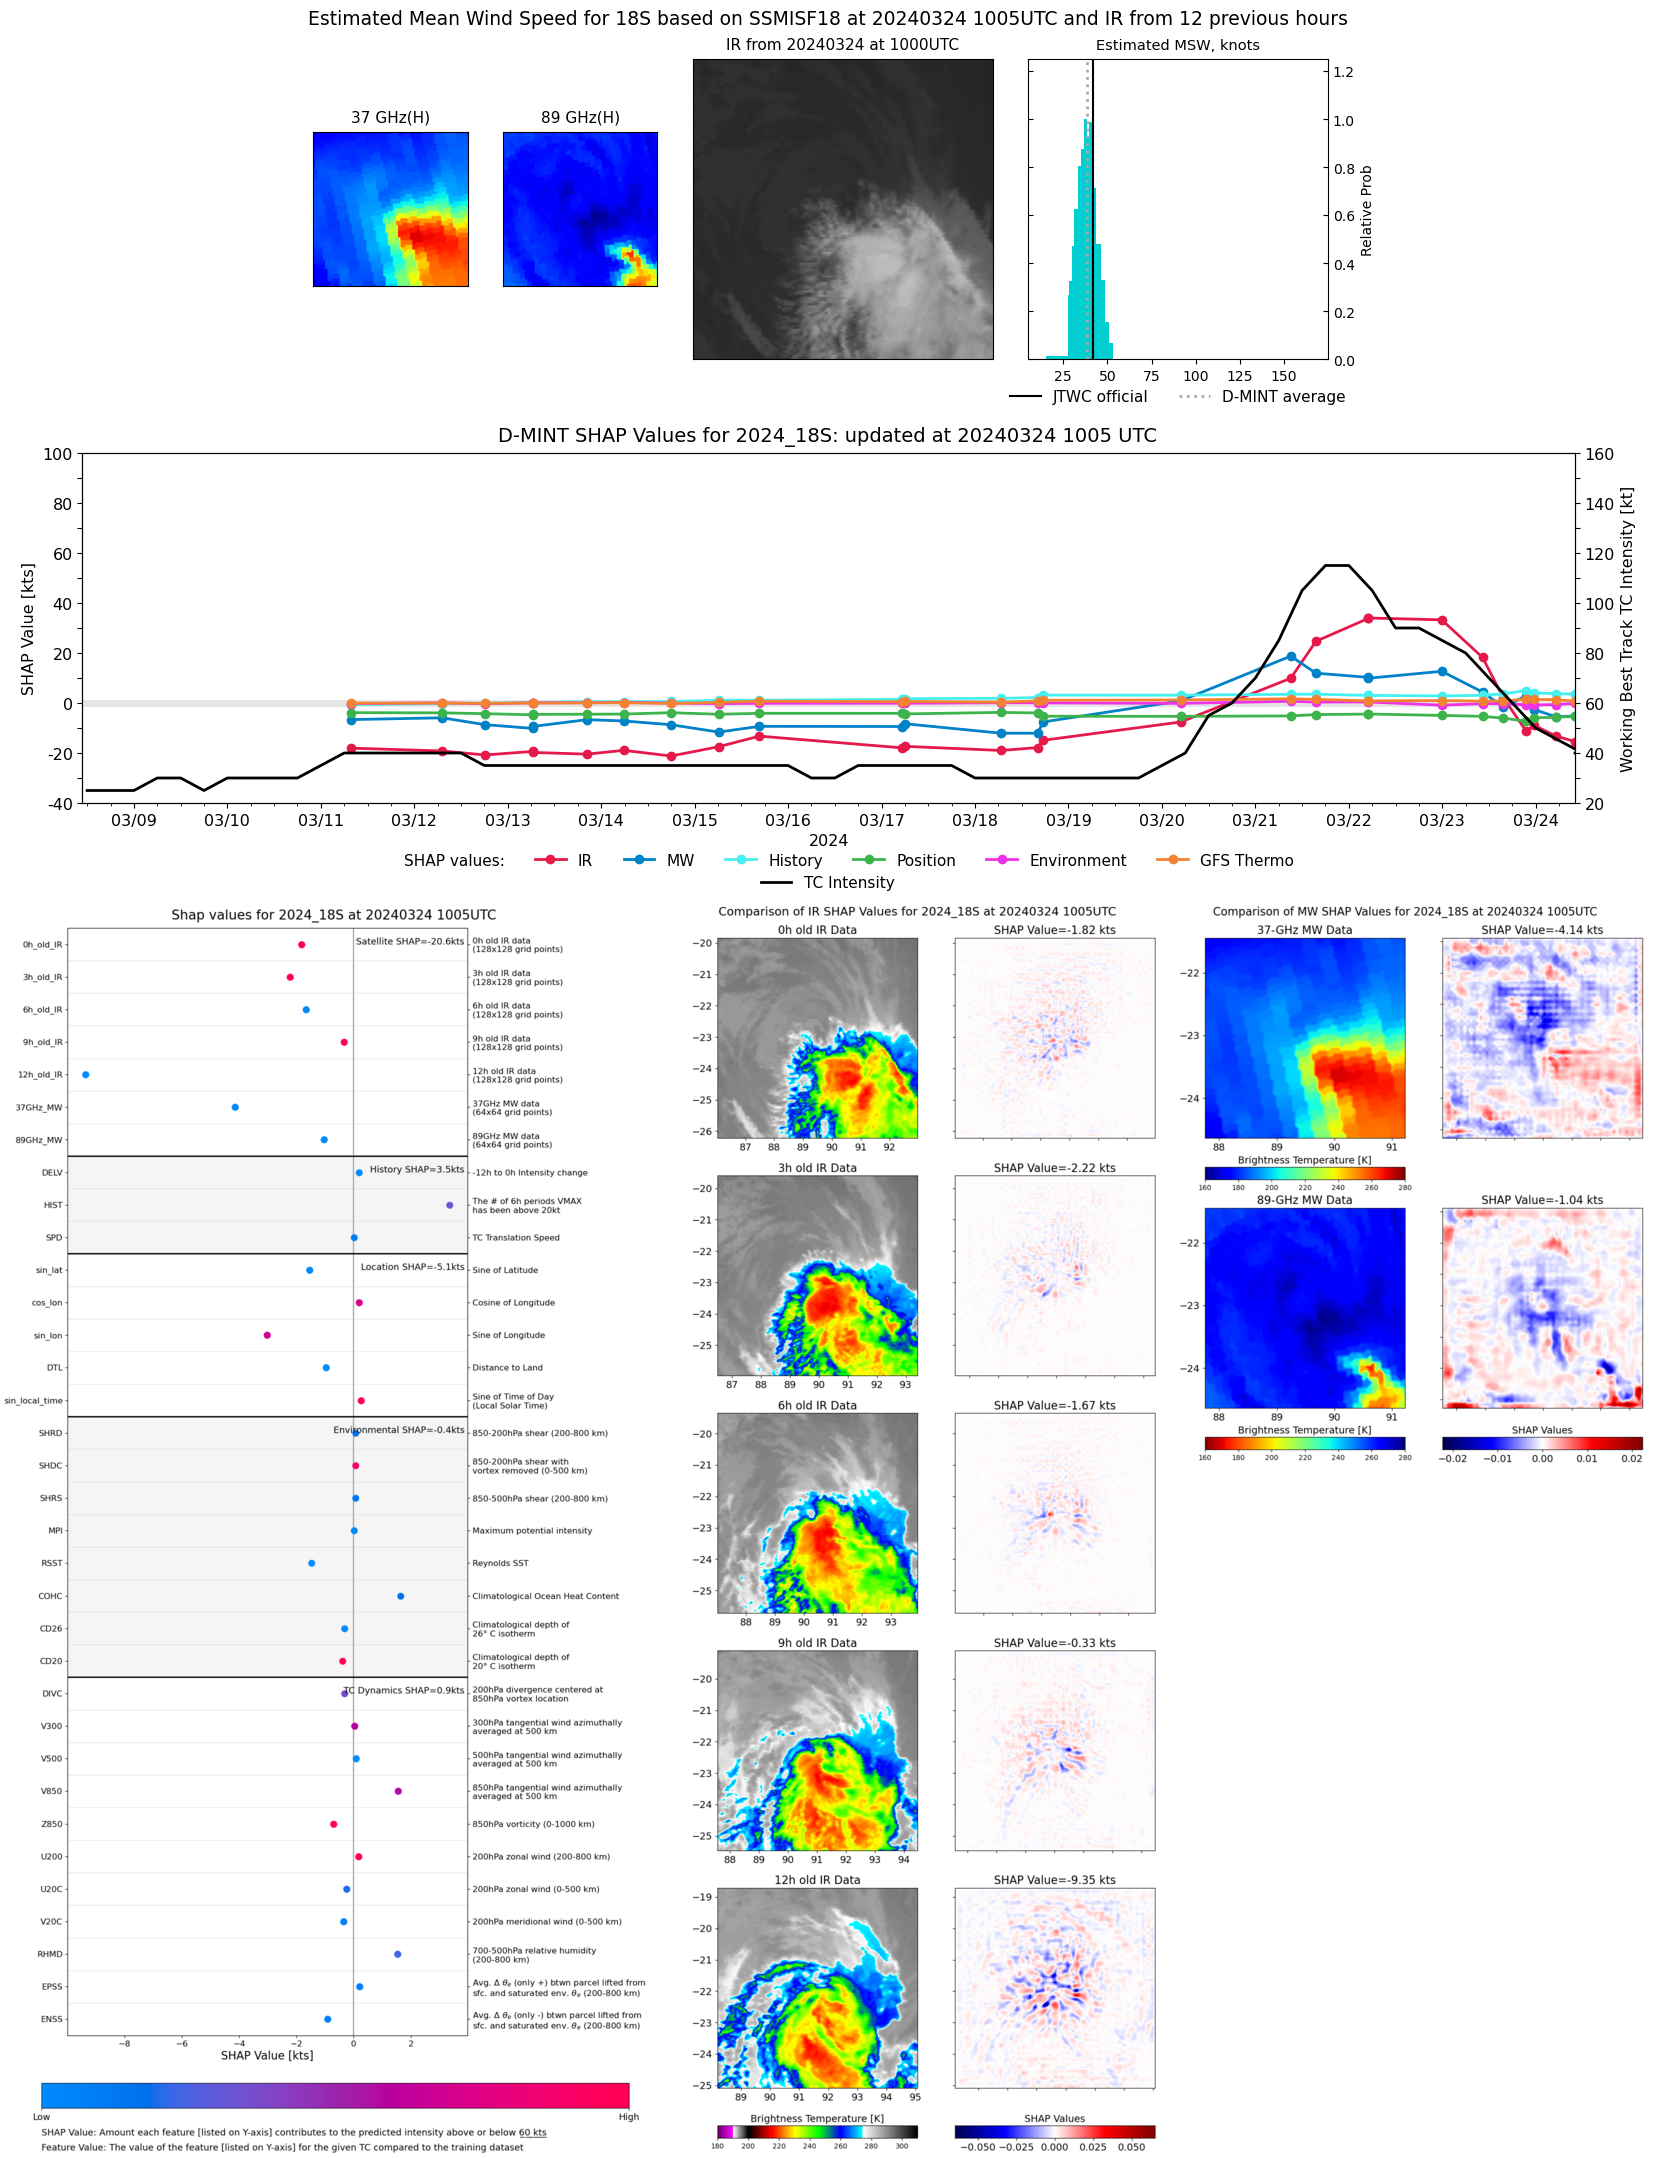 |
| 20240324 | 0508 UTC | GMI | 995 hPa | 40 kts | 36 kts | 44 kts | 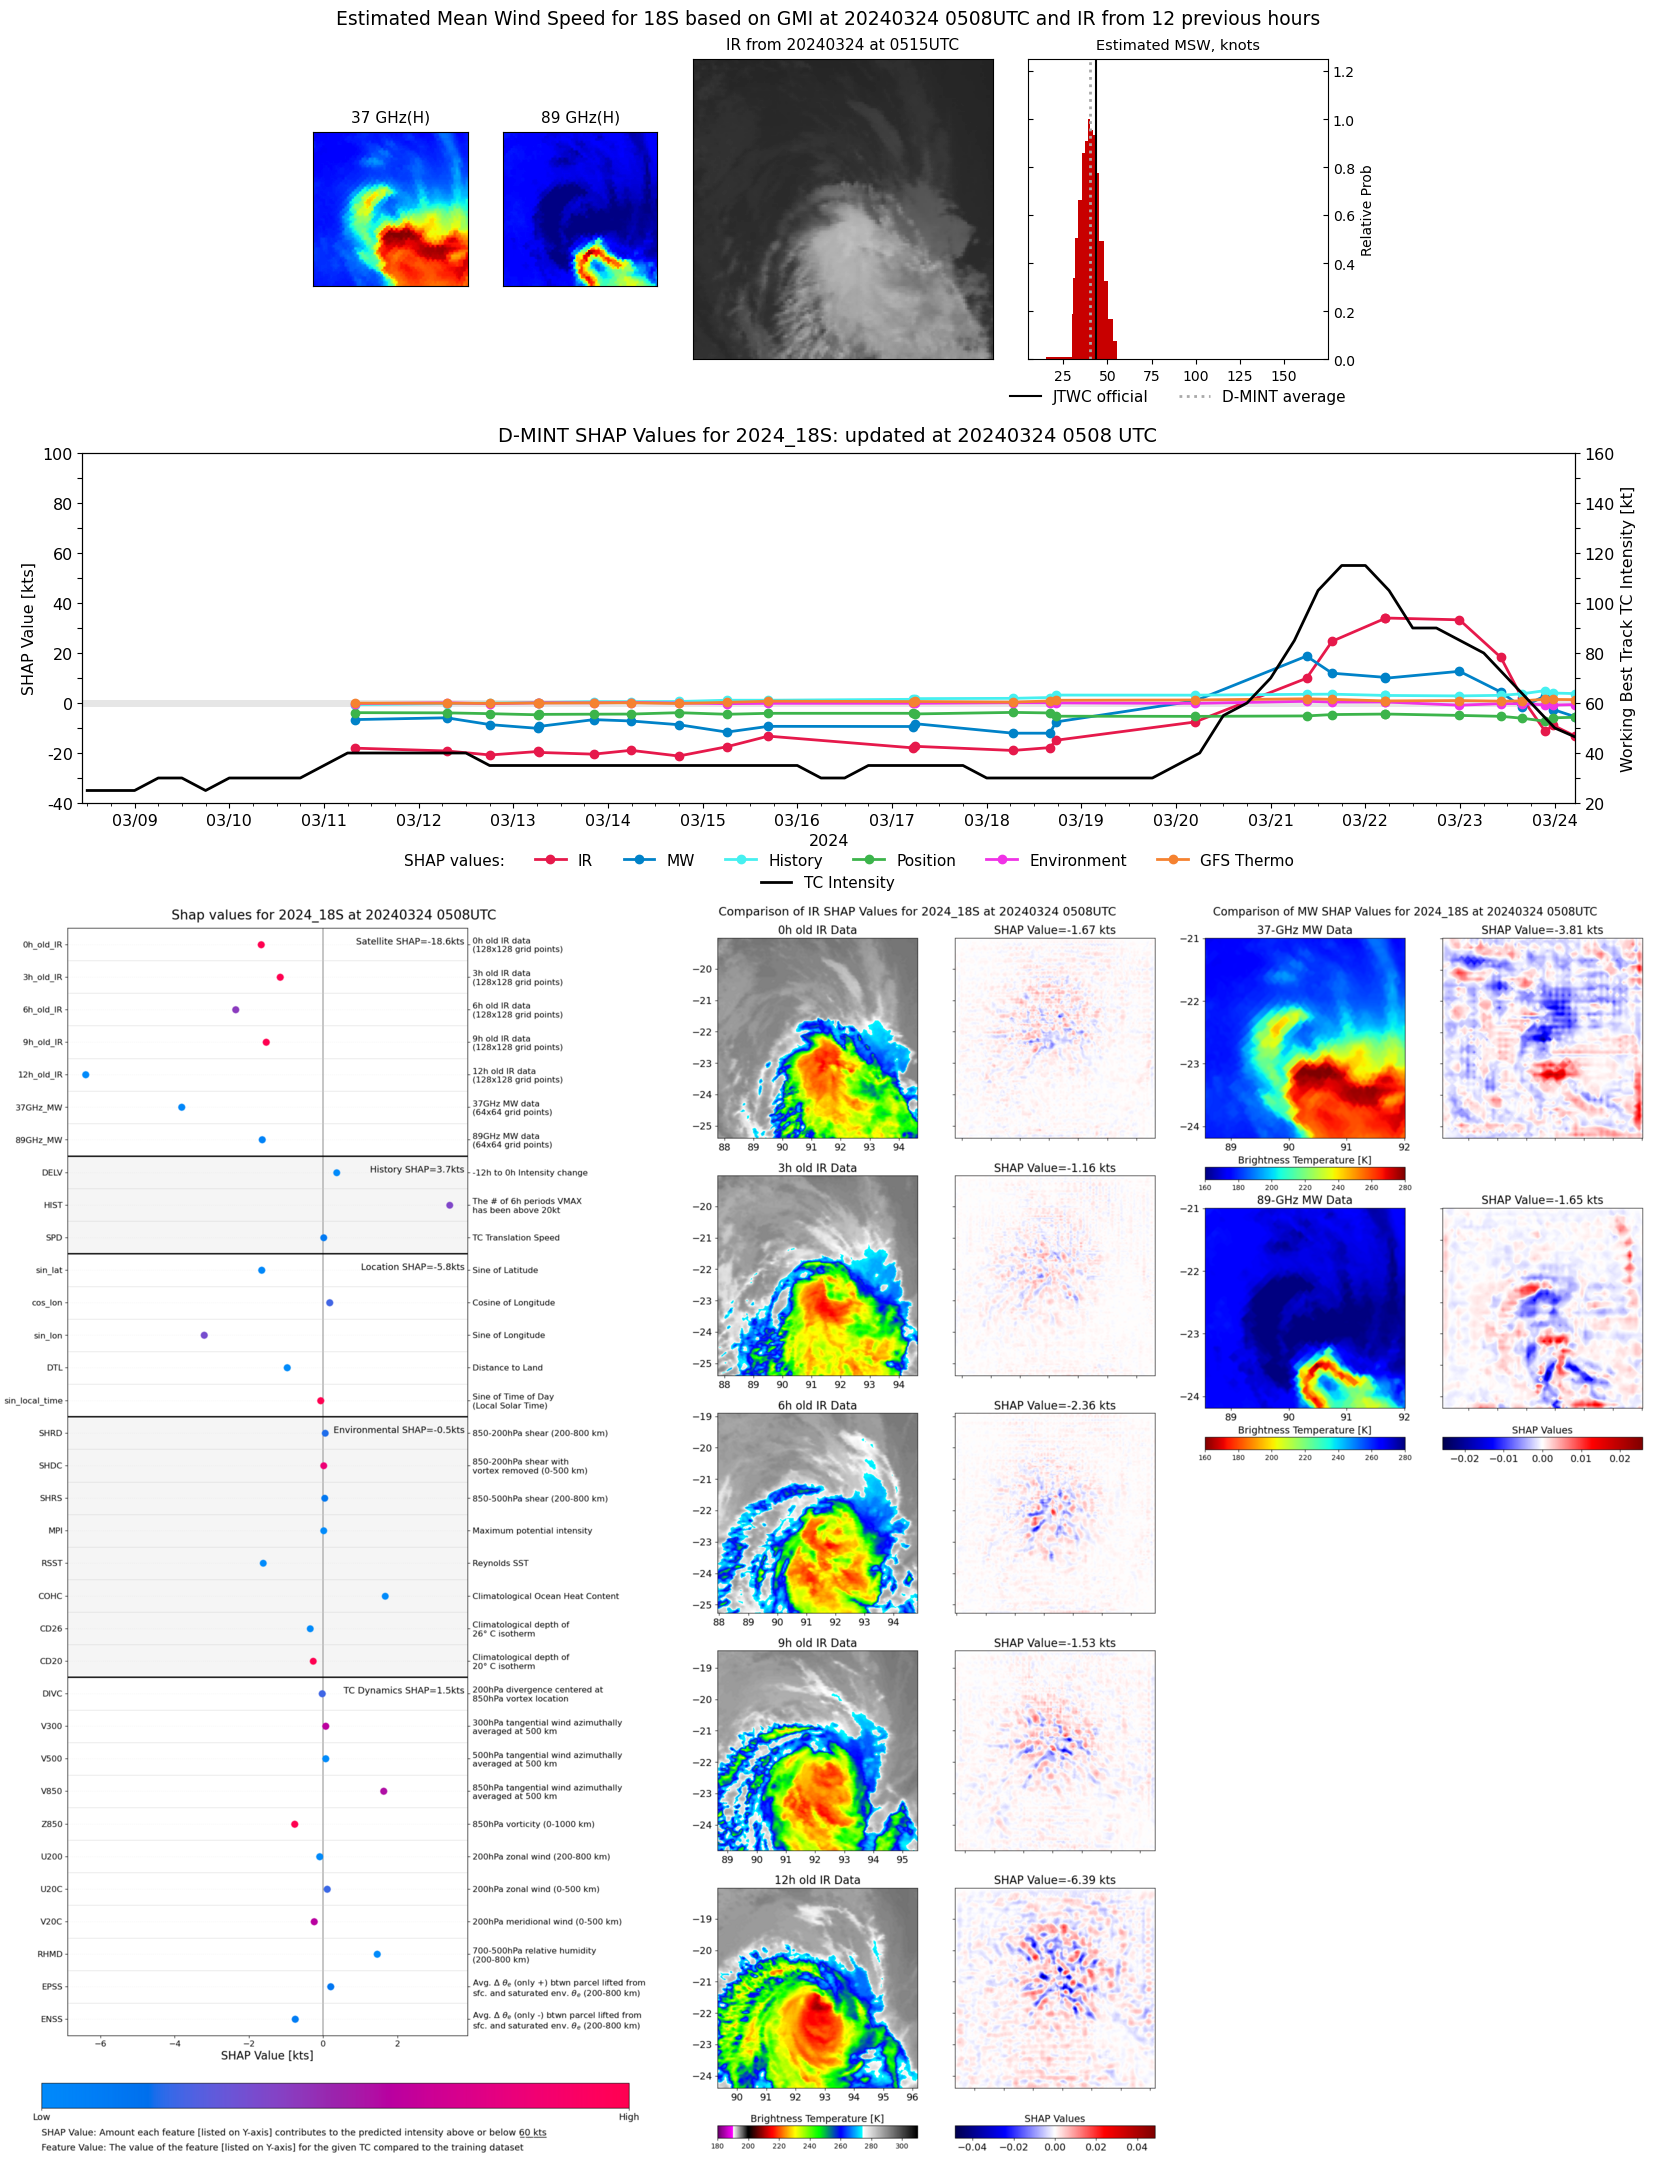 |
| 20240323 | 2338 UTC | SSMISF17 | 991 hPa | 47 kts | 42 kts | 52 kts |  |
| 20240323 | 2134 UTC | SSMISF18 | 993 hPa | 50 kts | 44 kts | 56 kts | 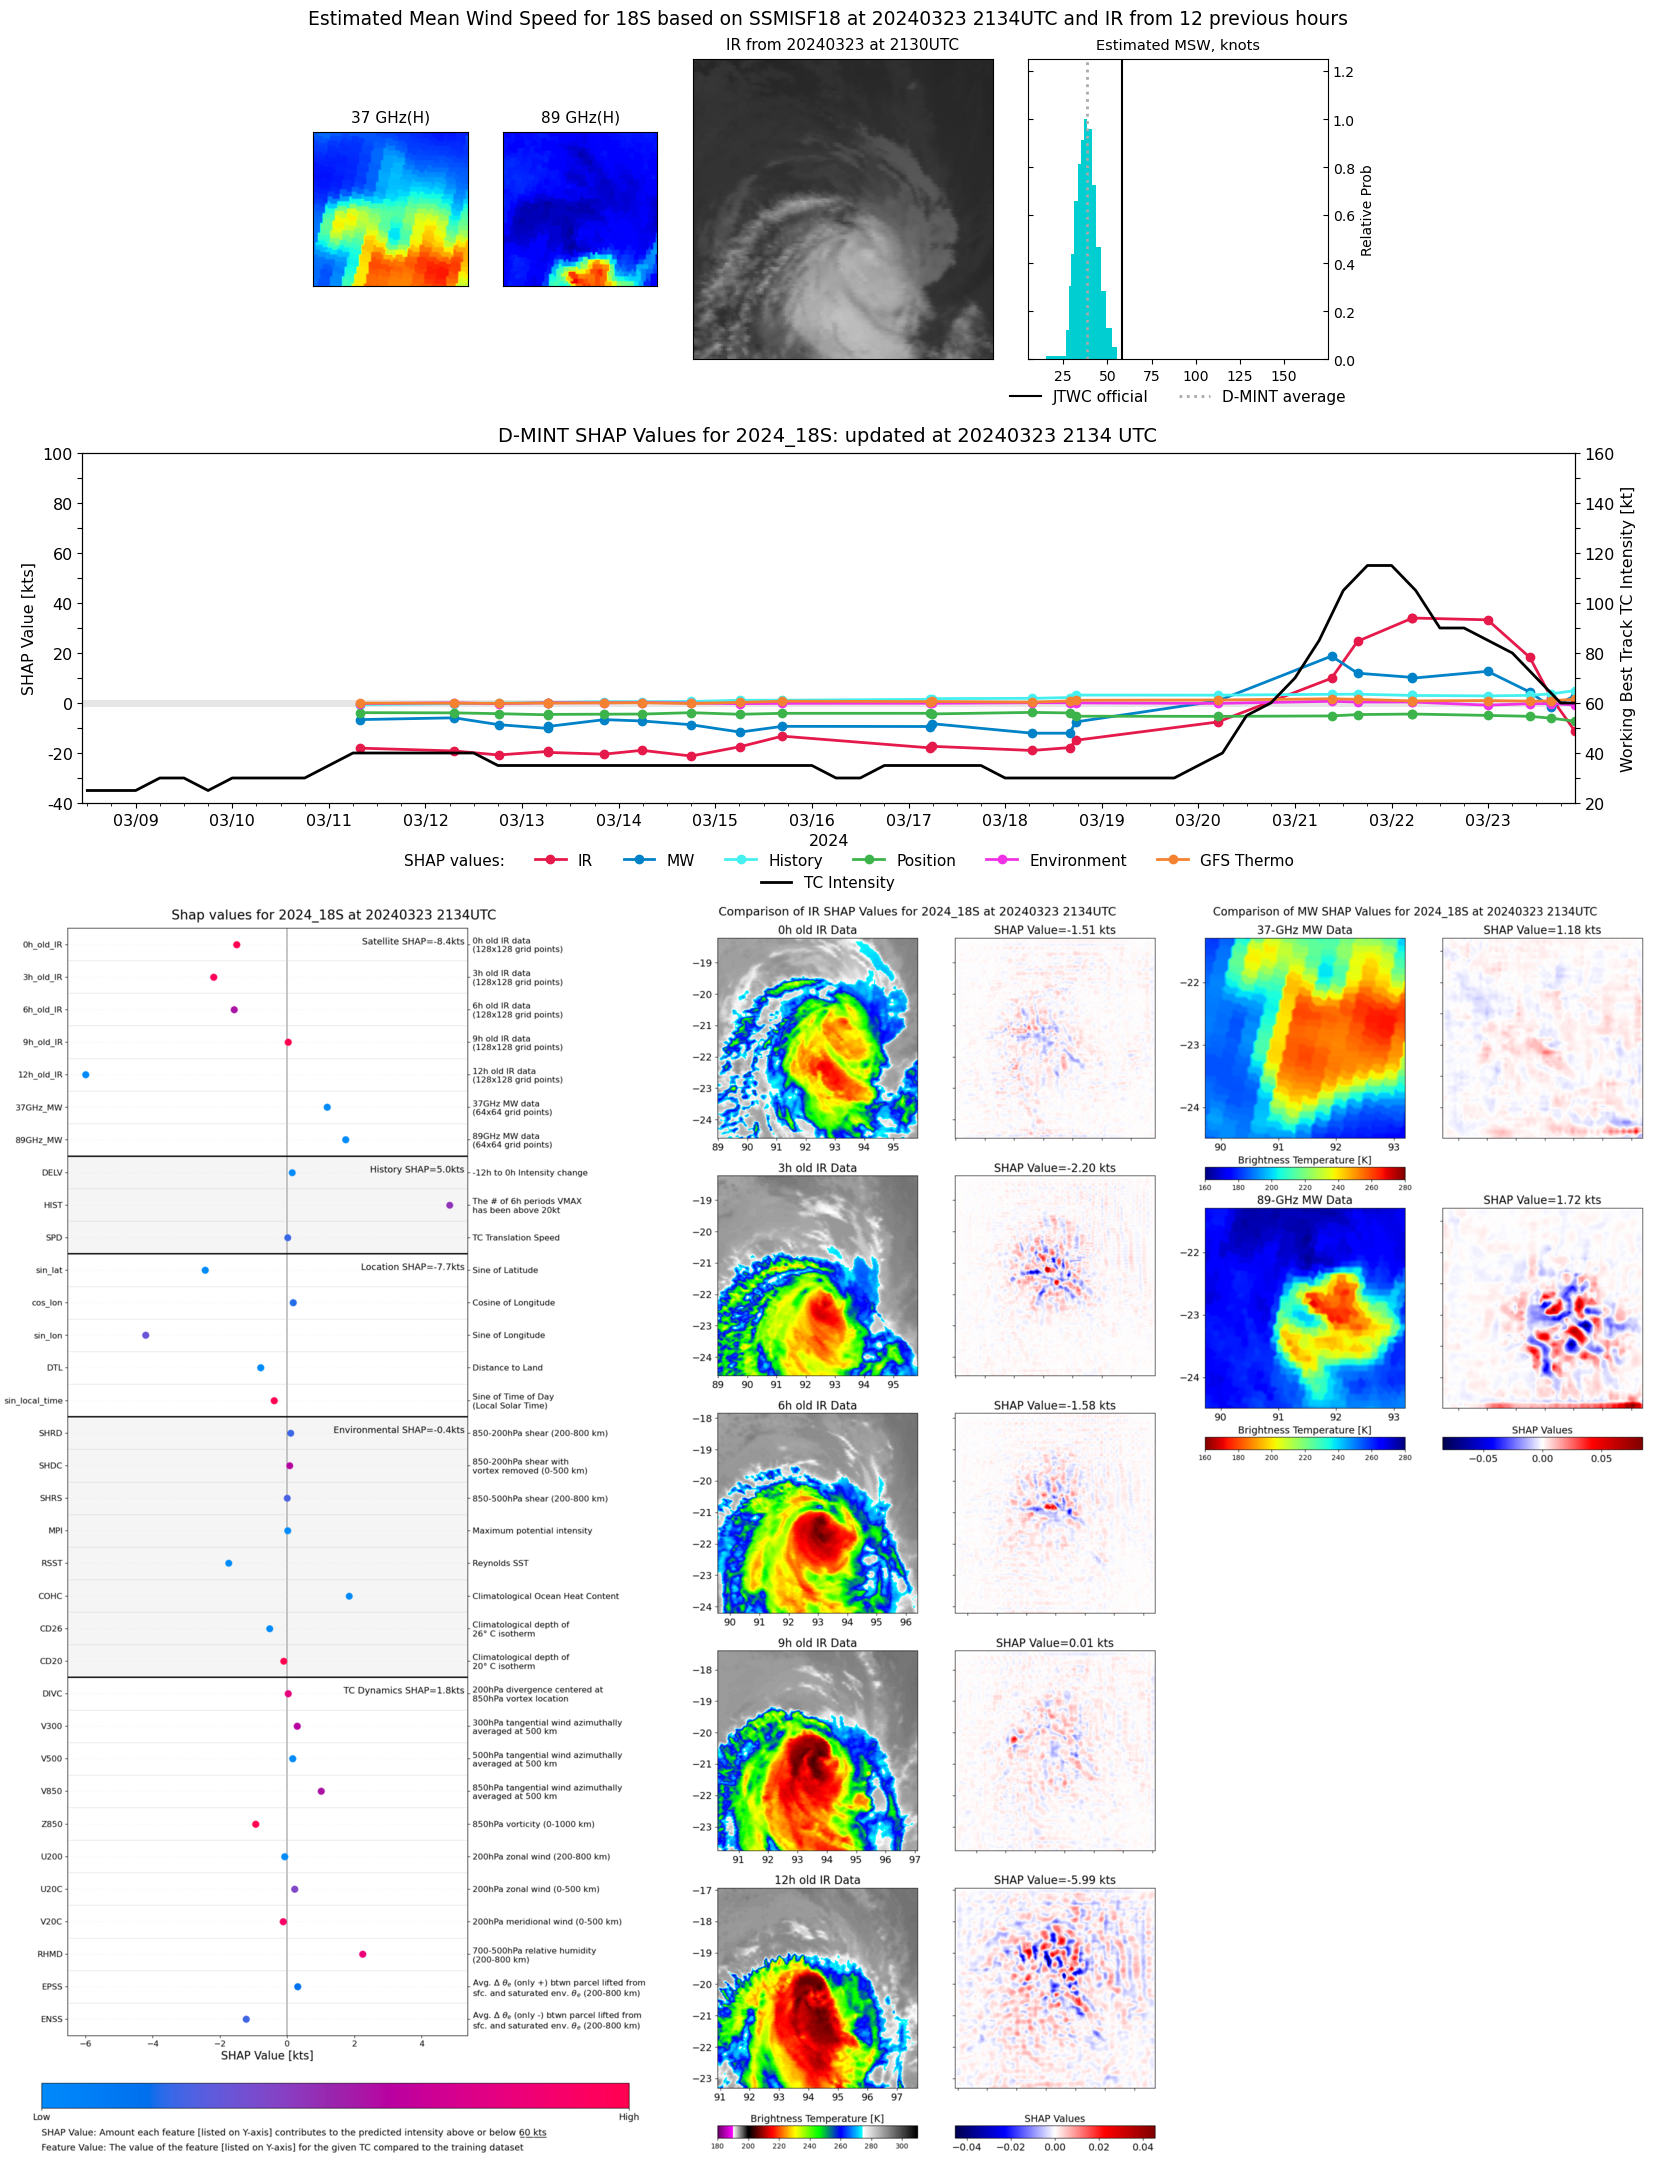 |
| 20240323 | 1543 UTC | GMI | 982 hPa | 59 kts | 53 kts | 65 kts | 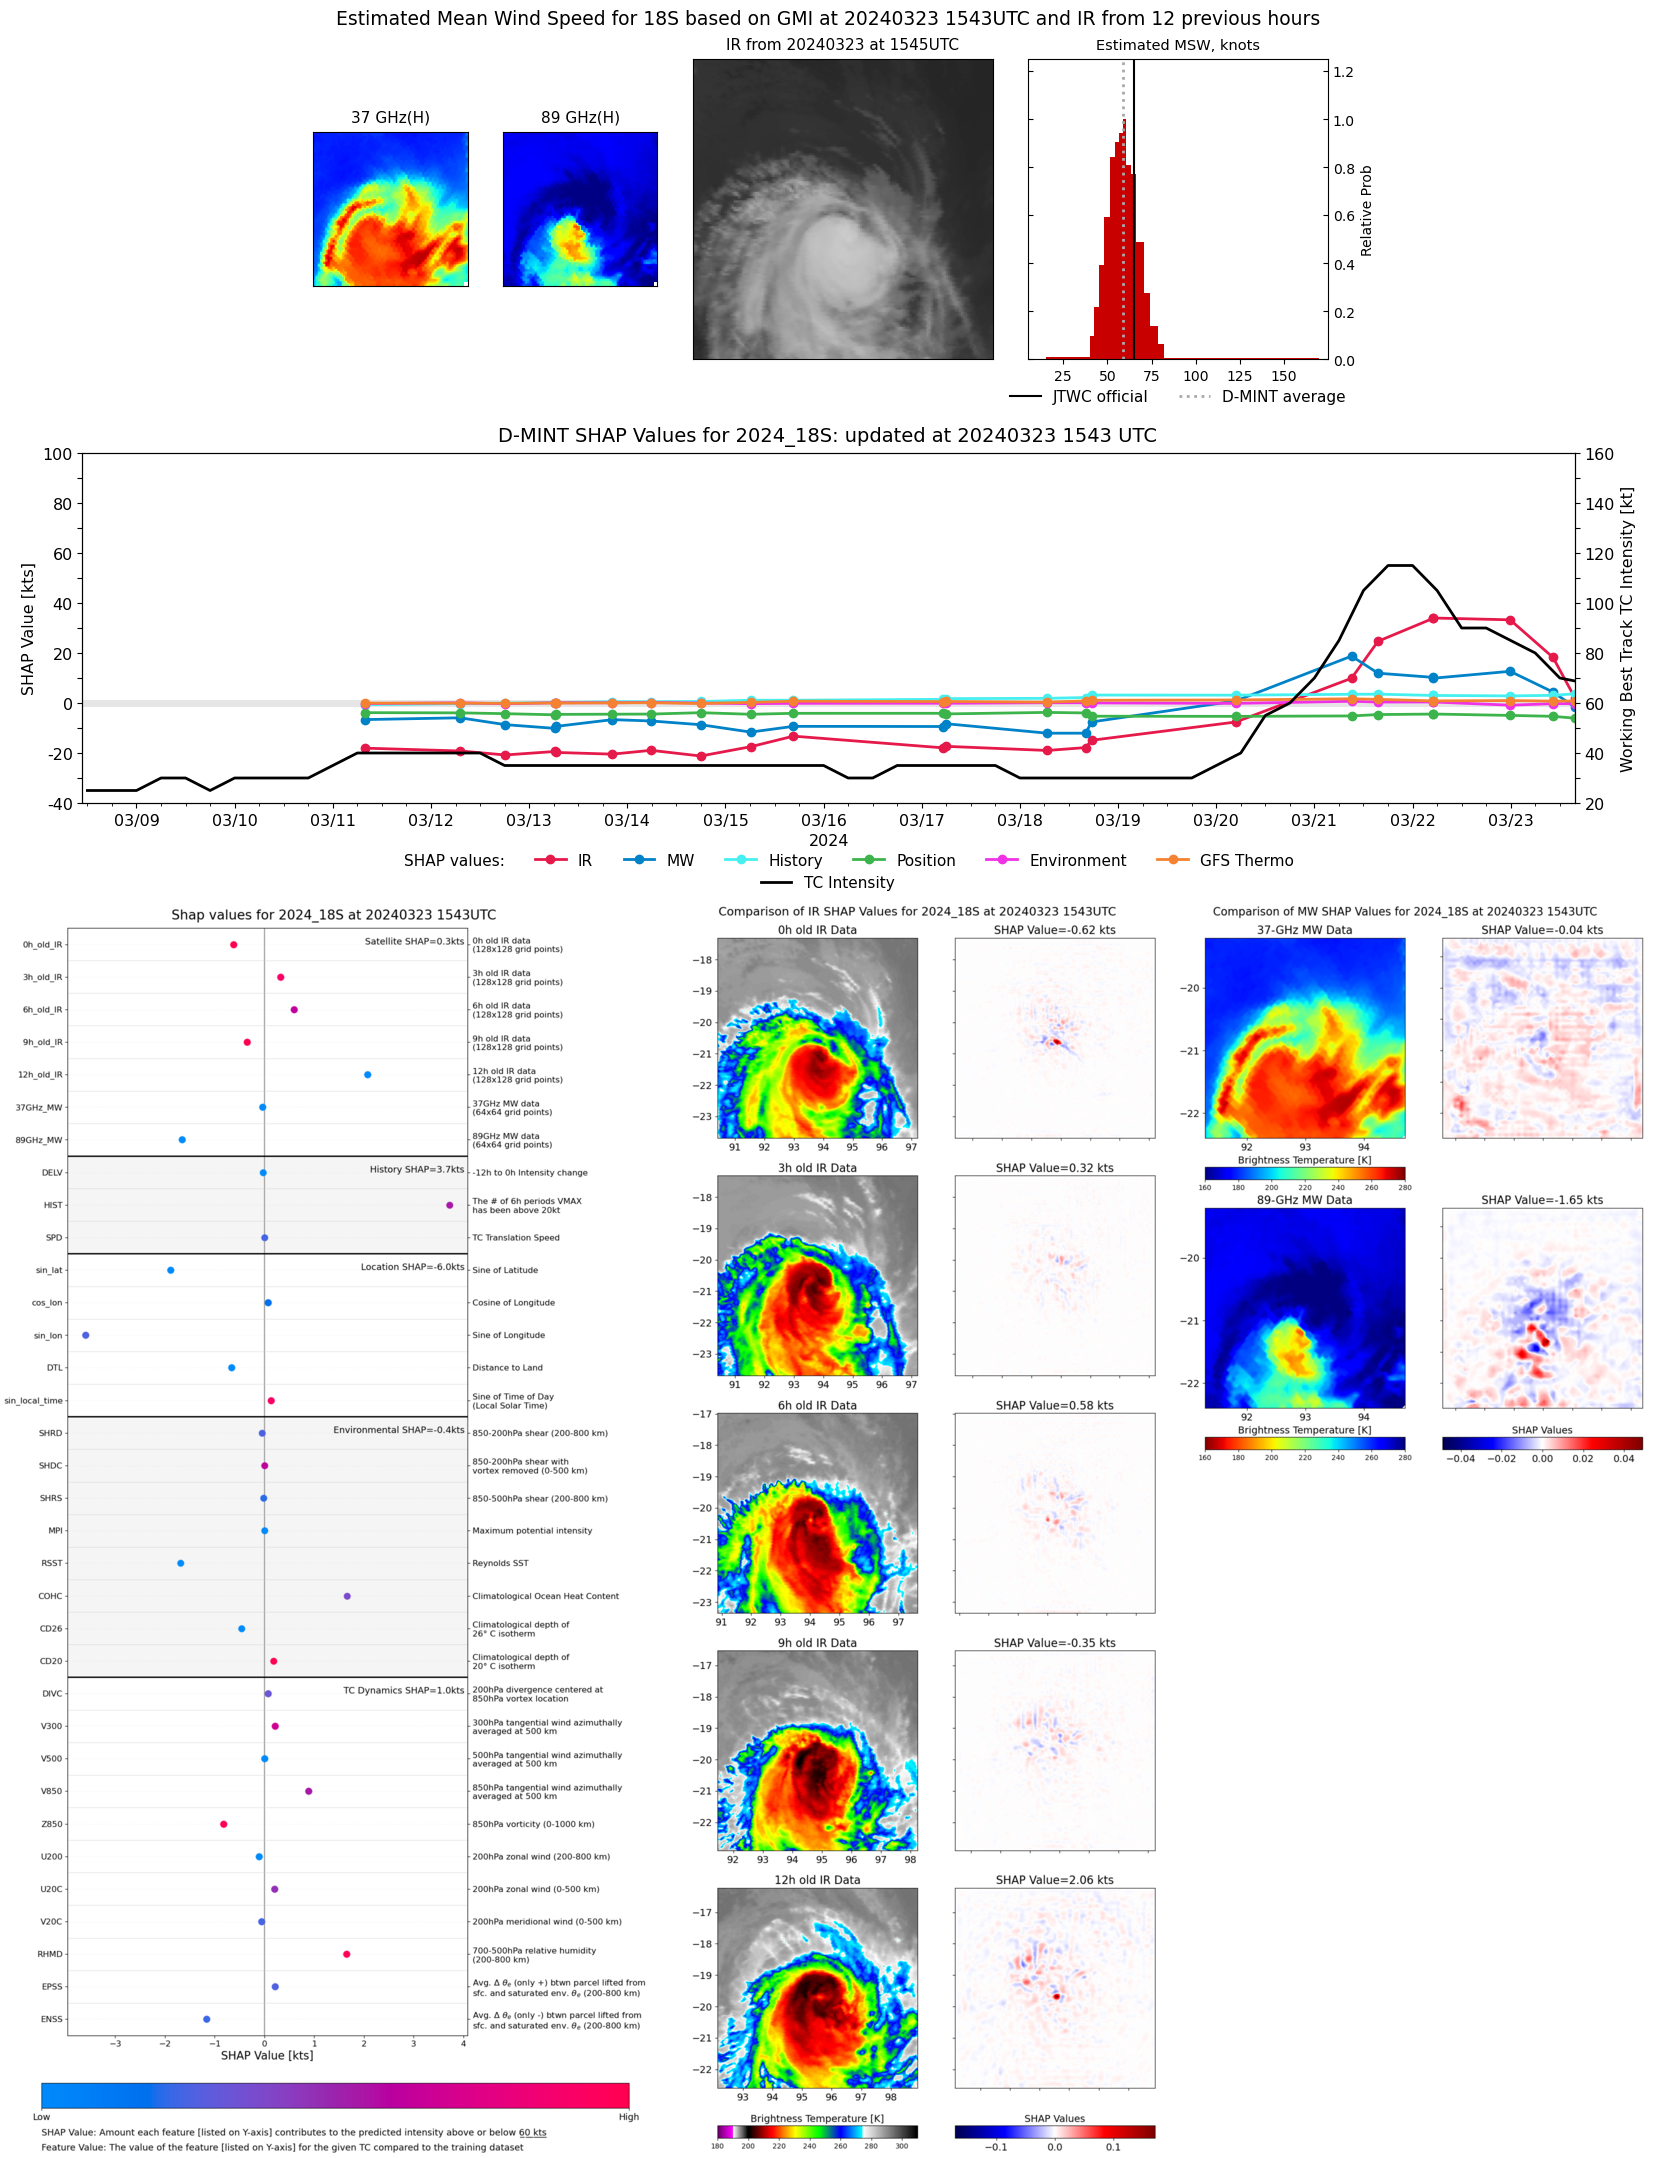 |
| 20240323 | 1224 UTC | SSMISF17 | 969 hPa | 81 kts | 74 kts | 88 kts | 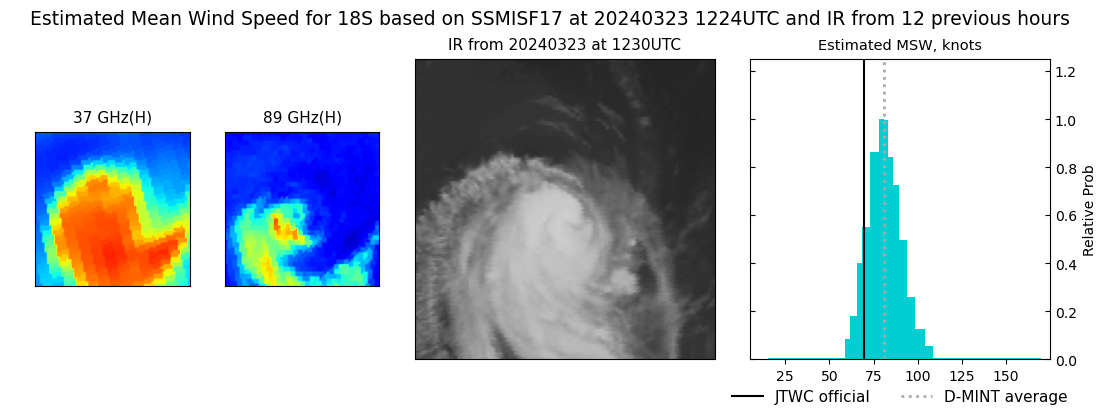 |
| 20240323 | 1217 UTC | SSMISF16 | 980 hPa | 77 kts | 71 kts | 85 kts | 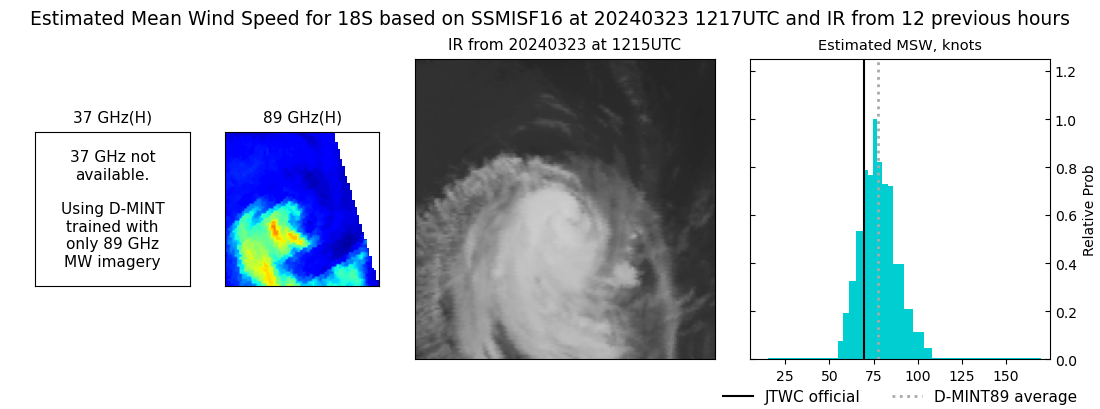 |
| 20240323 | 1020 UTC | SSMISF18 | 972 hPa | 79 kts | 72 kts | 86 kts | 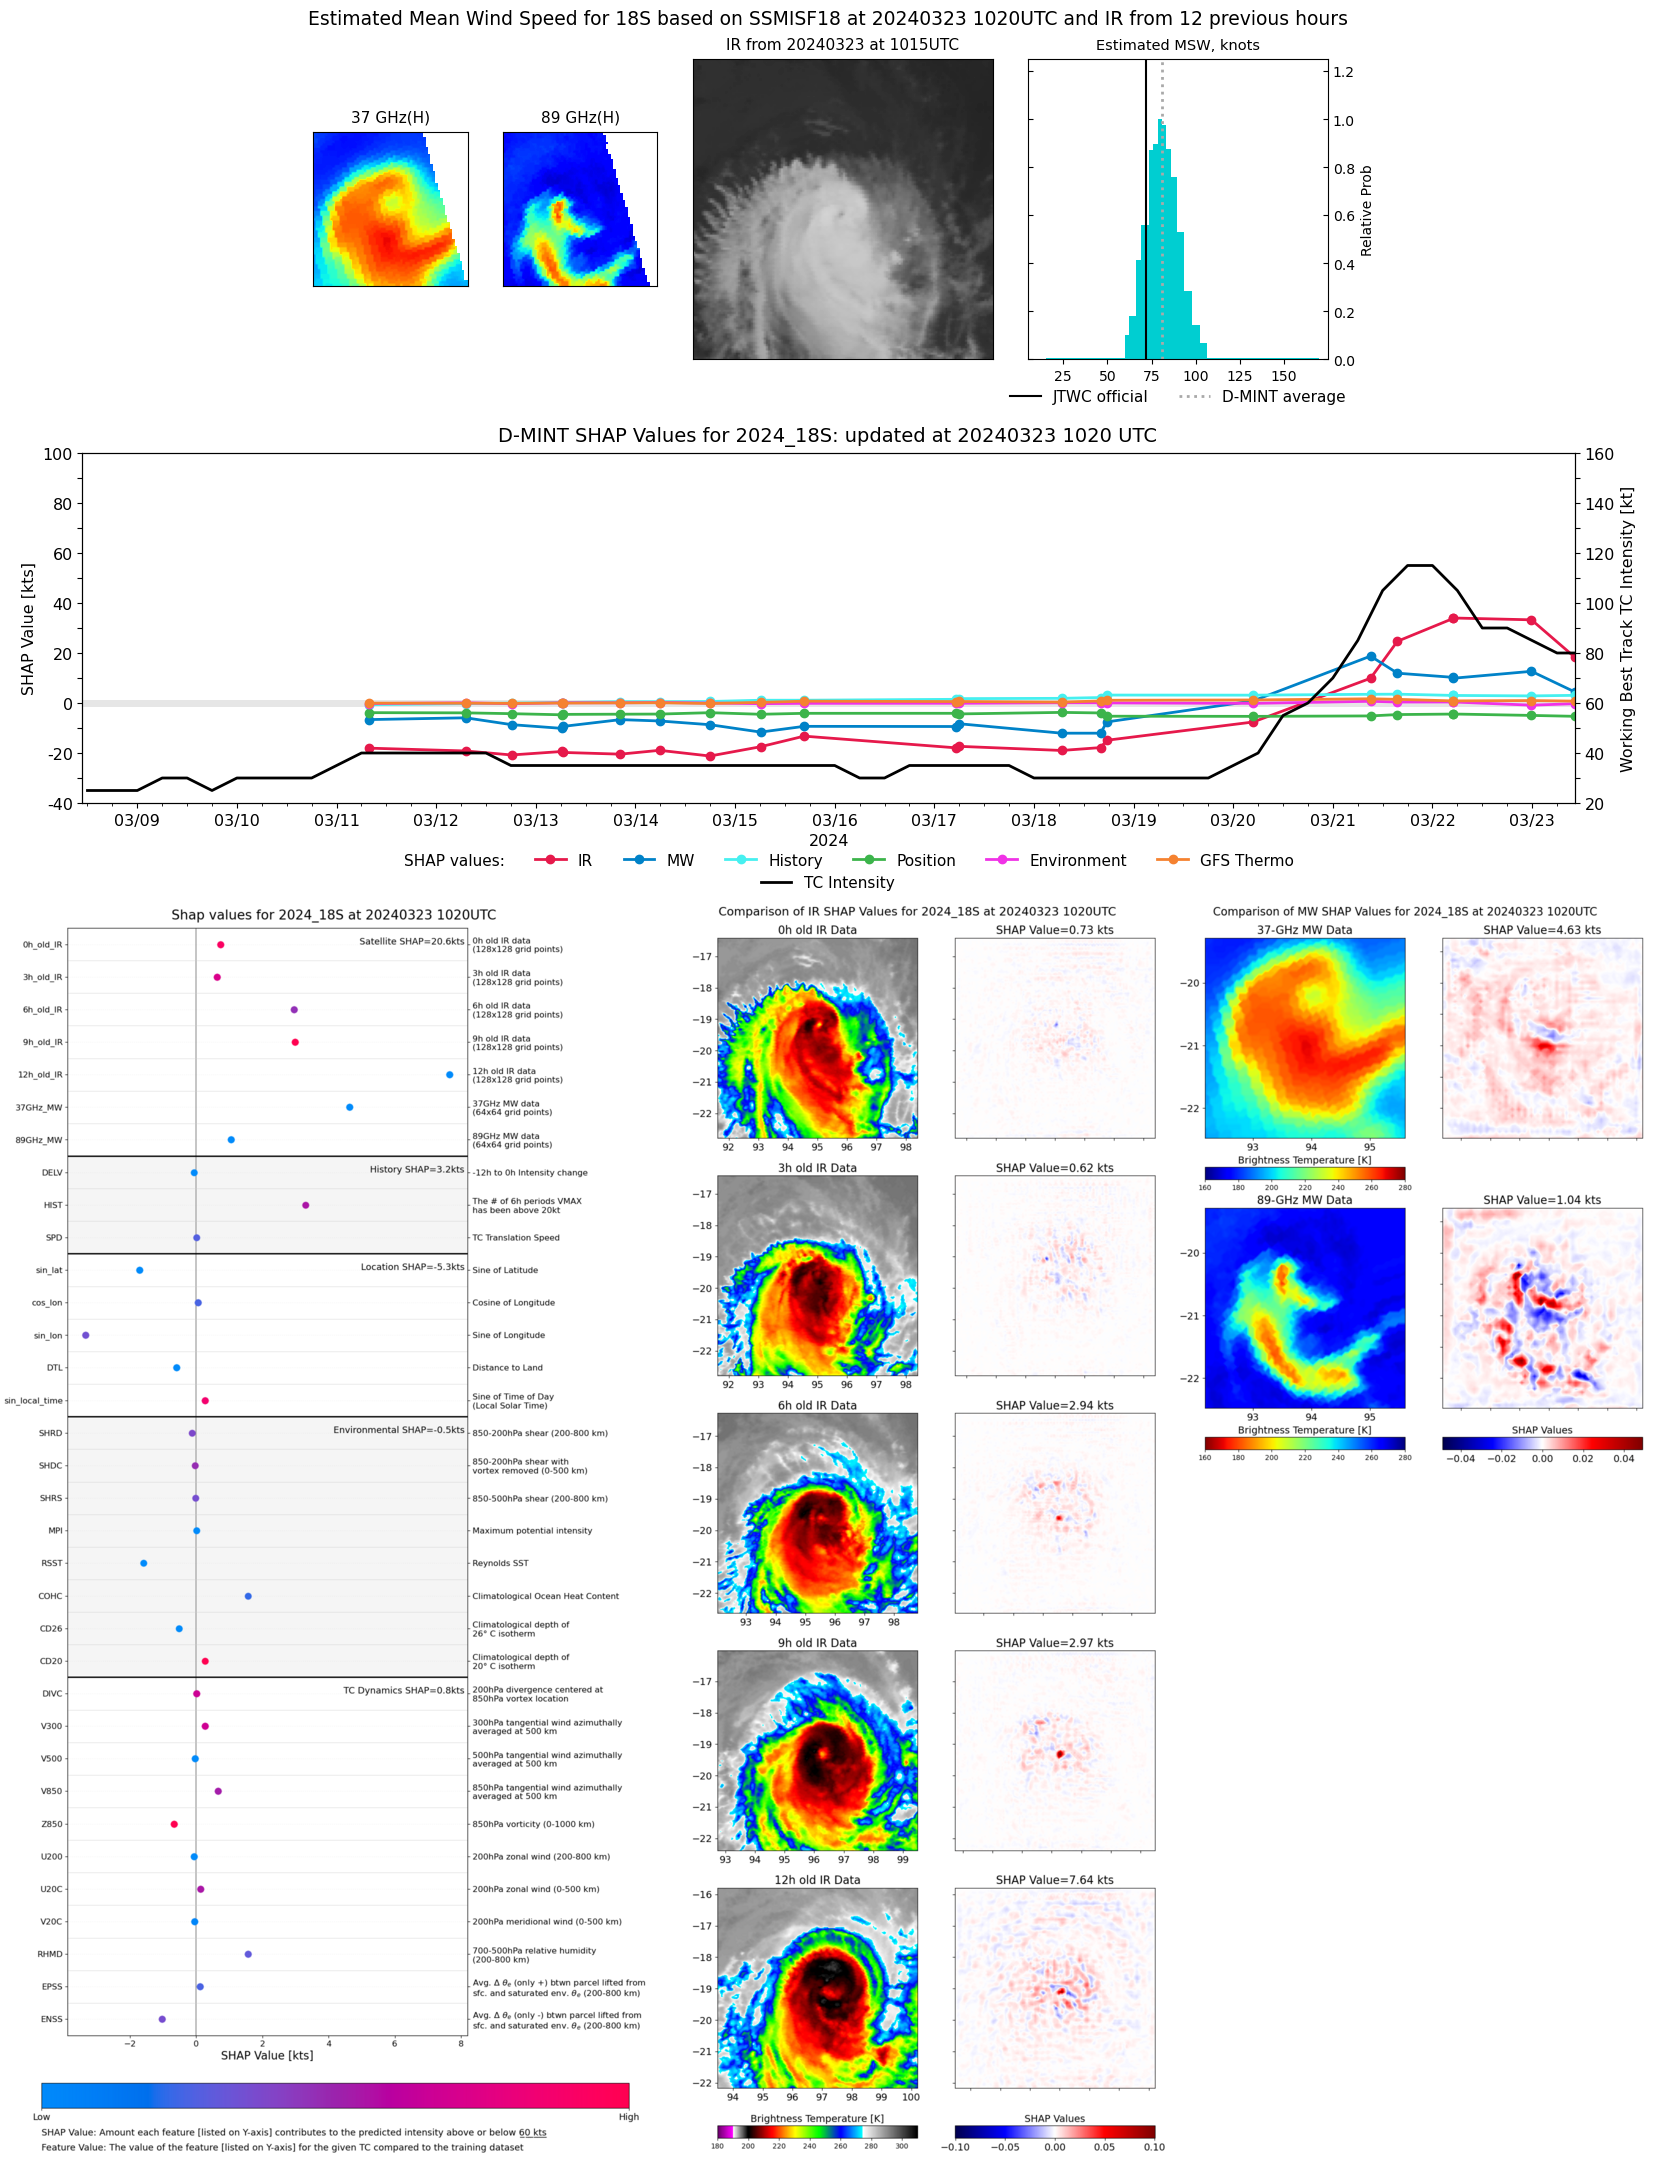 |
| 20240322 | 2351 UTC | SSMISF17 | 949 hPa | 104 kts | 97 kts | 111 kts | 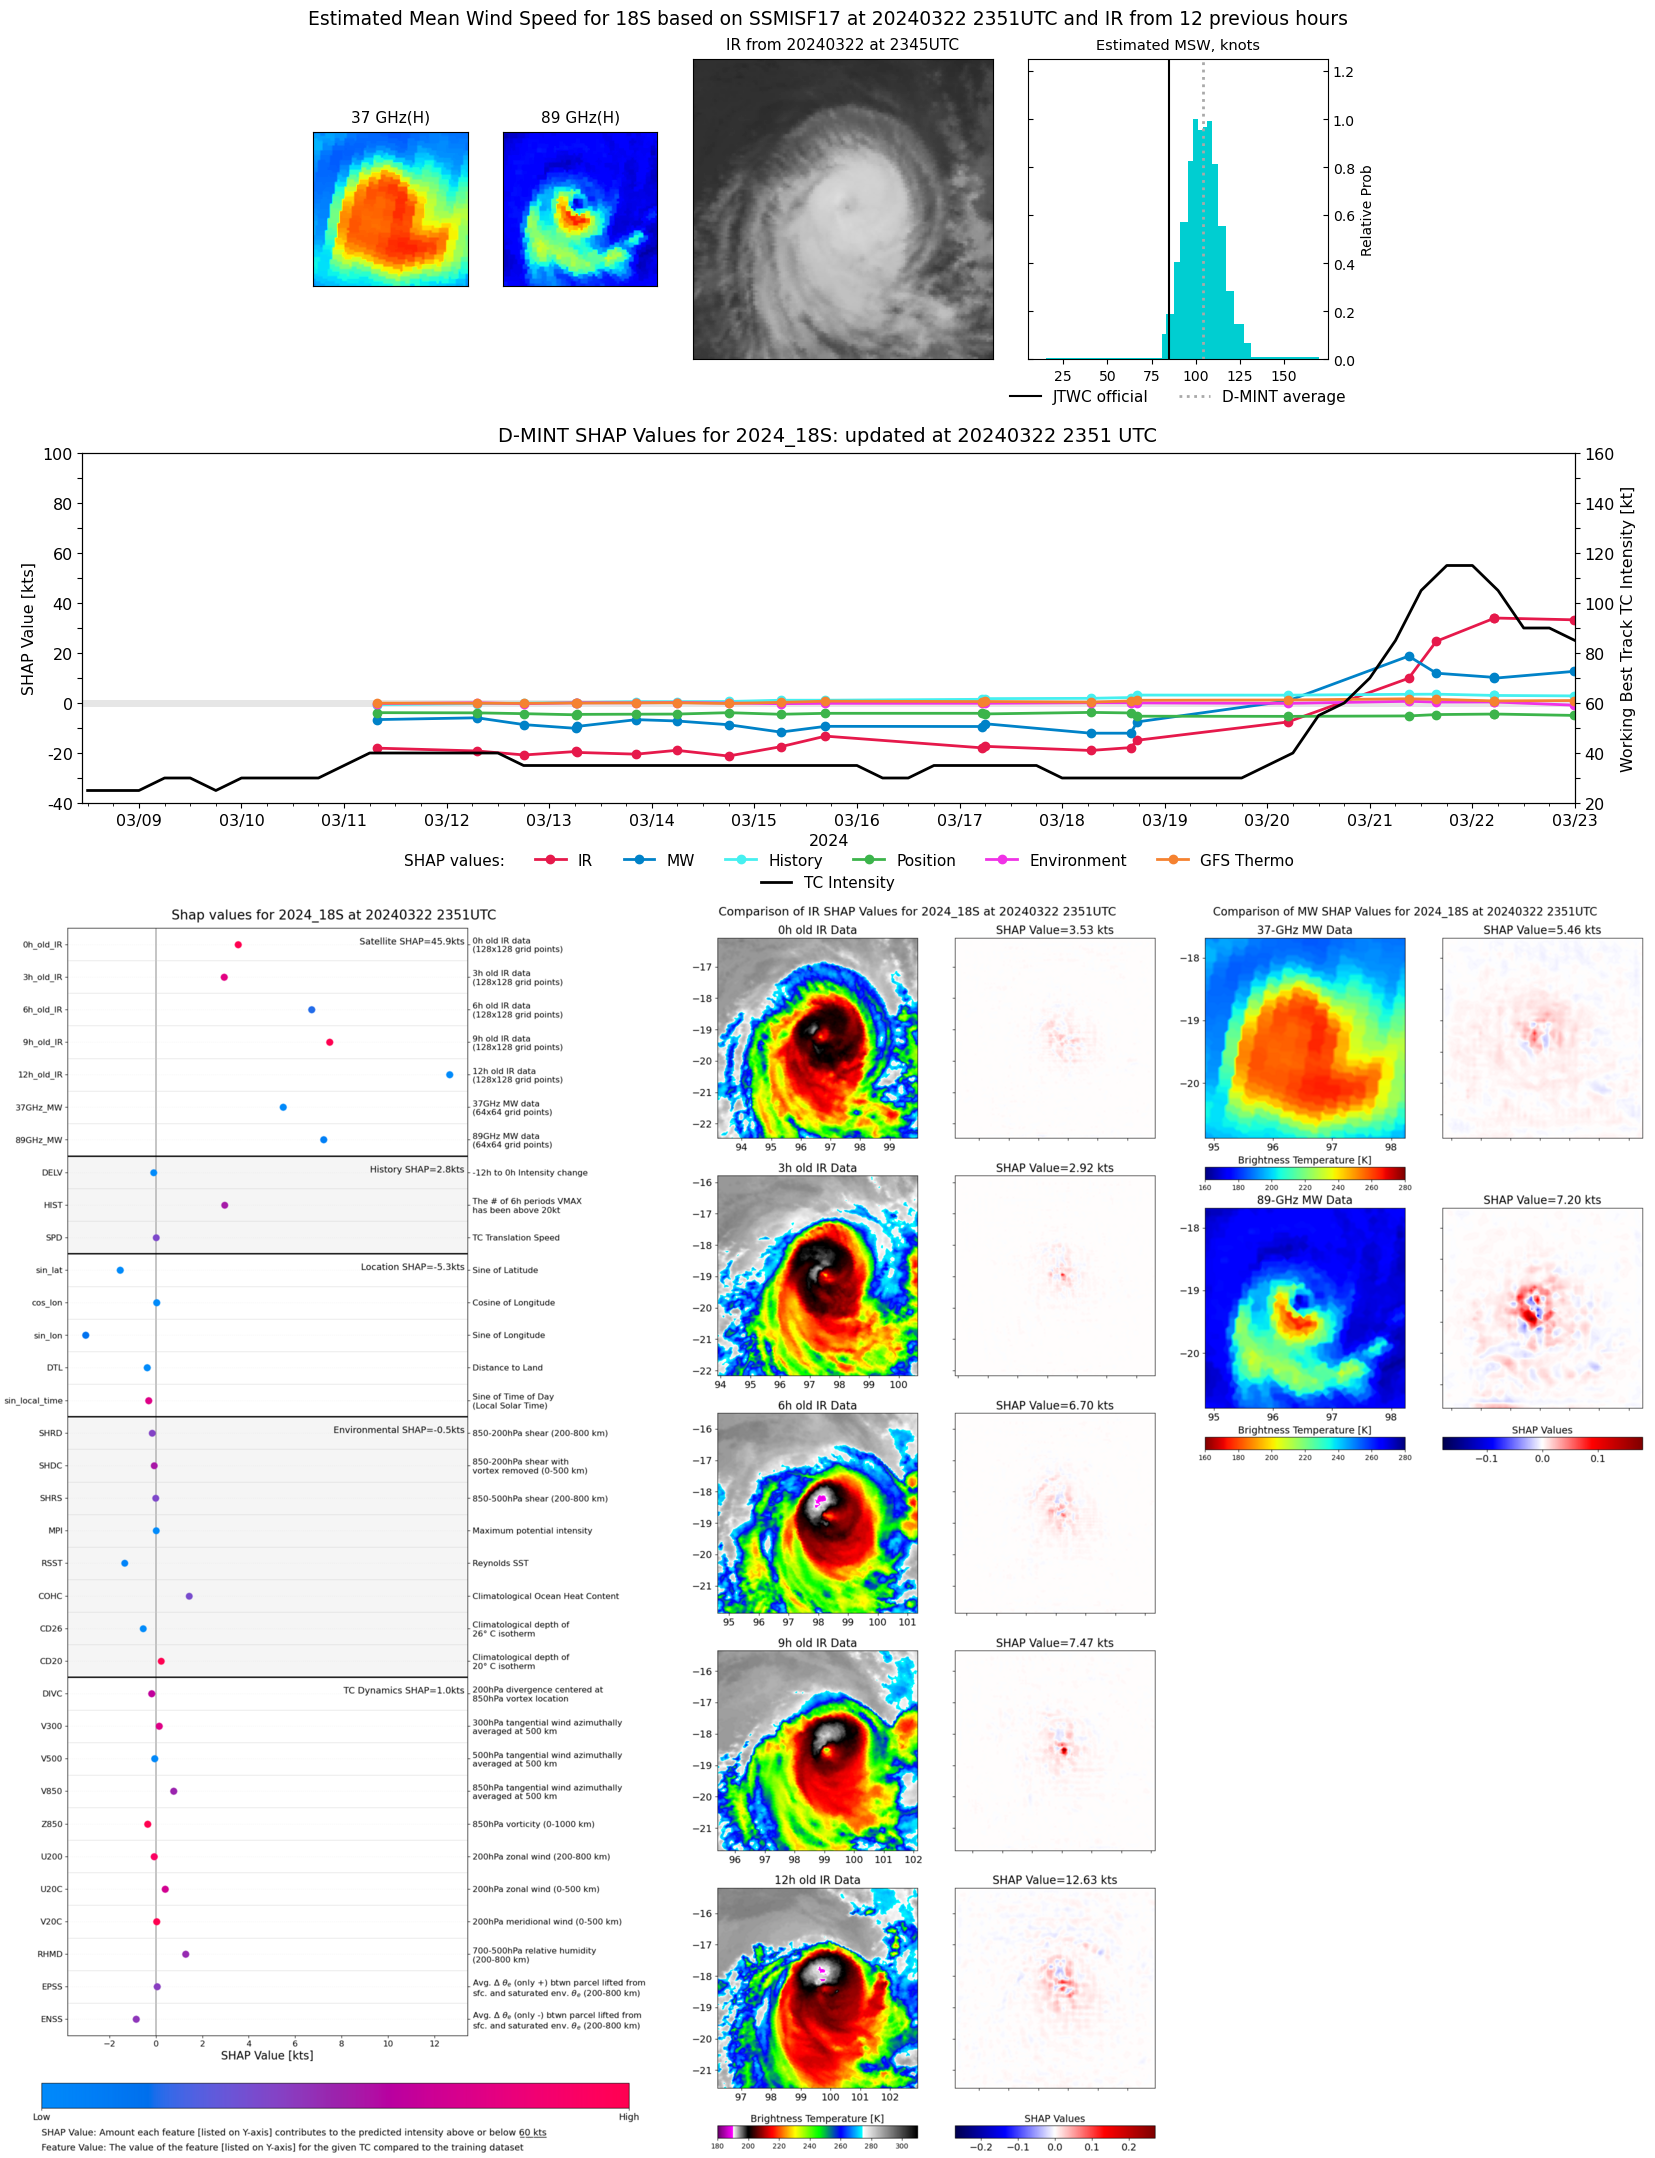 |
| 20240322 | 0502 UTC | GMI | 954 hPa | 104 kts | 97 kts | 110 kts |  |
| 20240322 | 0458 UTC | GMI | 954 hPa | 104 kts | 97 kts | 110 kts | 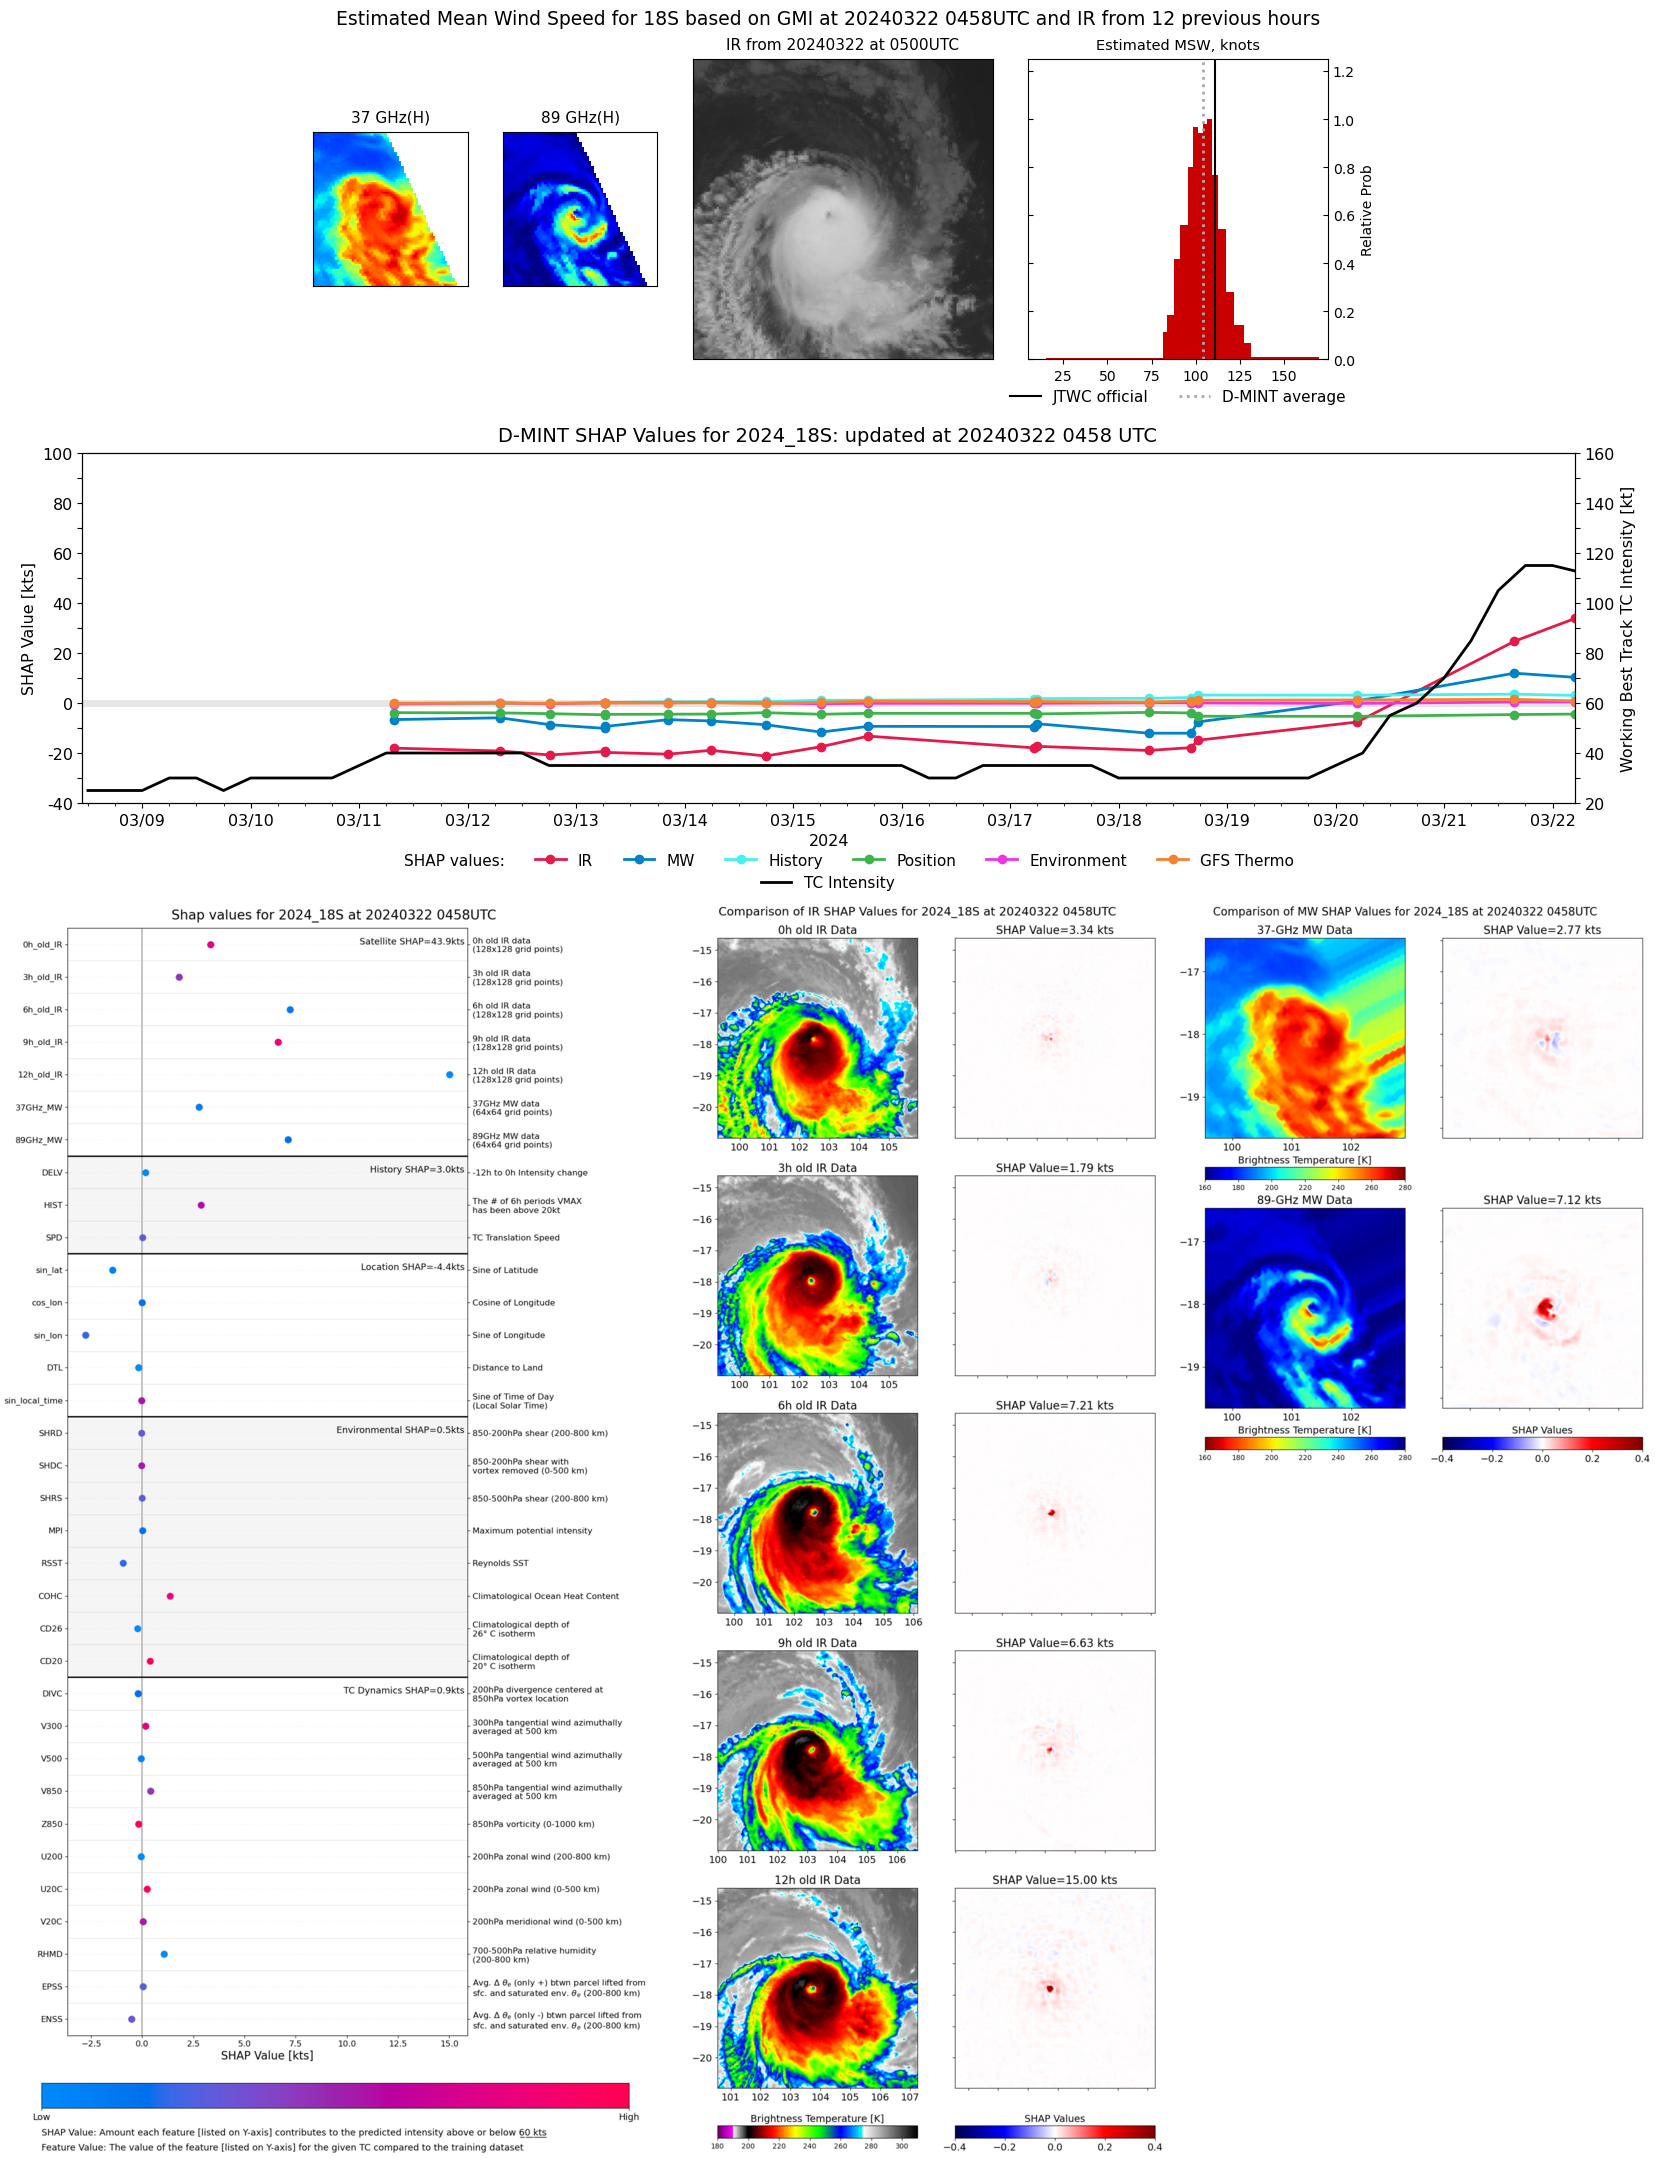 |
| 20240321 | 1533 UTC | GMI | 951 hPa | 96 kts | 90 kts | 103 kts | 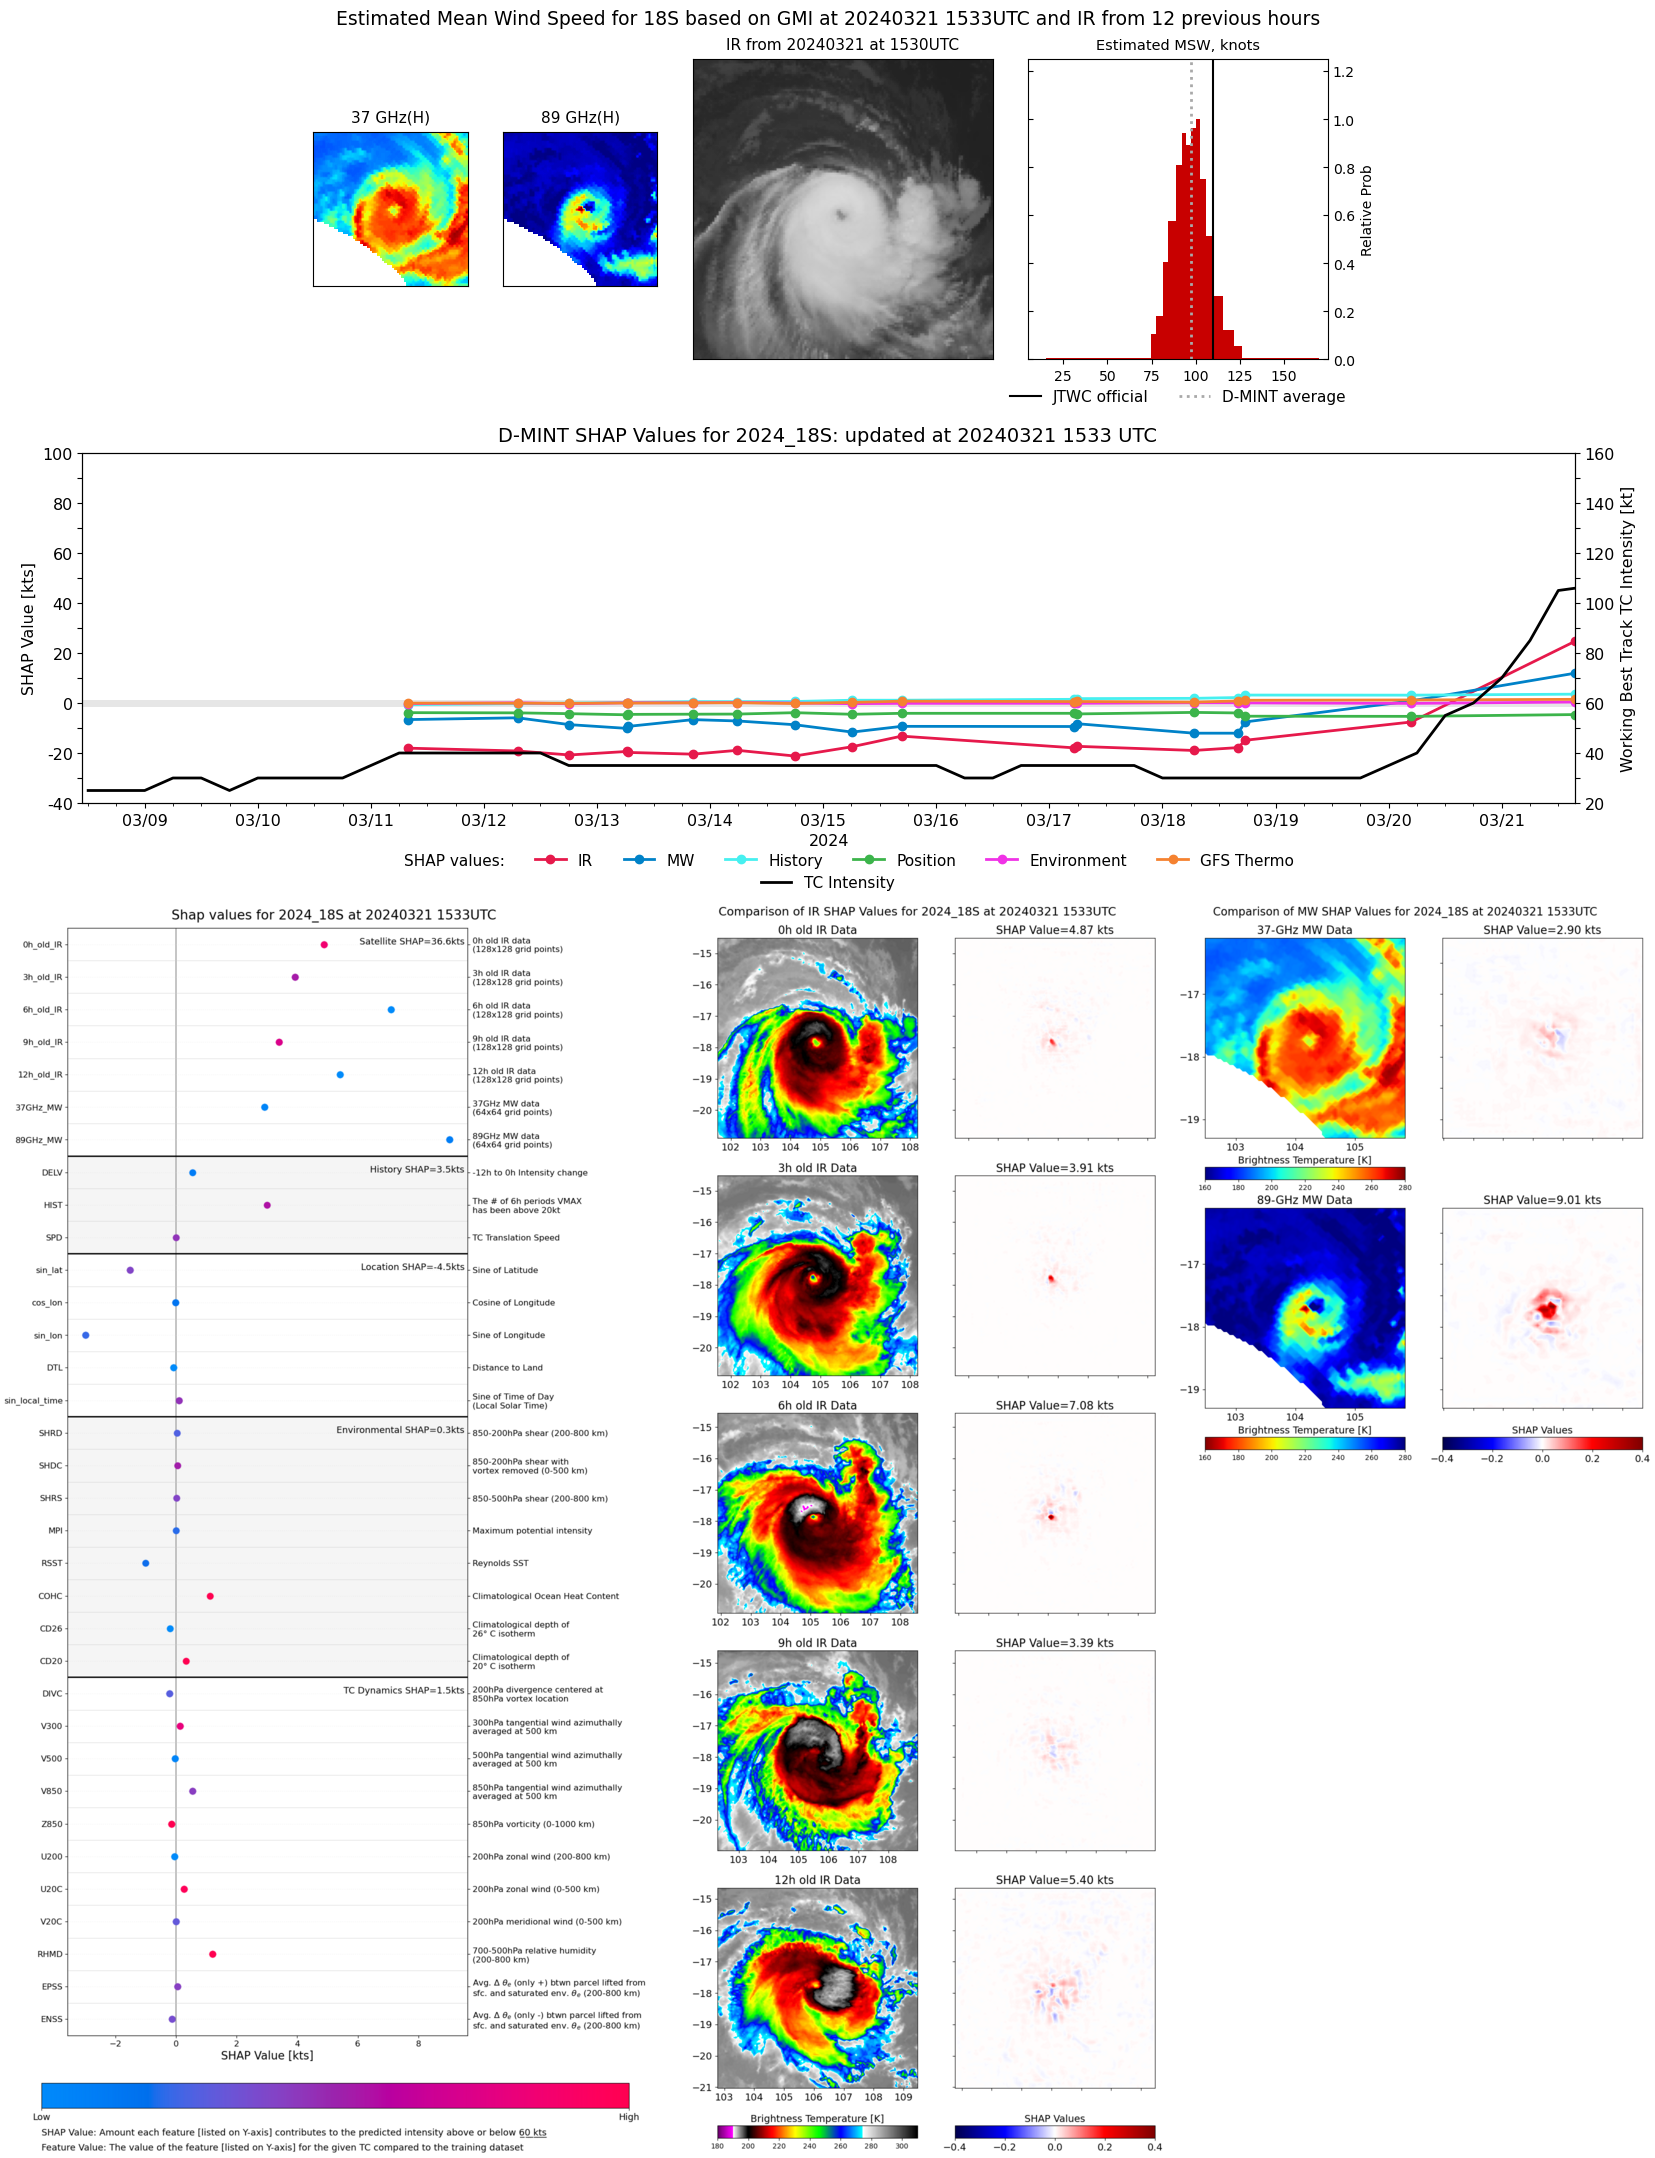 |
| 20240321 | 1102 UTC | SSMISF16 | 959 hPa | 93 kts | 87 kts | 100 kts | 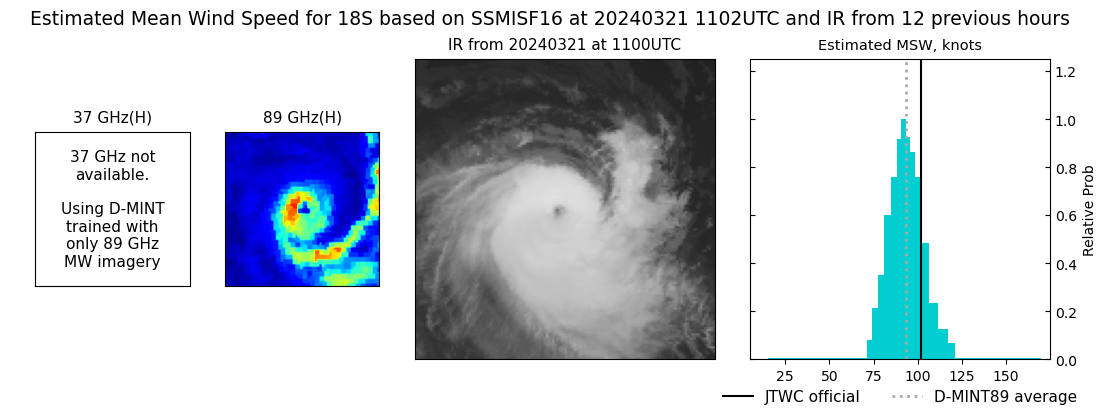 |
| 20240321 | 0905 UTC | SSMISF18 | 956 hPa | 89 kts | 83 kts | 96 kts | 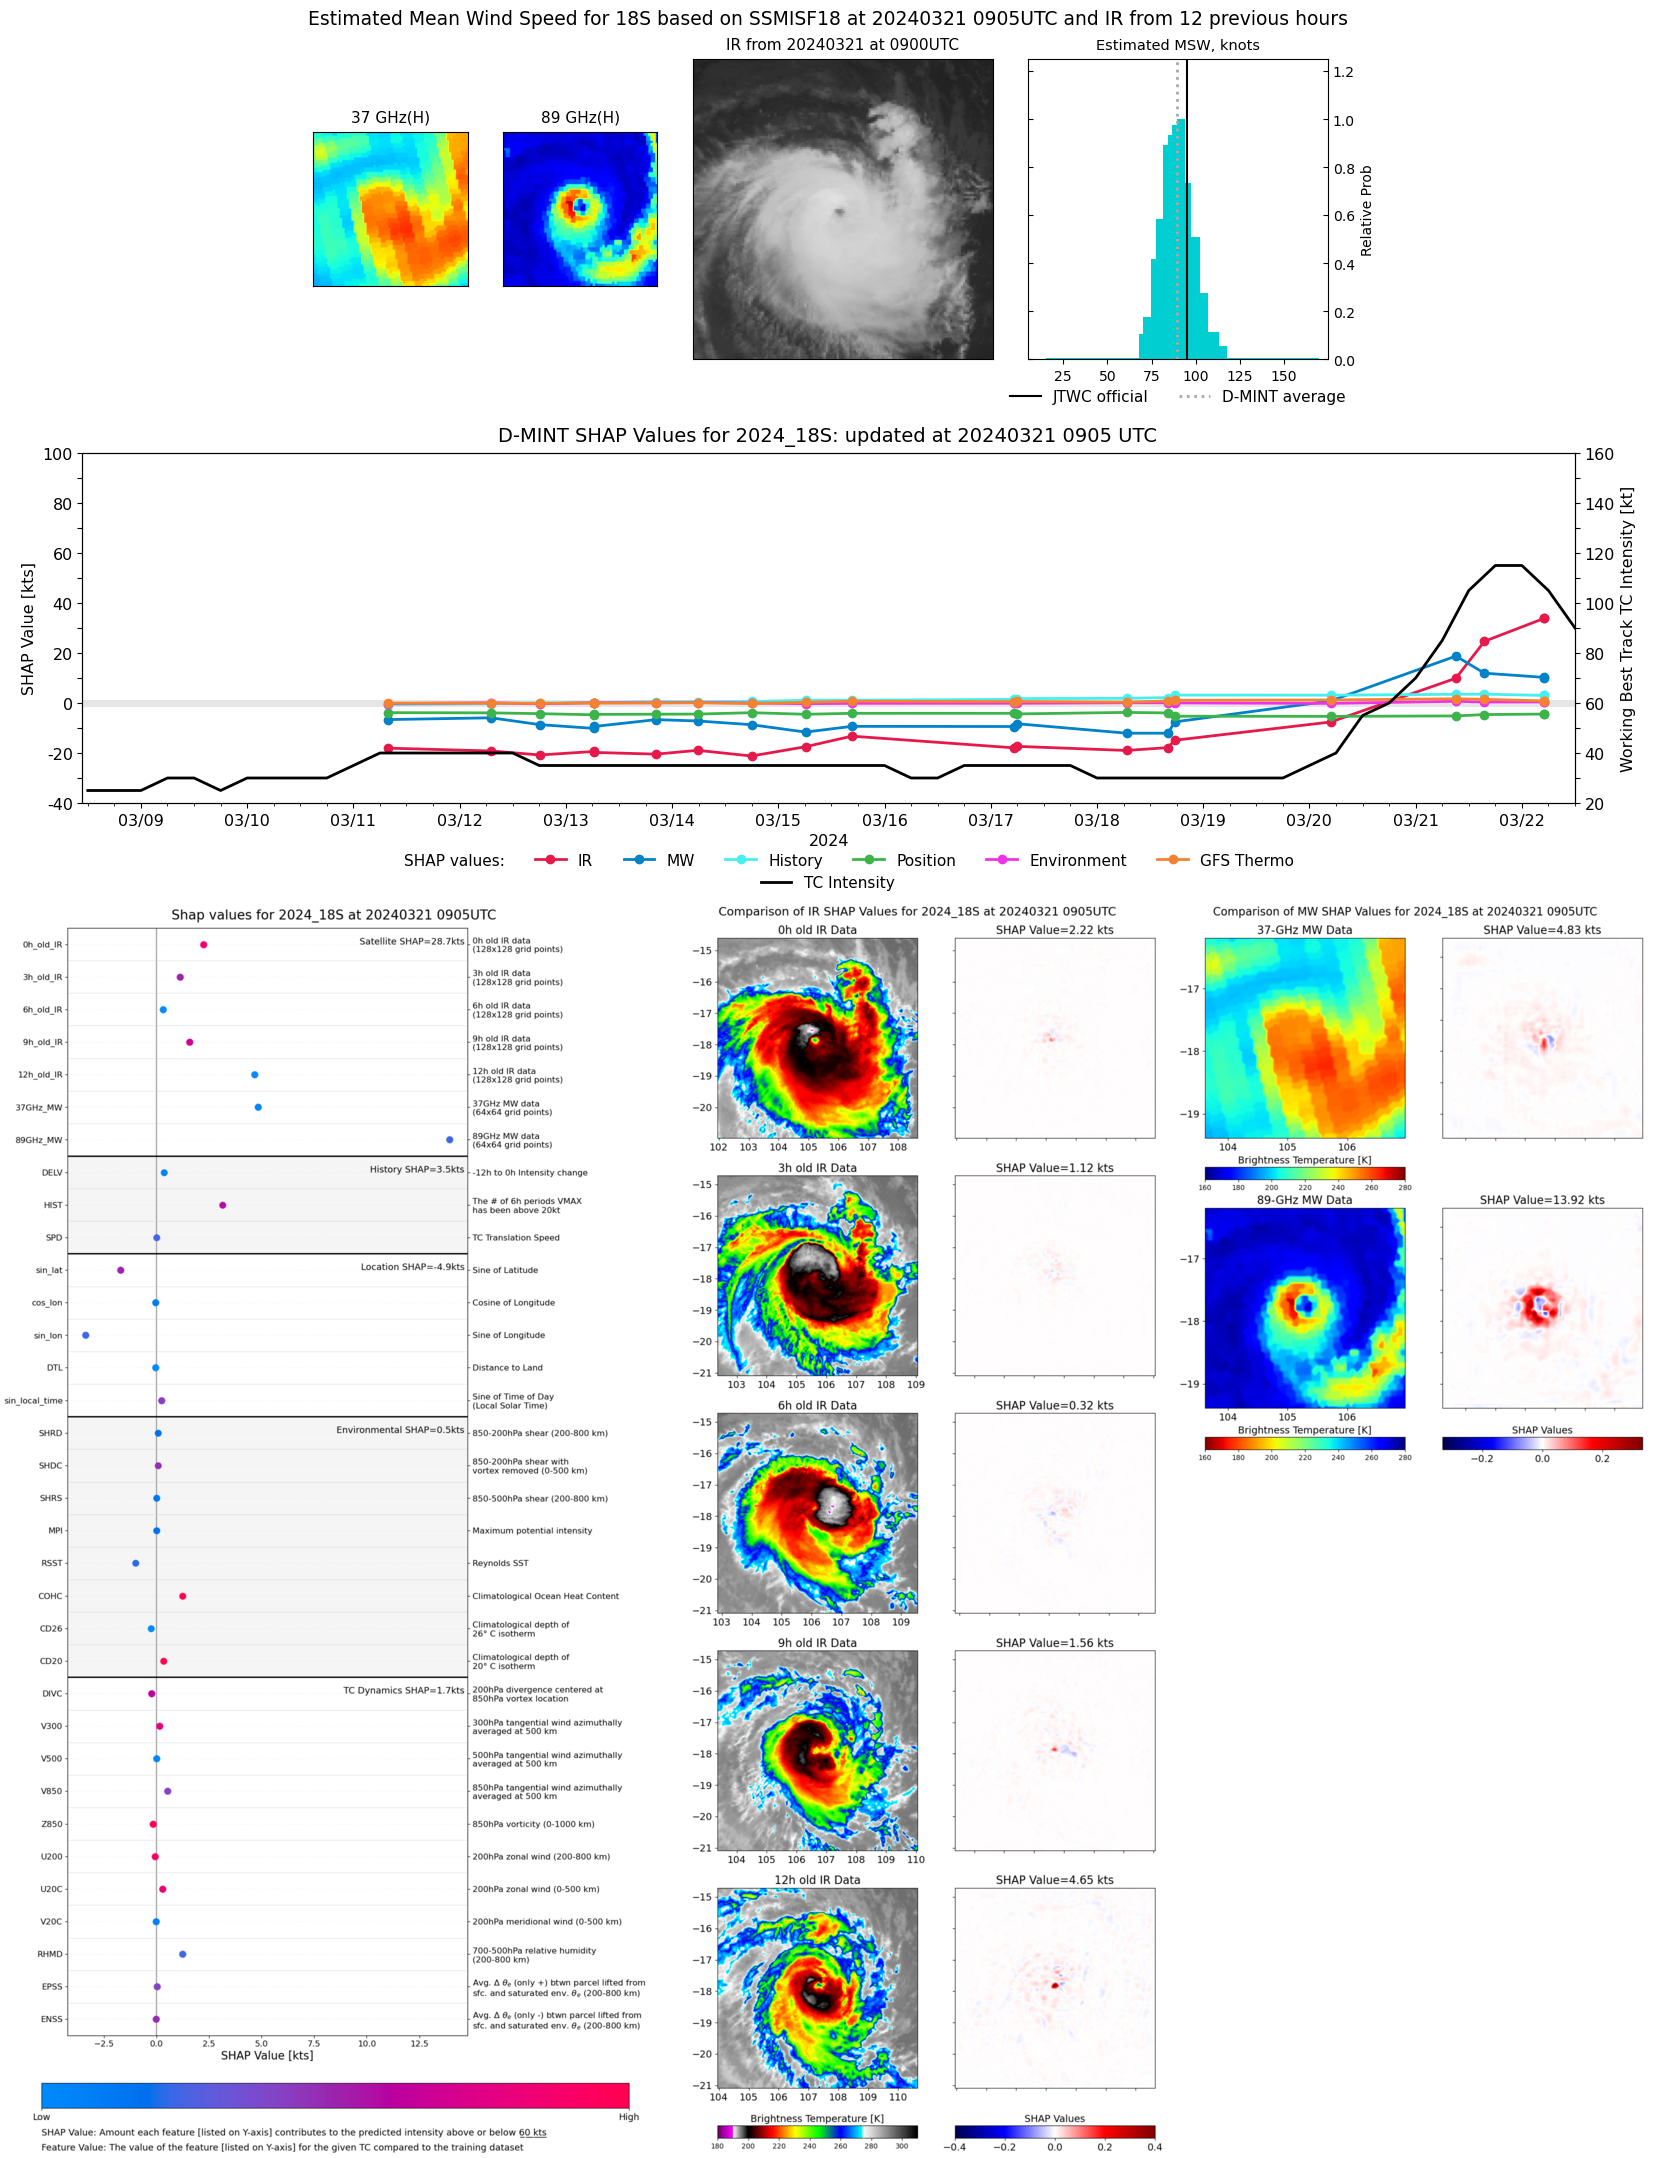 |
| 20240320 | 0448 UTC | GMI | 988 hPa | 52 kts | 47 kts | 57 kts | 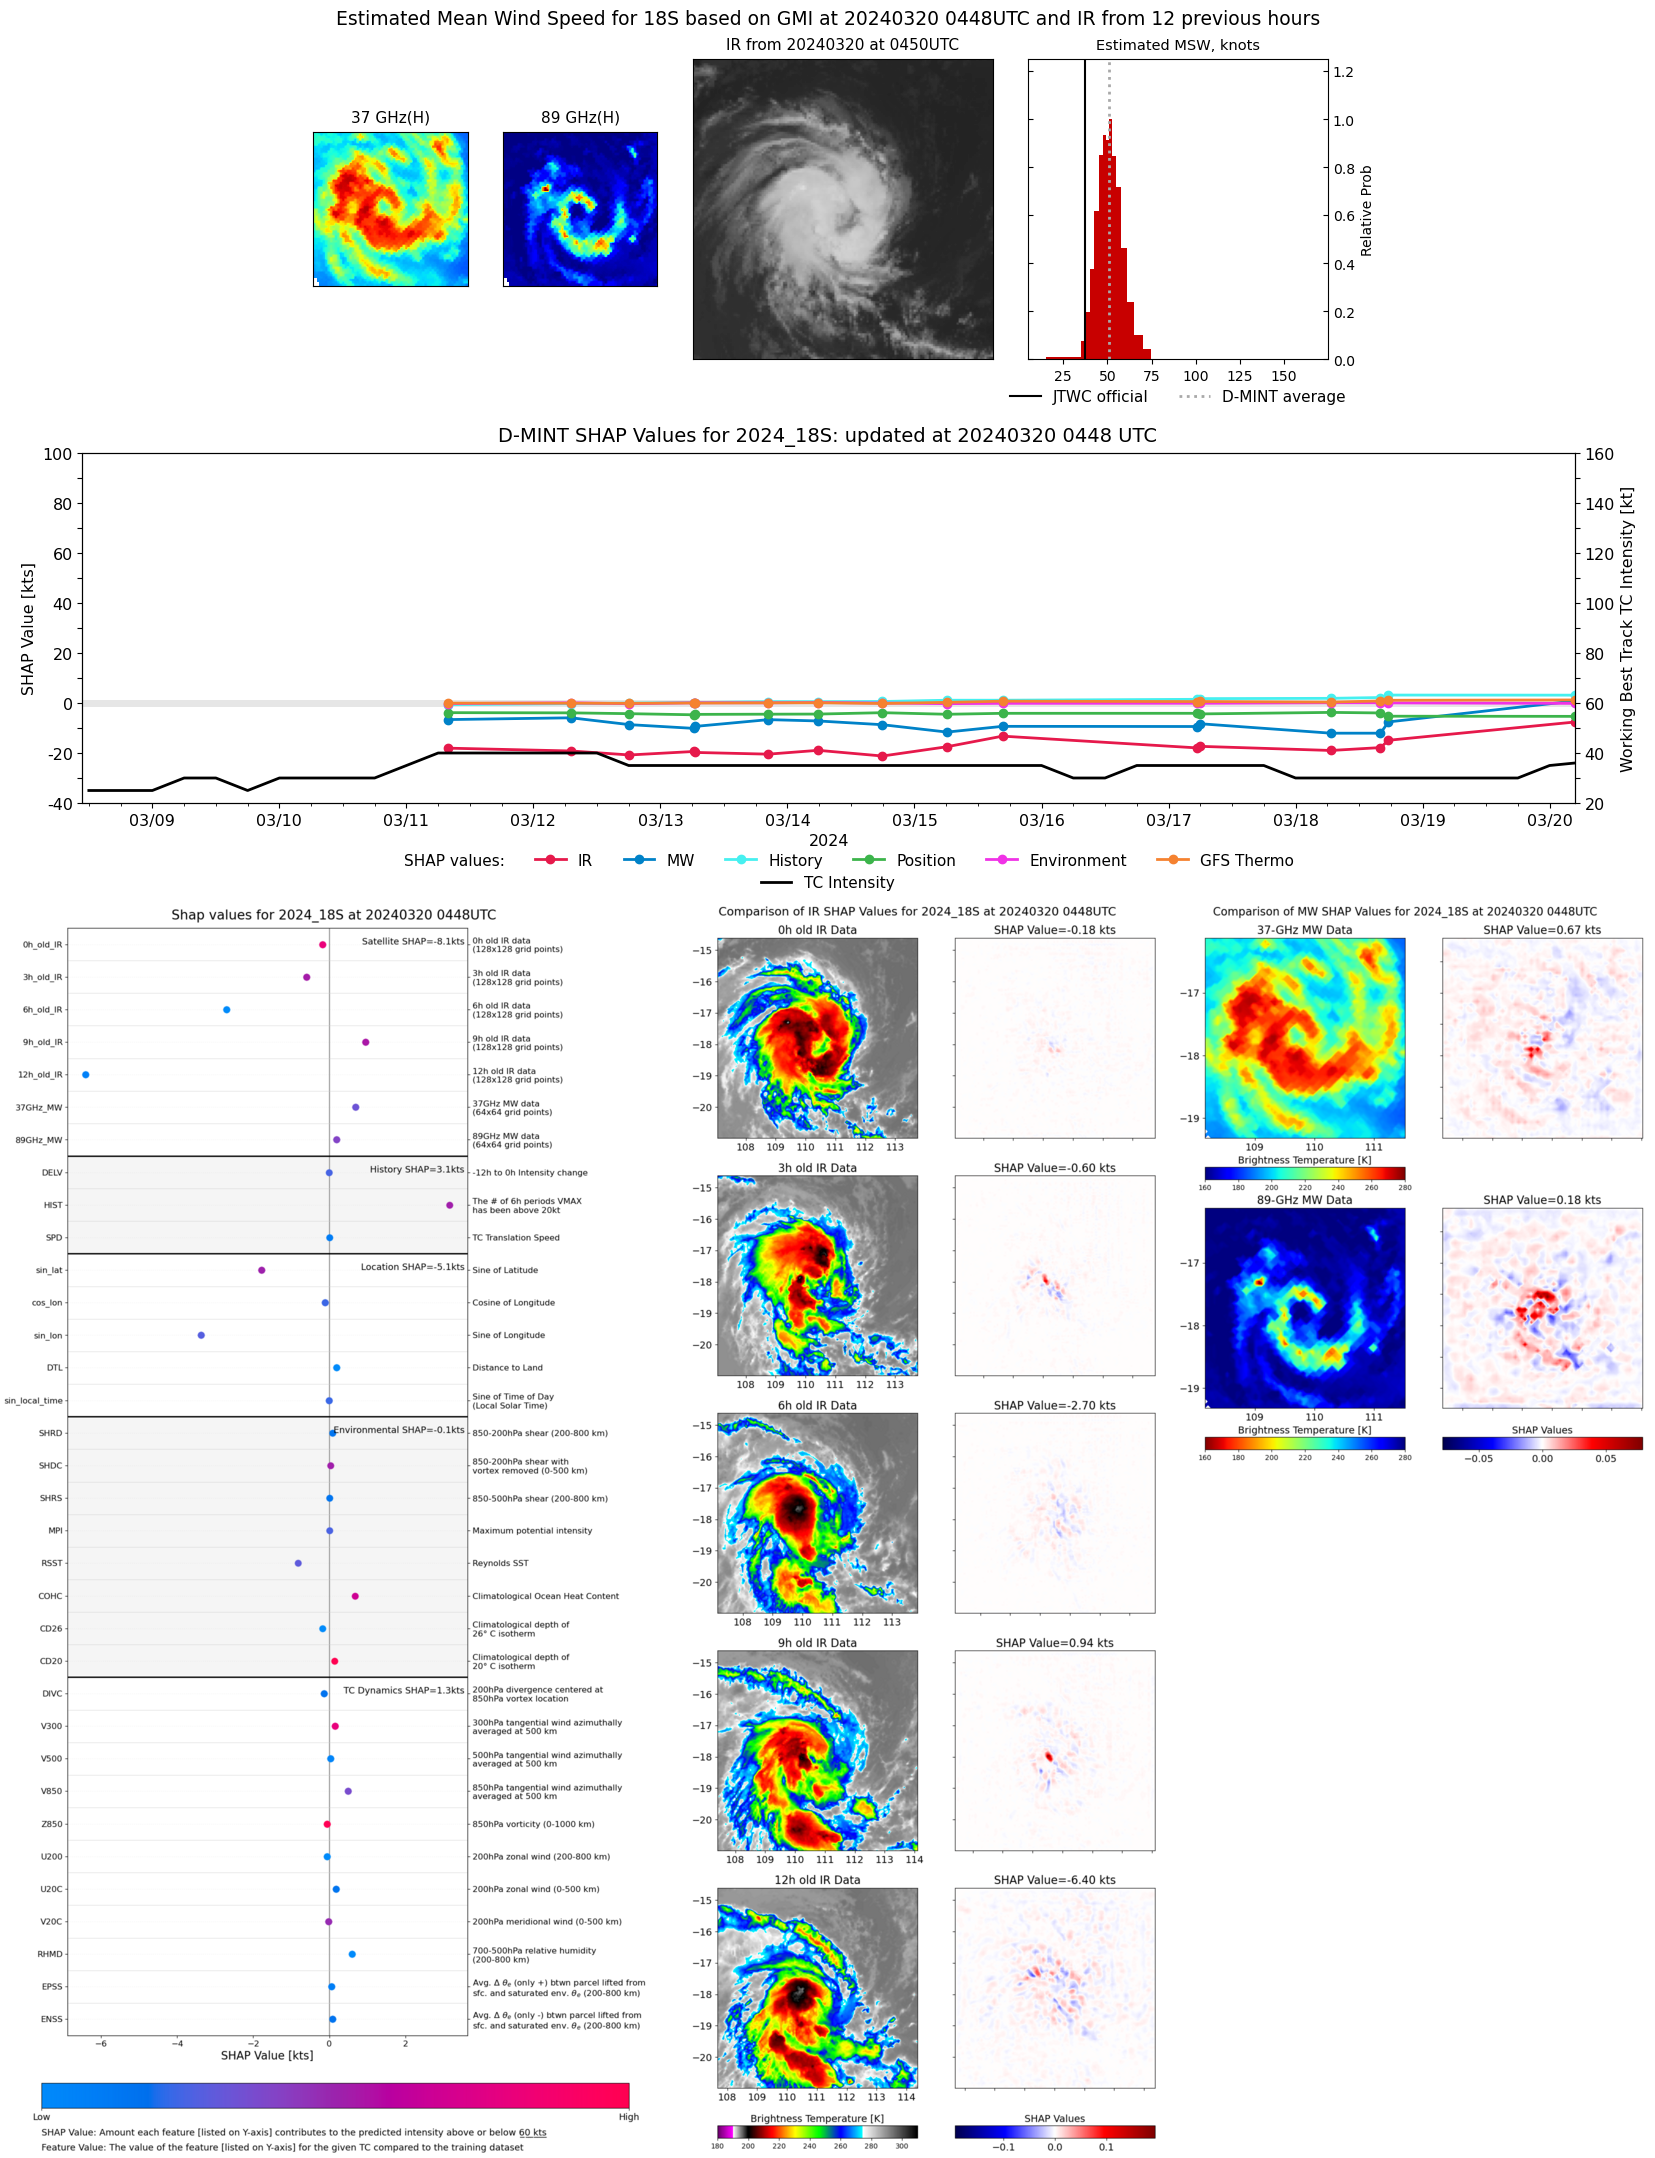 |
| 20240318 | 1733 UTC | AMSR2 | 994 hPa | 39 kts | 35 kts | 44 kts | 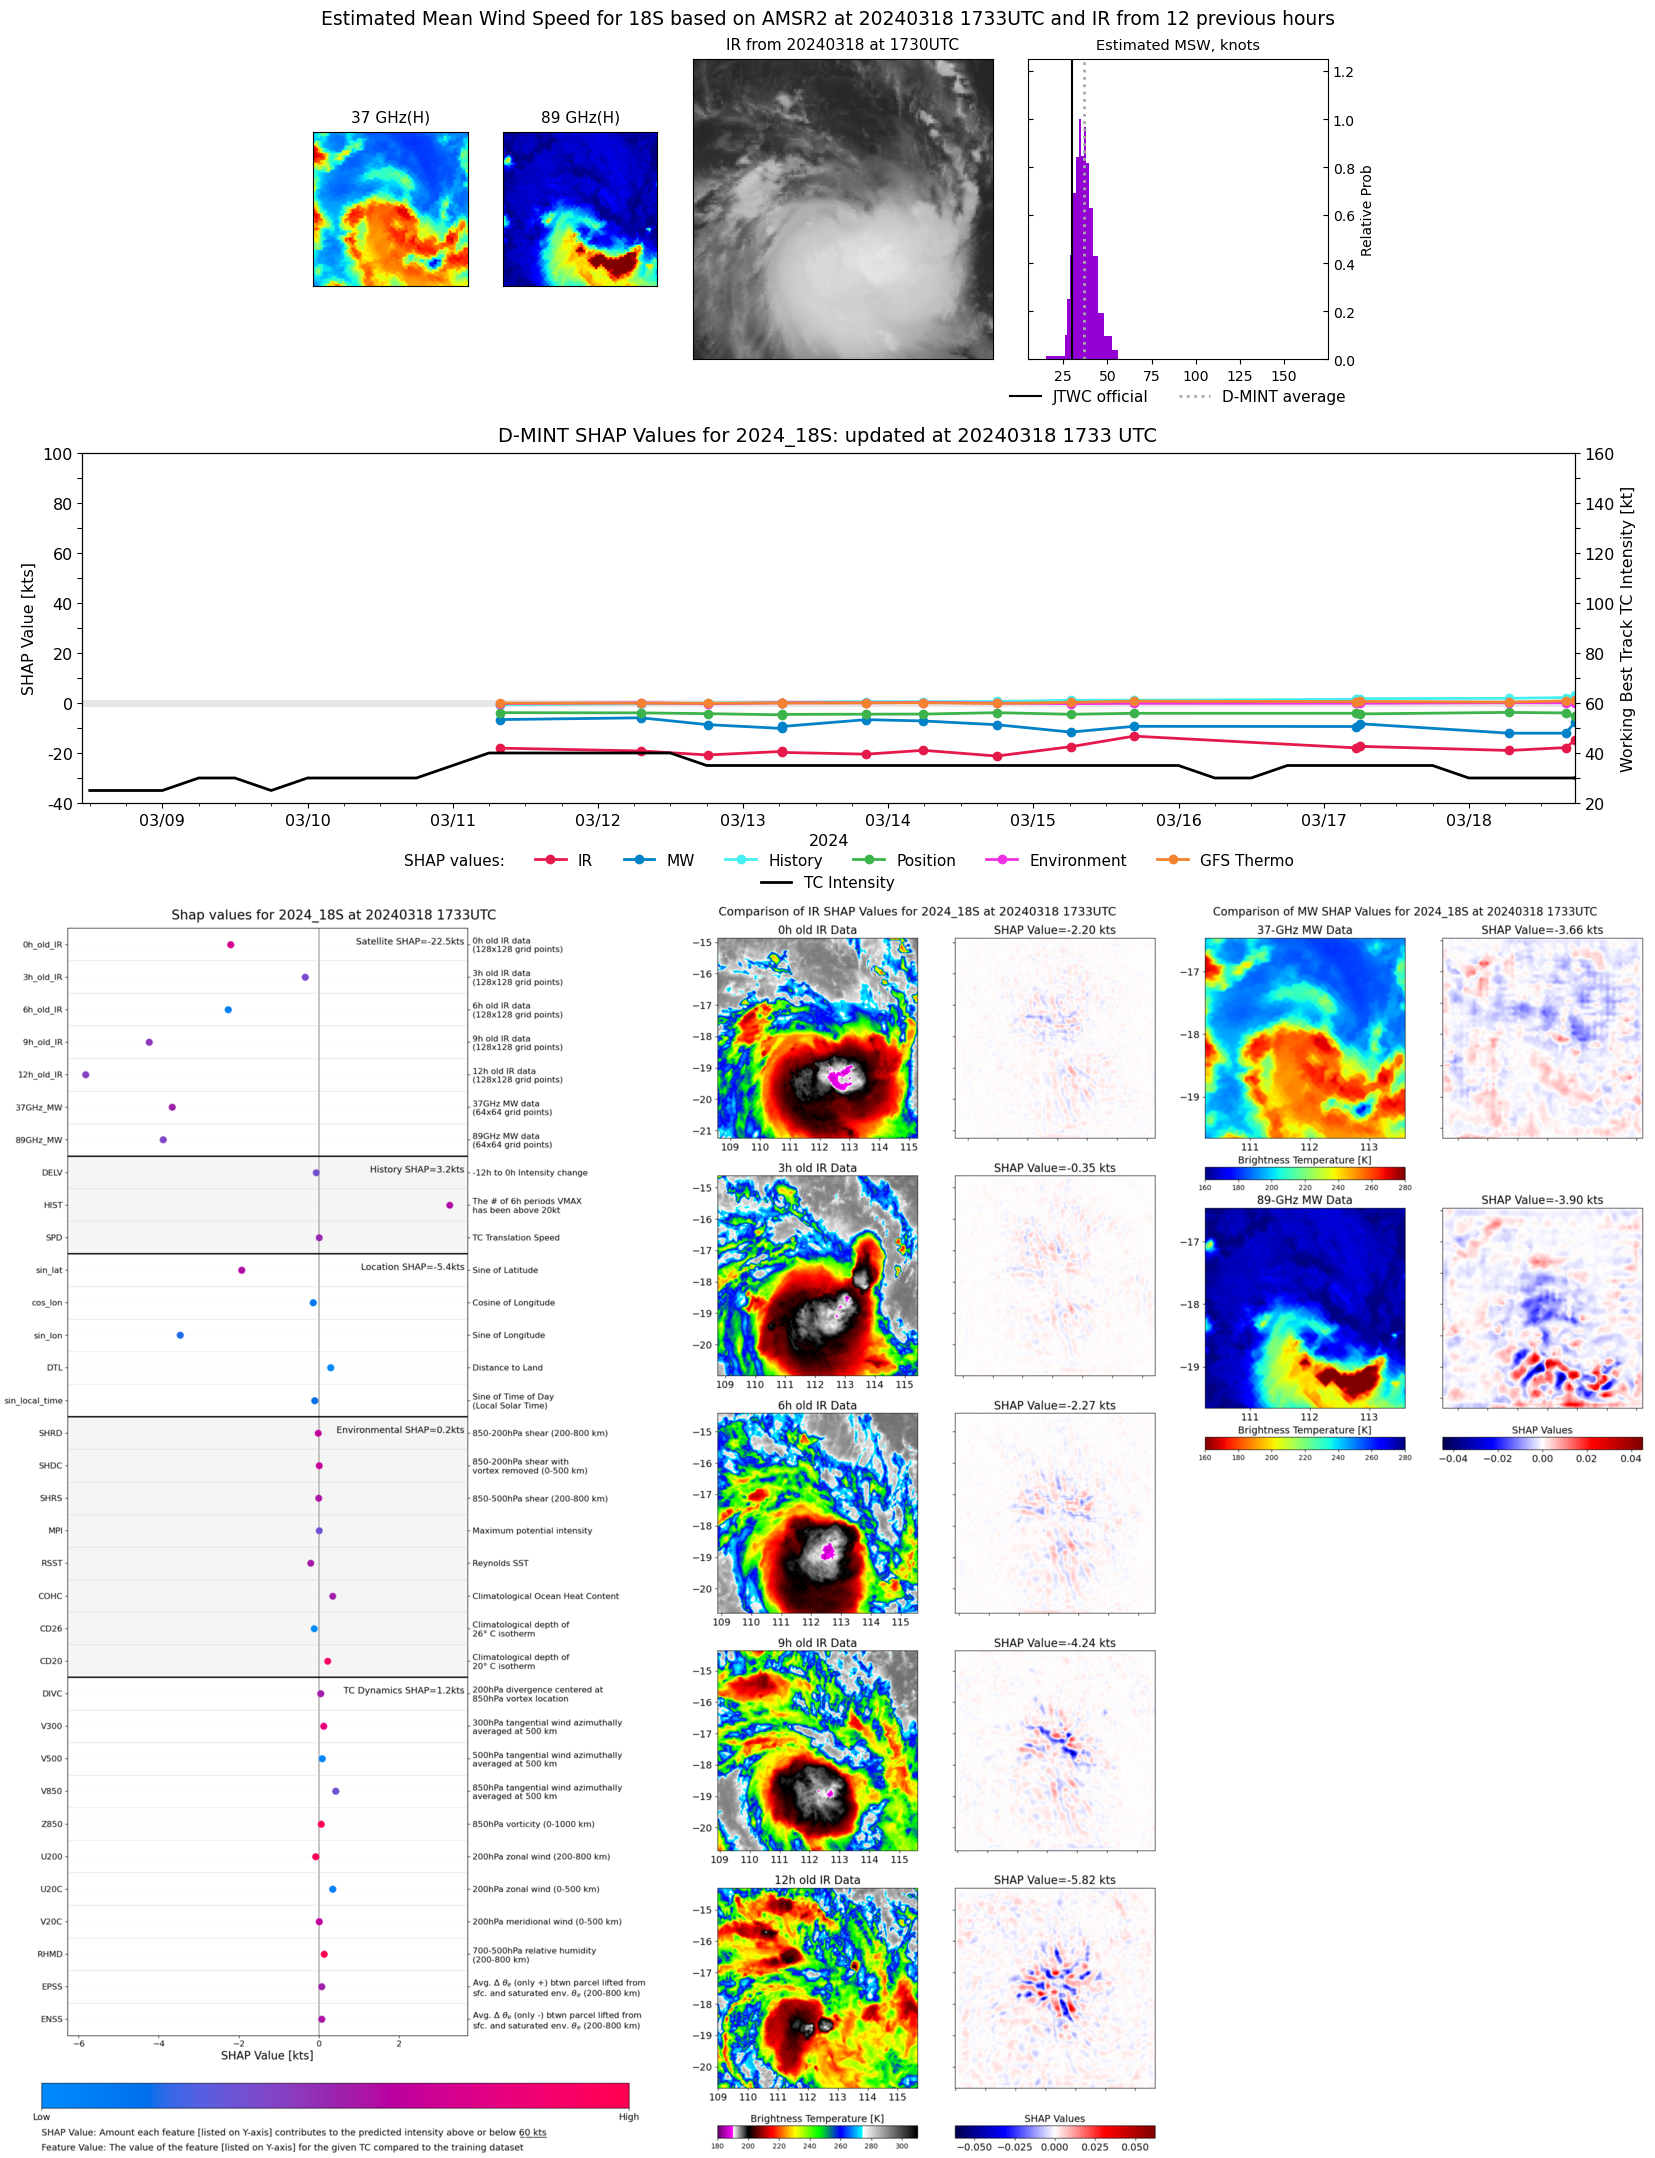 |
| 20240318 | 1603 UTC | GMI | 999 hPa | 29 kts | 27 kts | 32 kts | 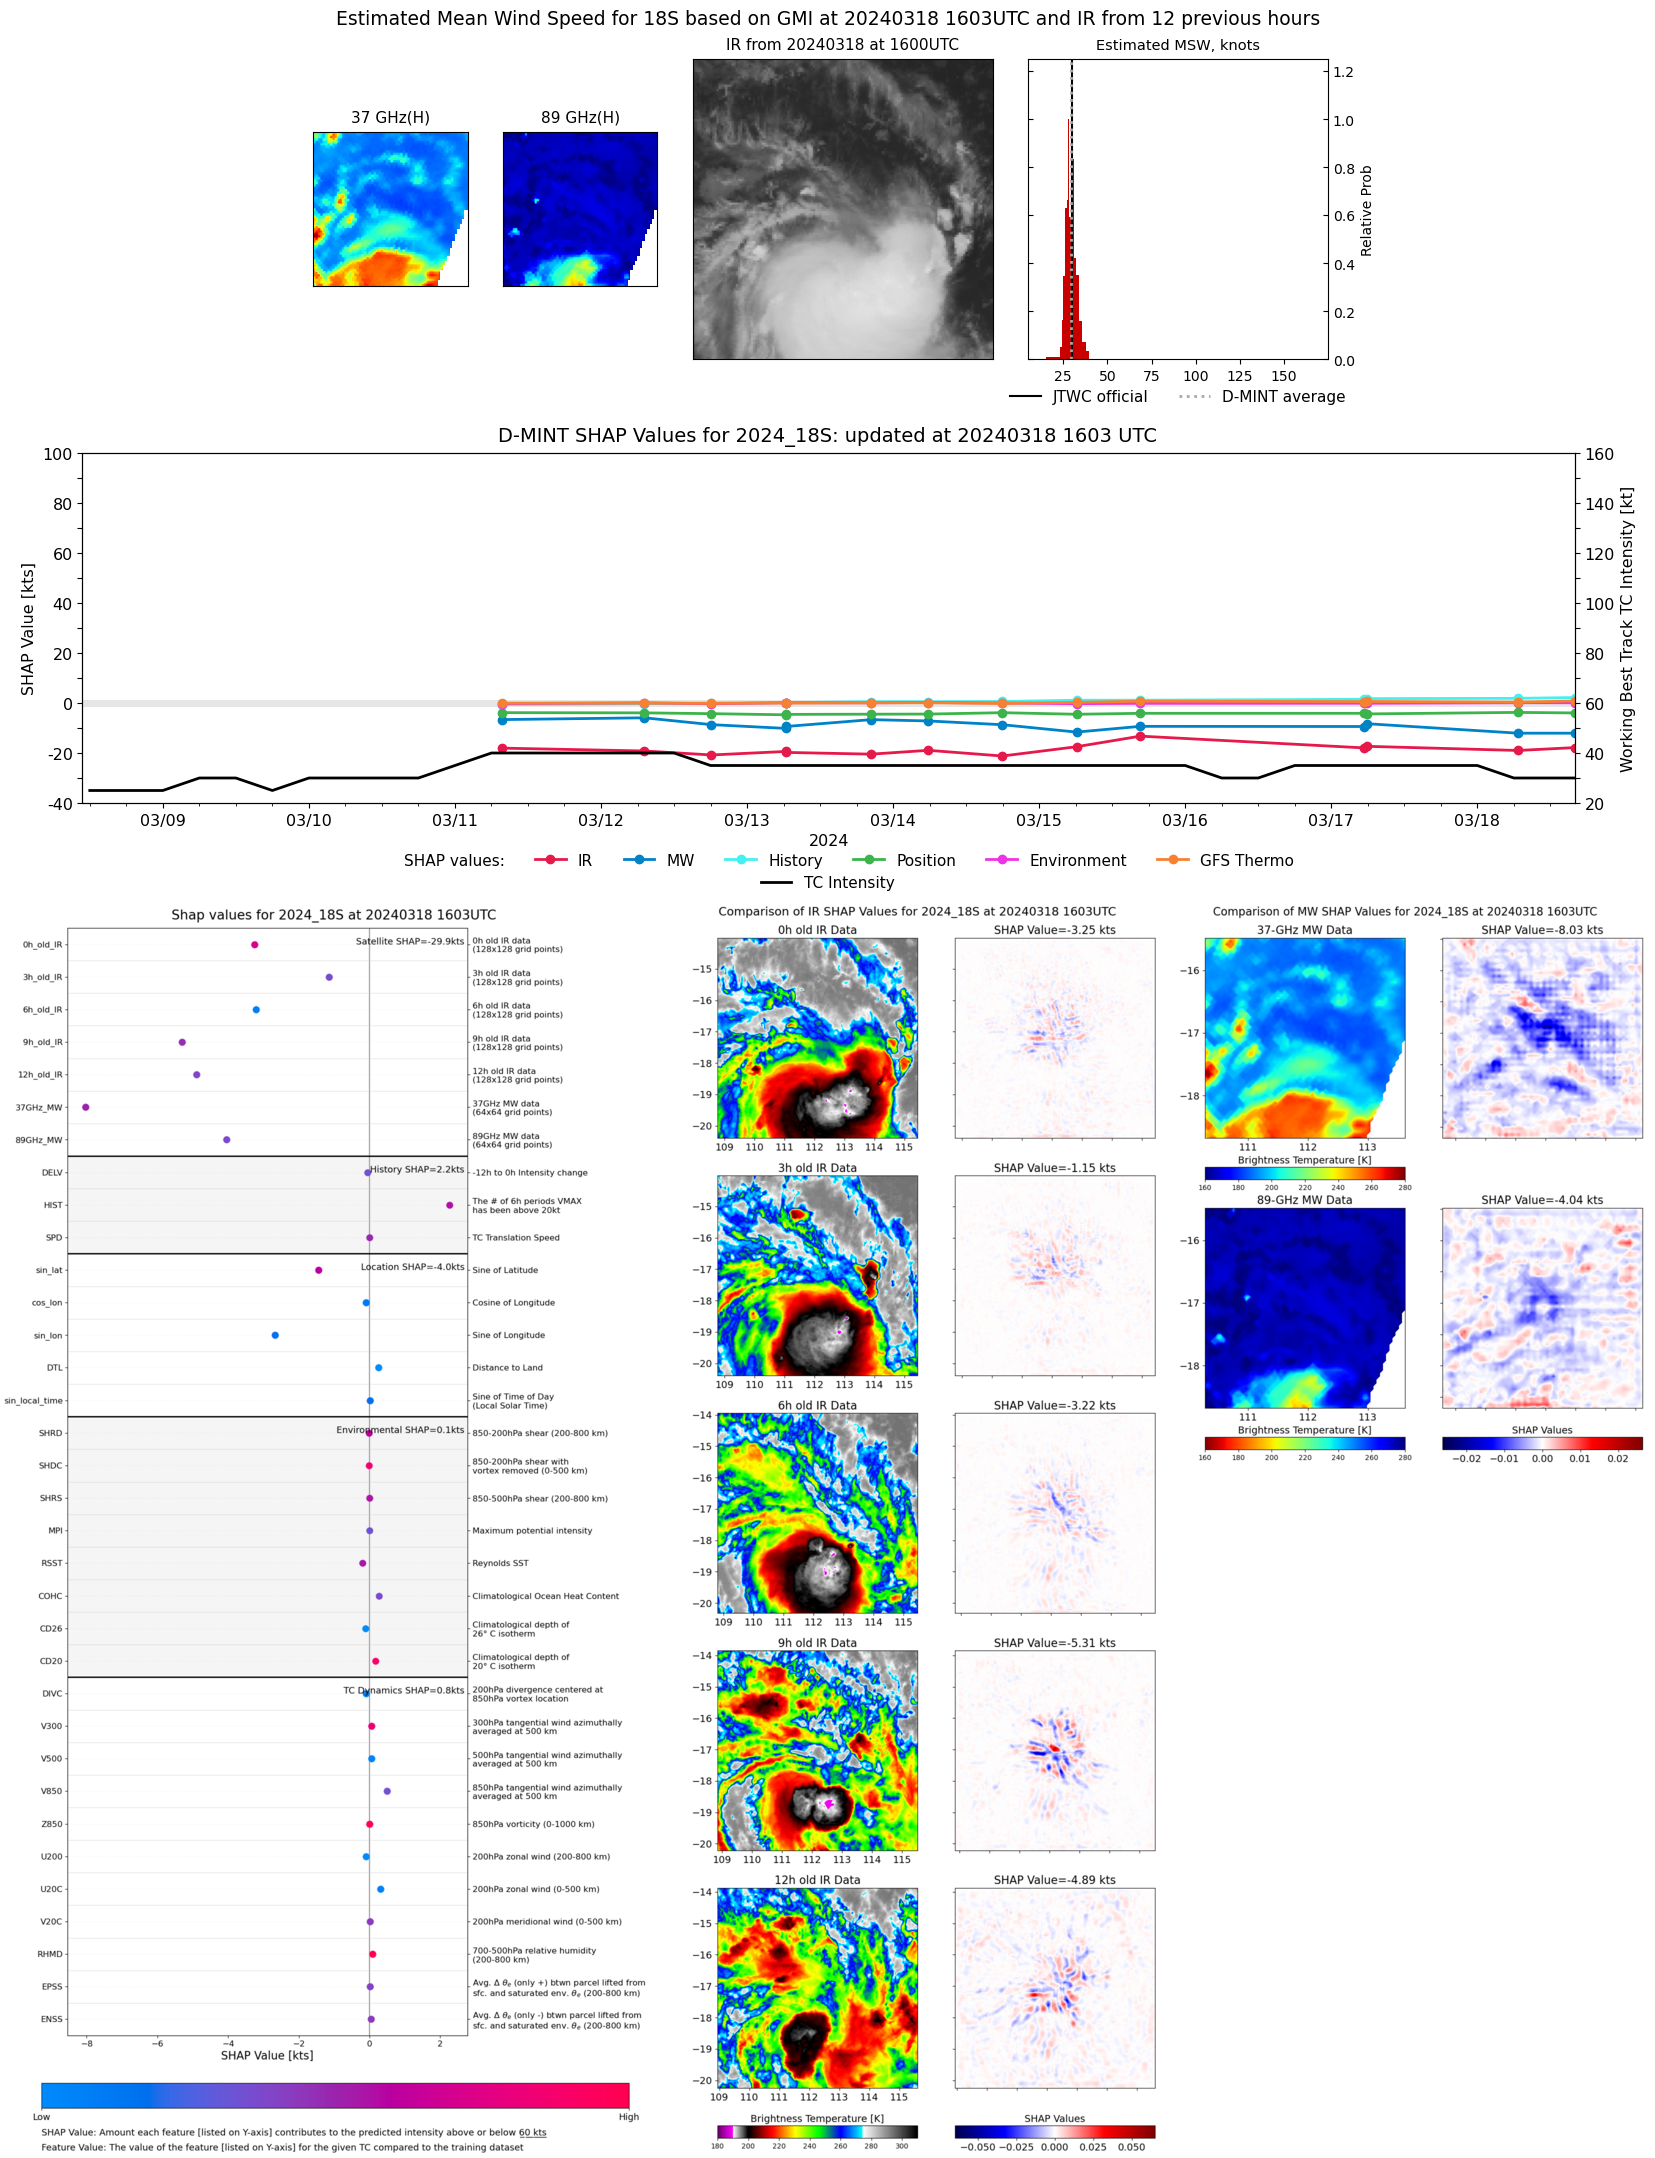 |
| 20240318 | 0641 UTC | AMSR2 | 998 hPa | 28 kts | 26 kts | 30 kts | 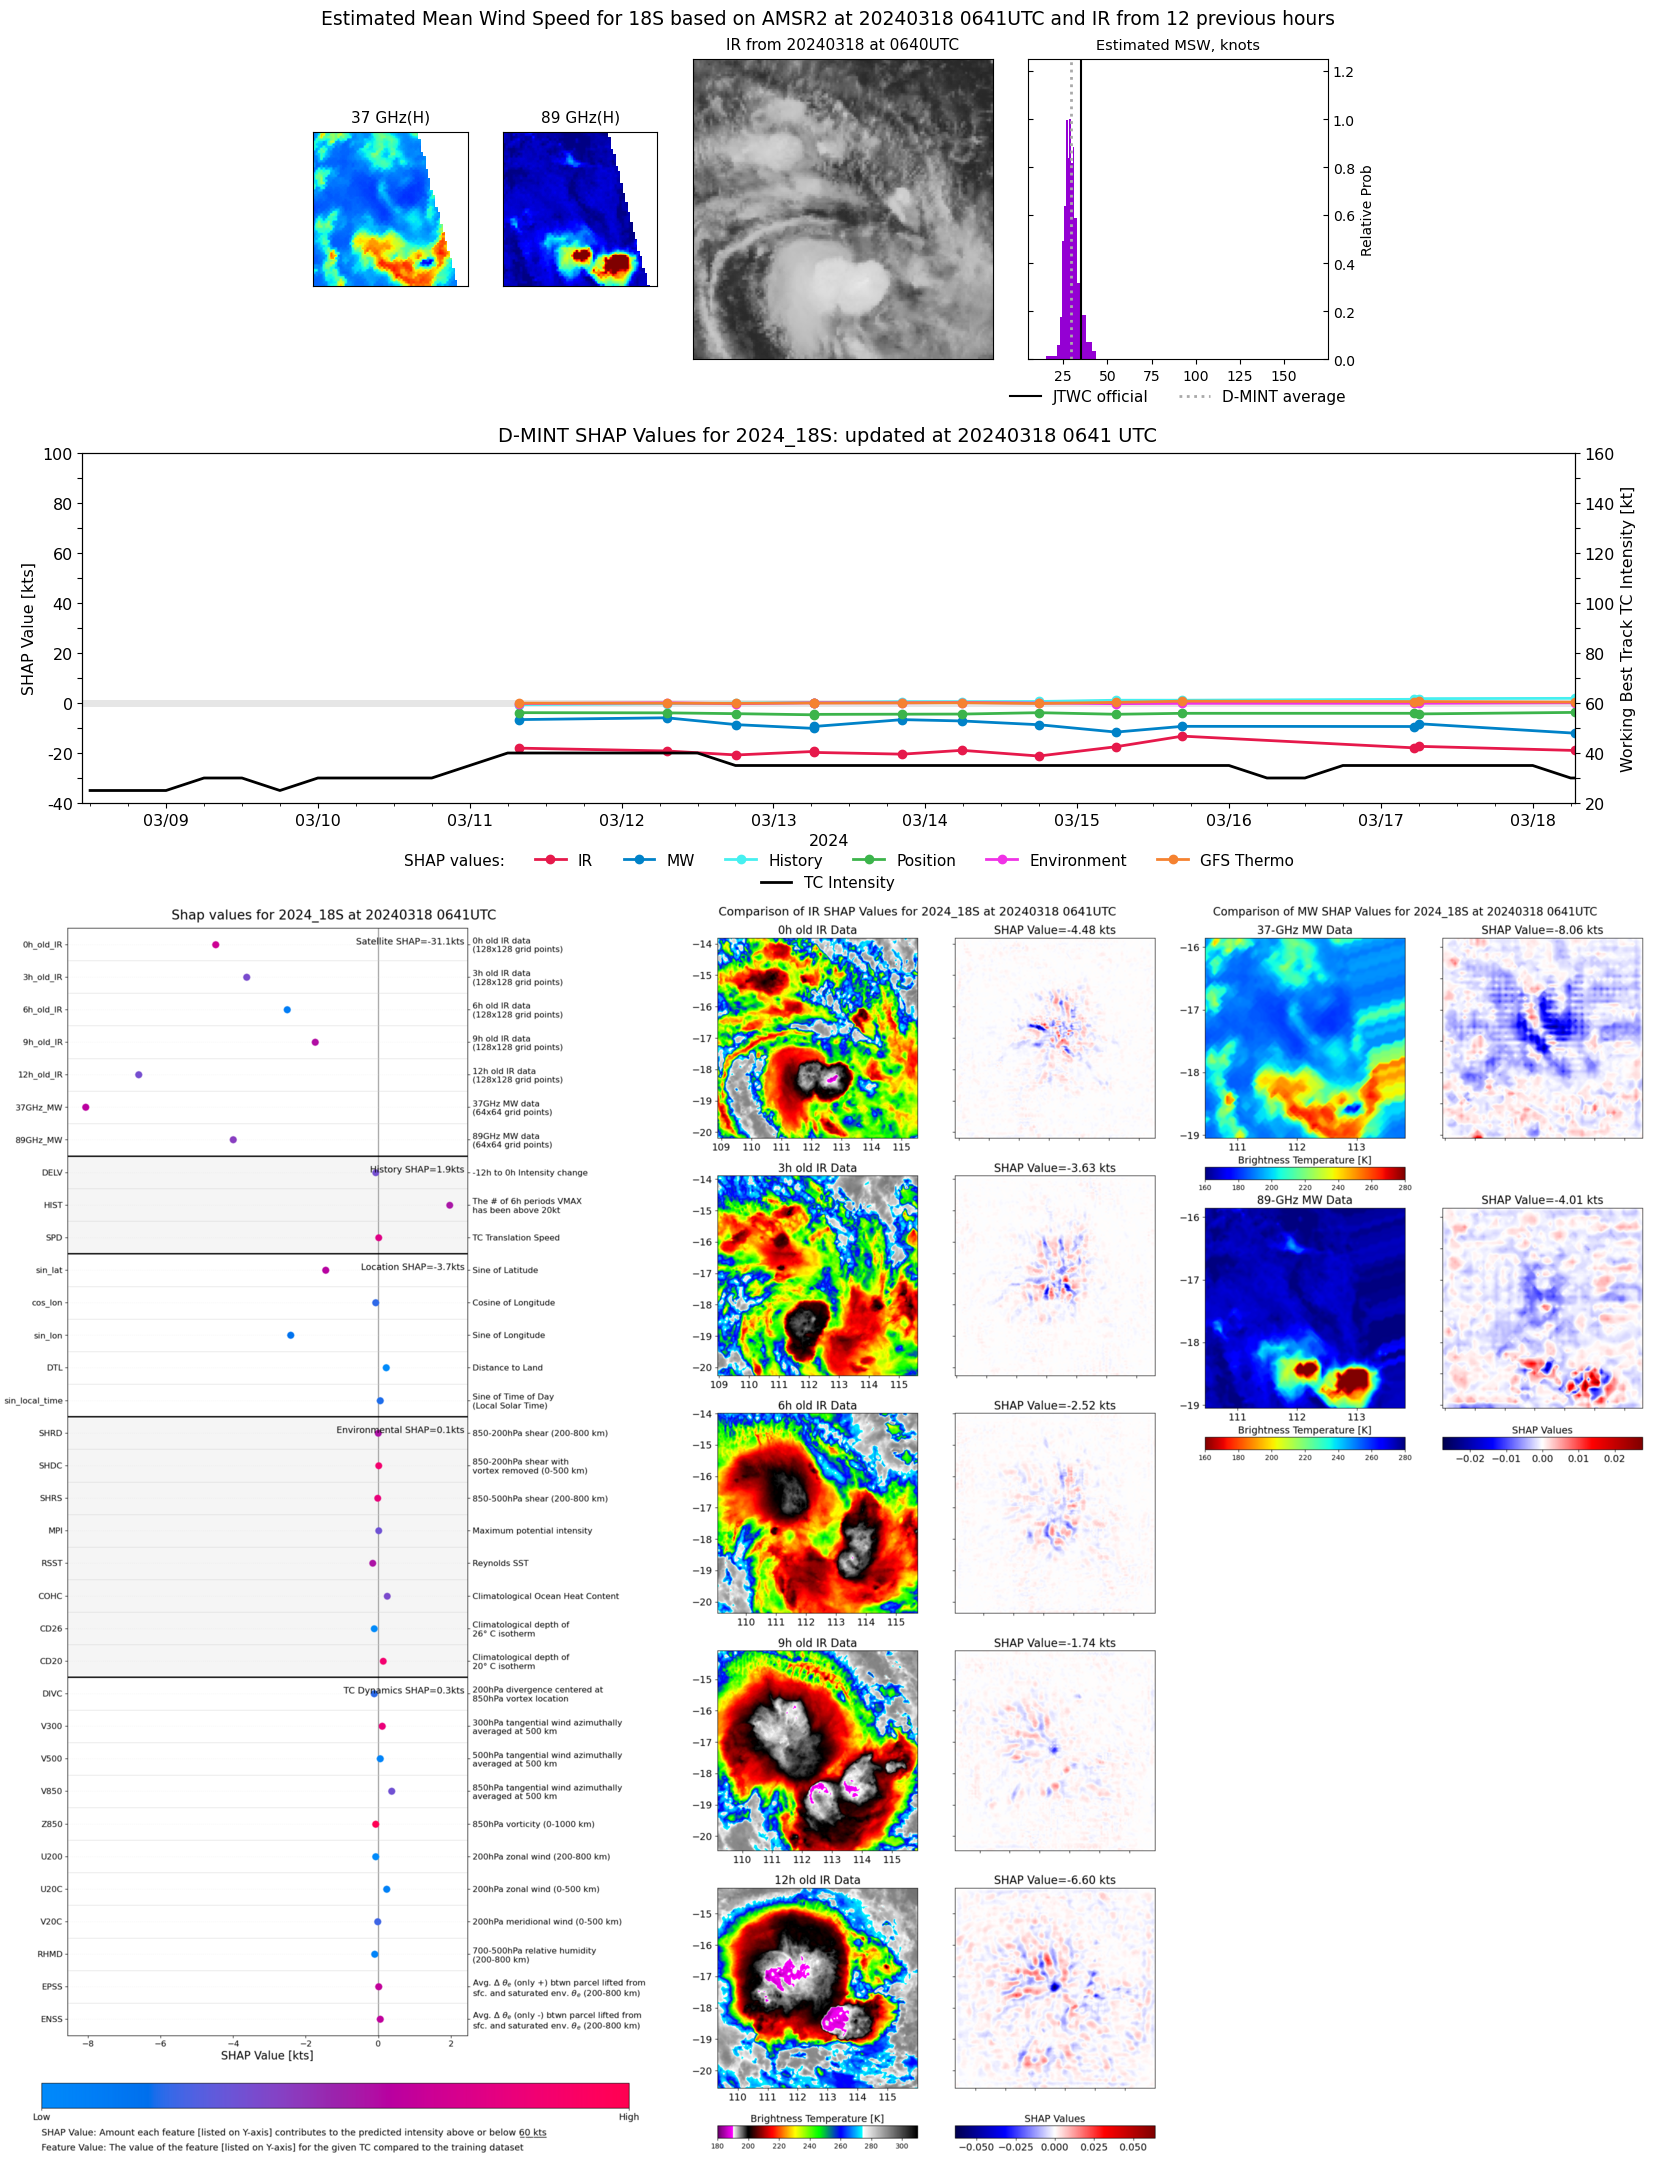 |
| 20240317 | 0557 UTC | AMSR2 | 993 hPa | 32 kts | 29 kts | 36 kts | 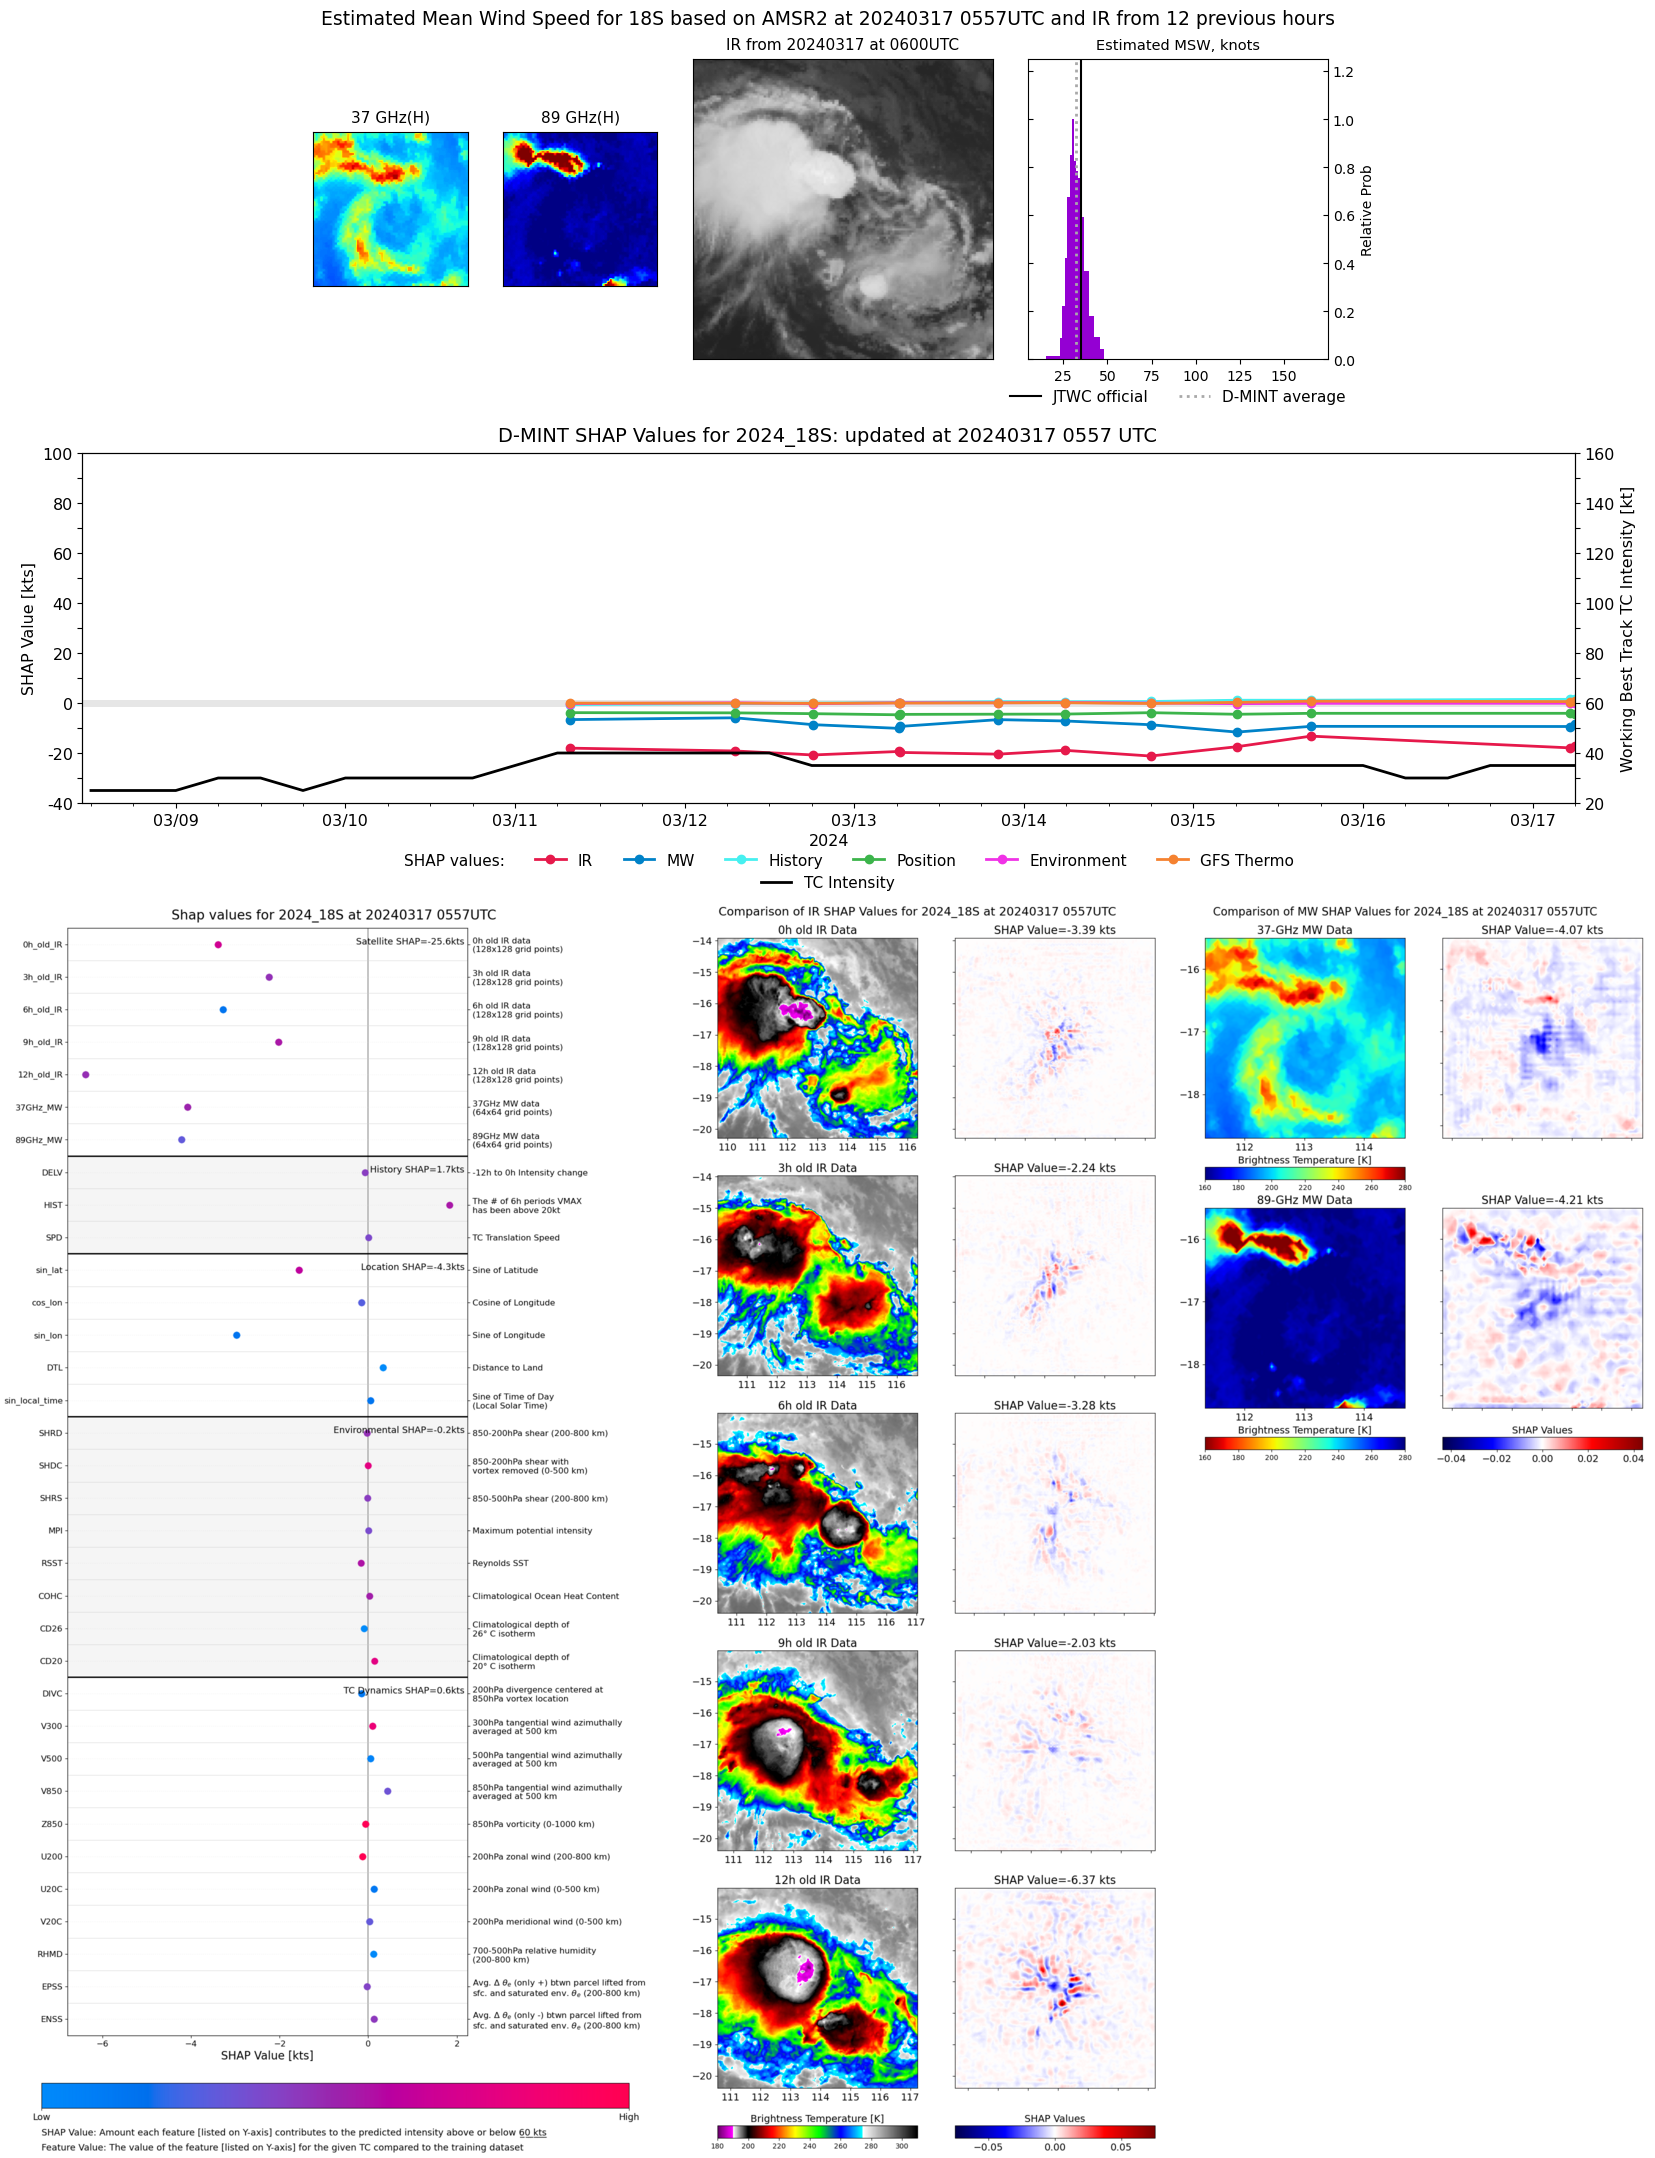 |
| 20240317 | 0518 UTC | GMI | 1002 hPa | 31 kts | 28 kts | 33 kts | 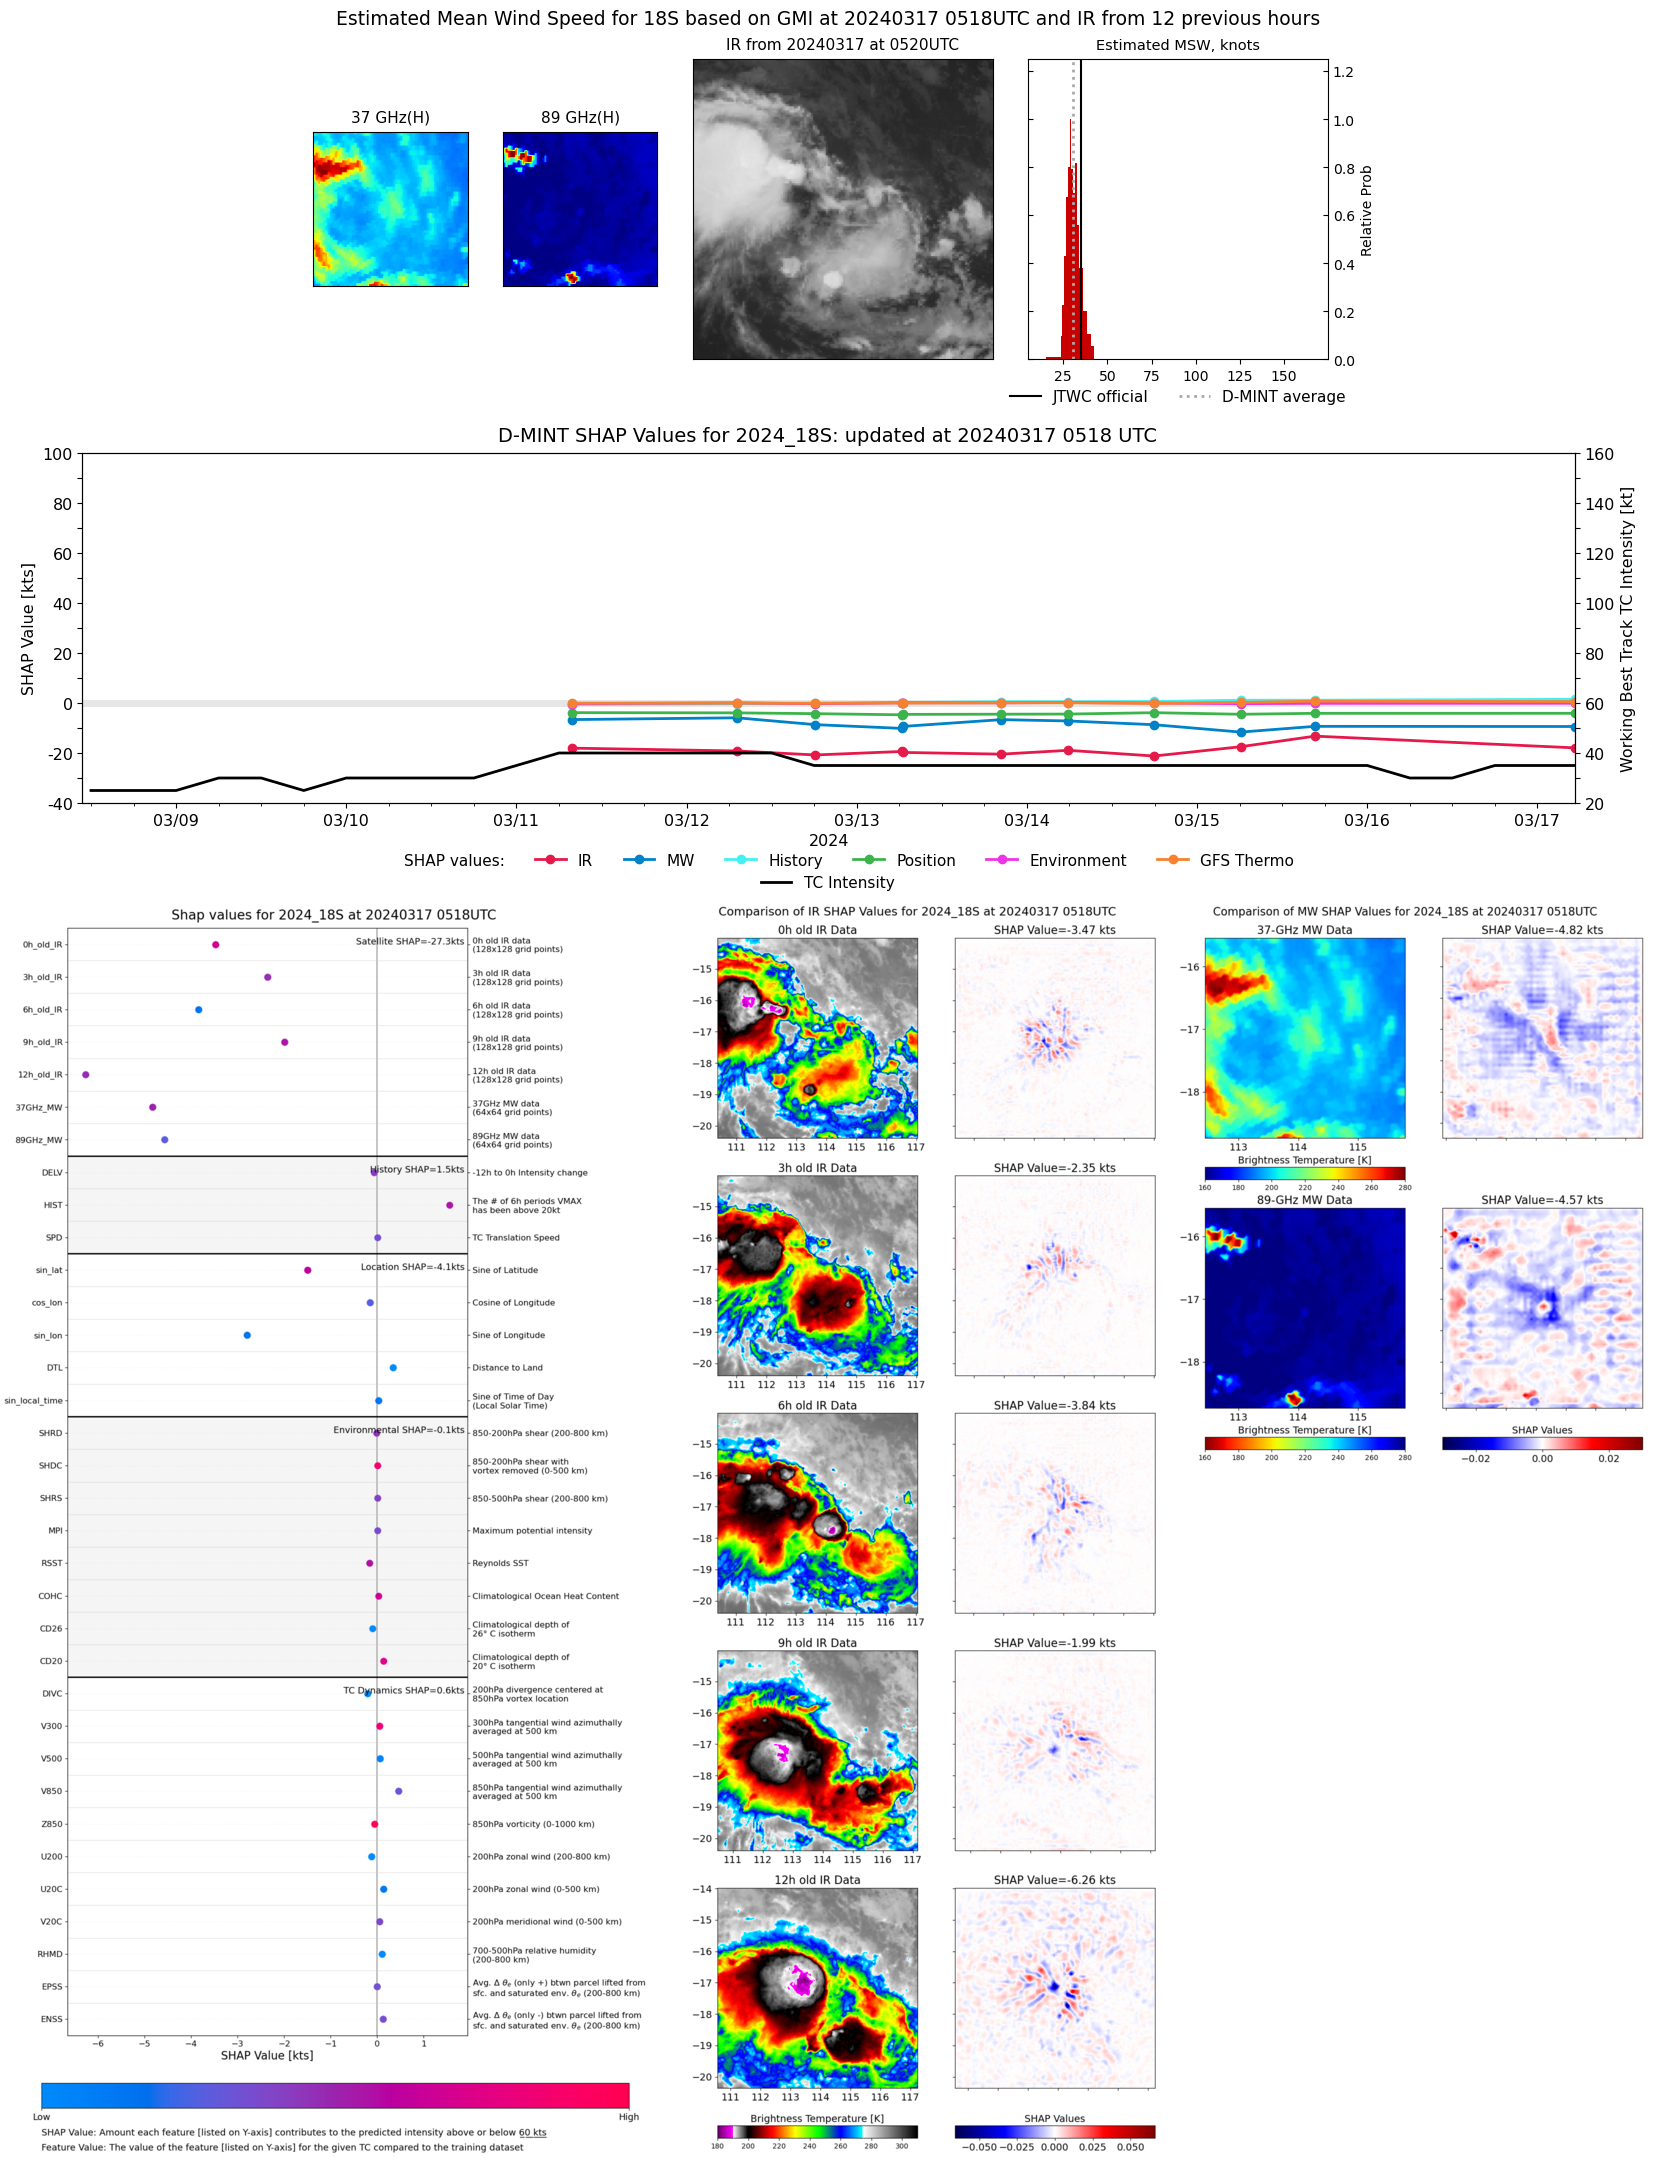 |
| 20240316 | 1745 UTC | AMSR2 | 996 hPa | 38 kts | 33 kts | 43 kts | 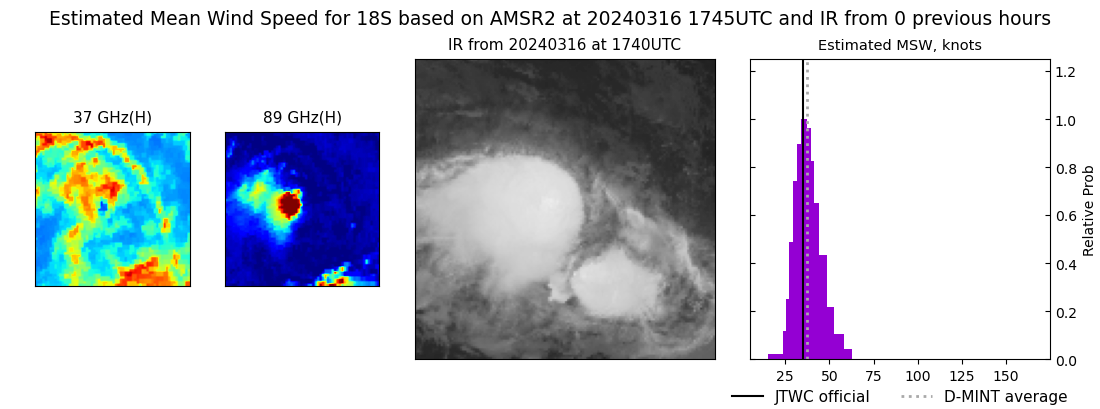 |
| 20240315 | 1638 UTC | GMI | 995 hPa | 35 kts | 32 kts | 39 kts | 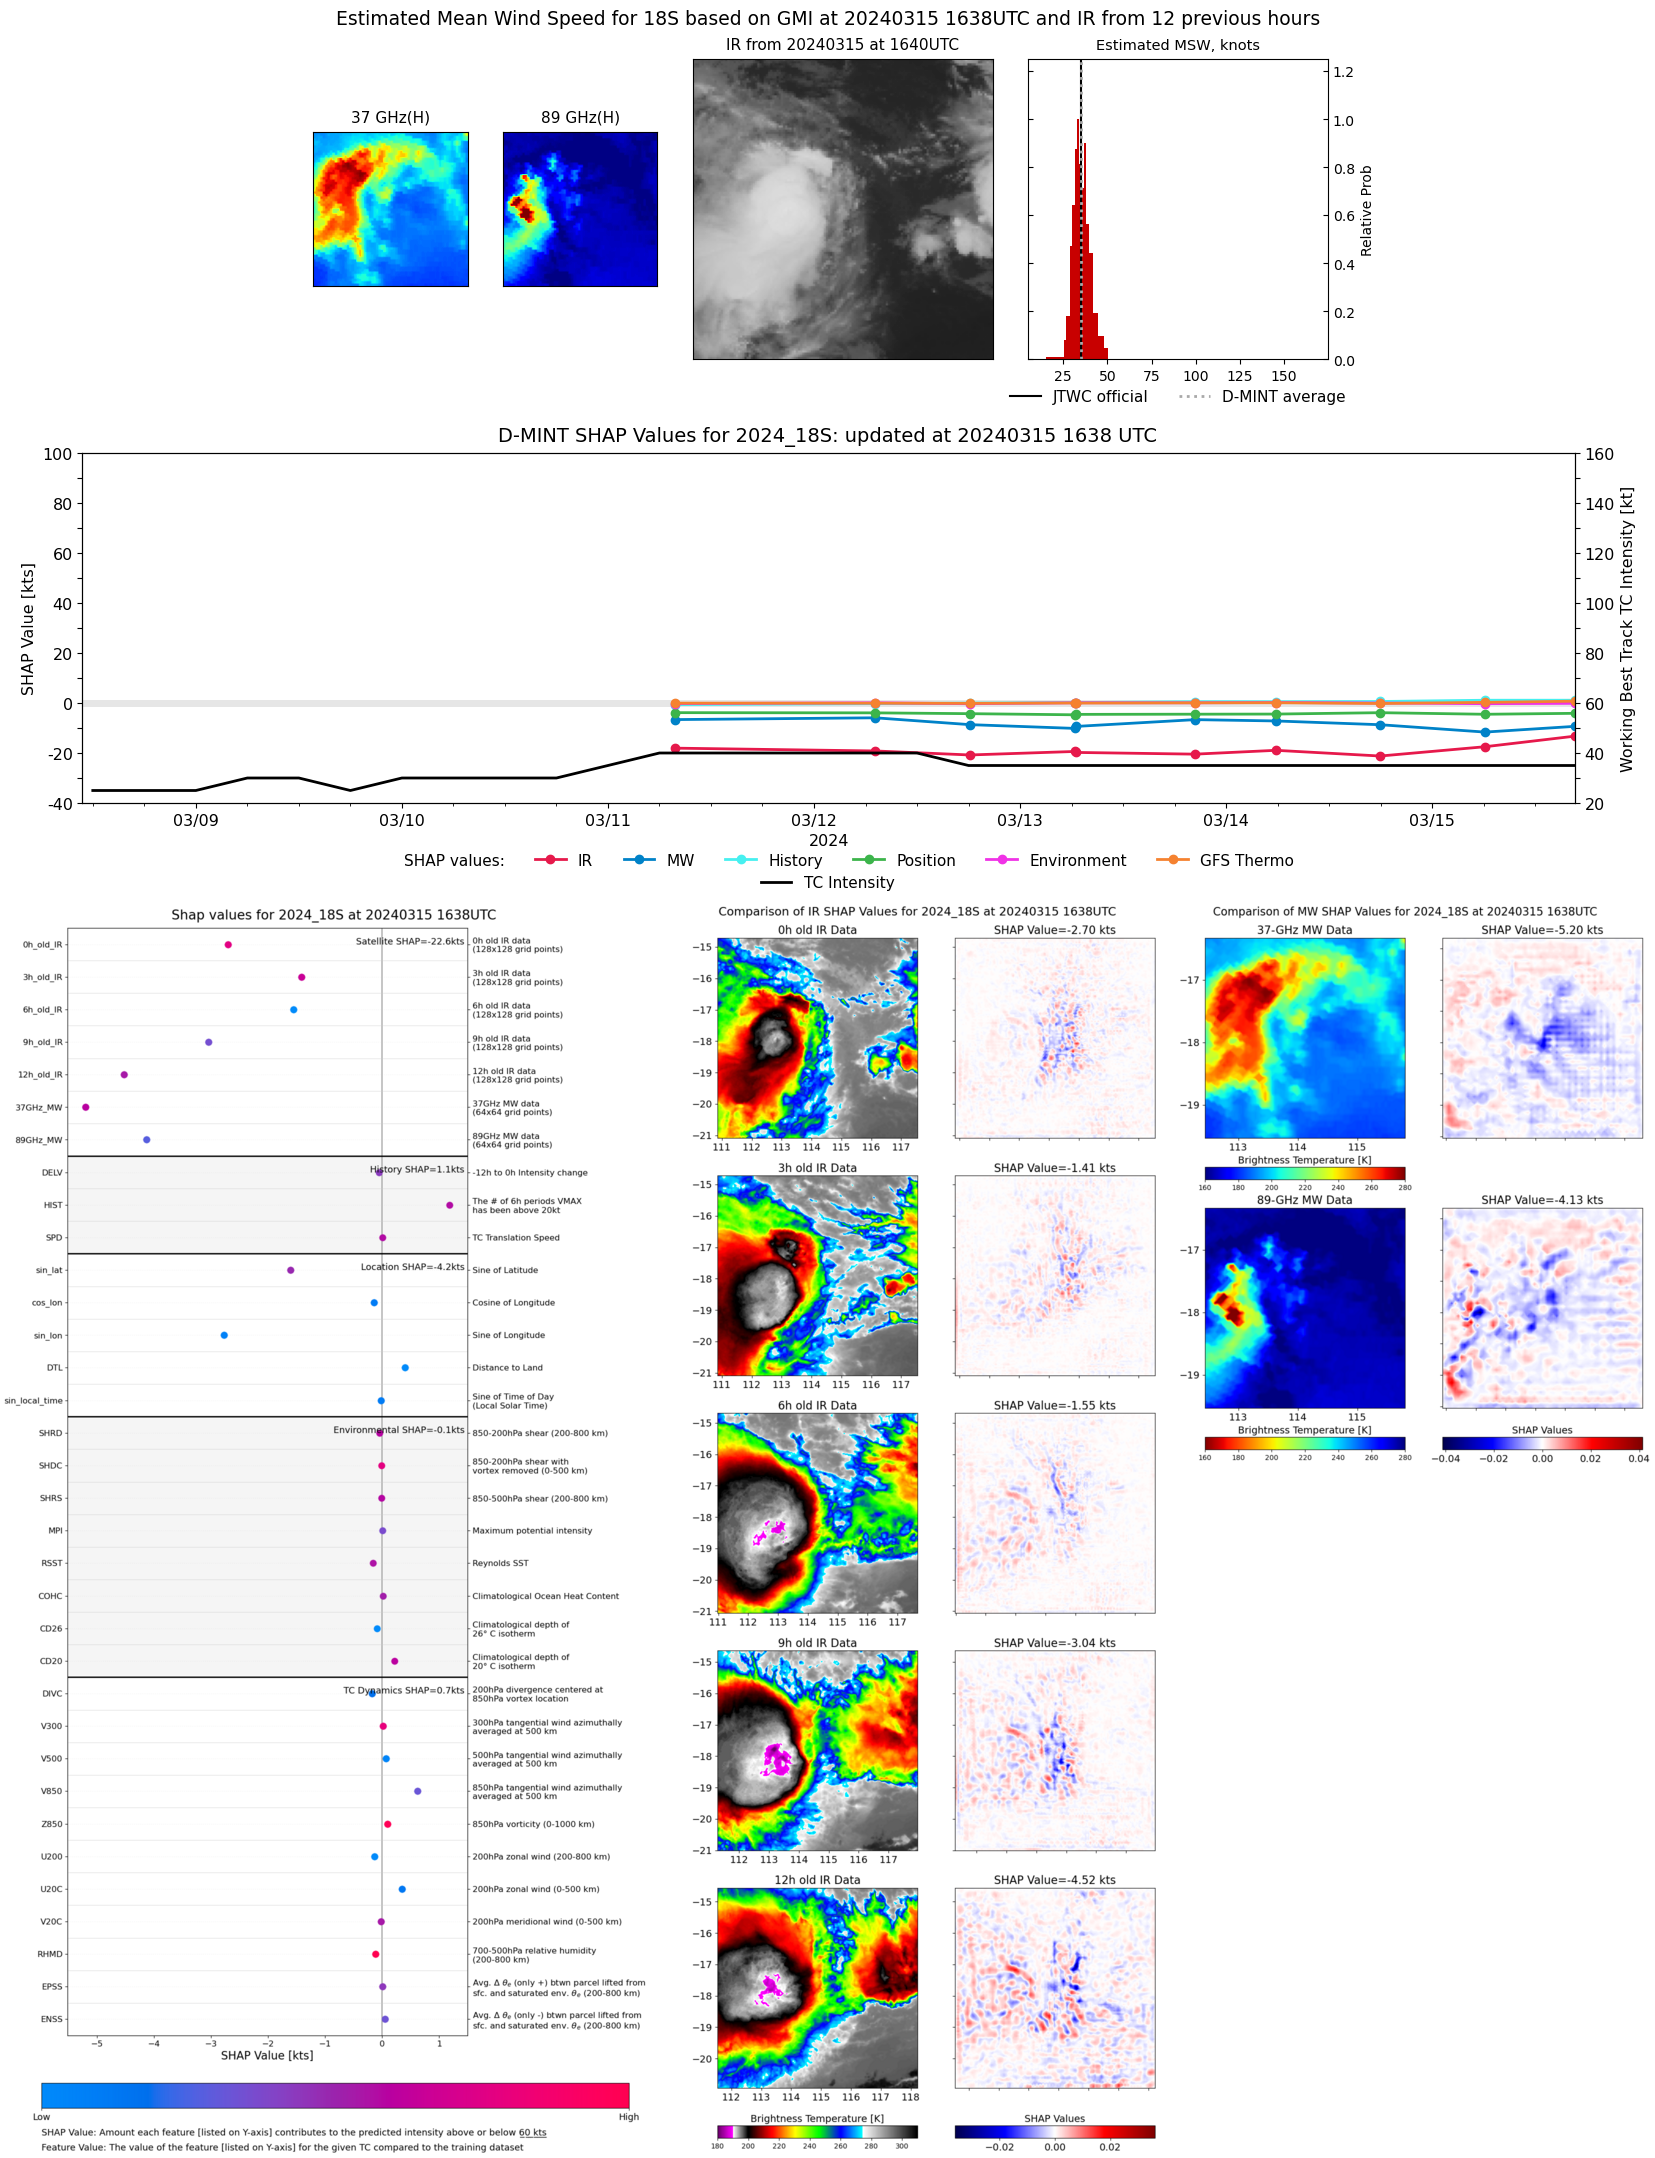 |
| 20240315 | 0609 UTC | AMSR2 | 999 hPa | 28 kts | 26 kts | 30 kts | 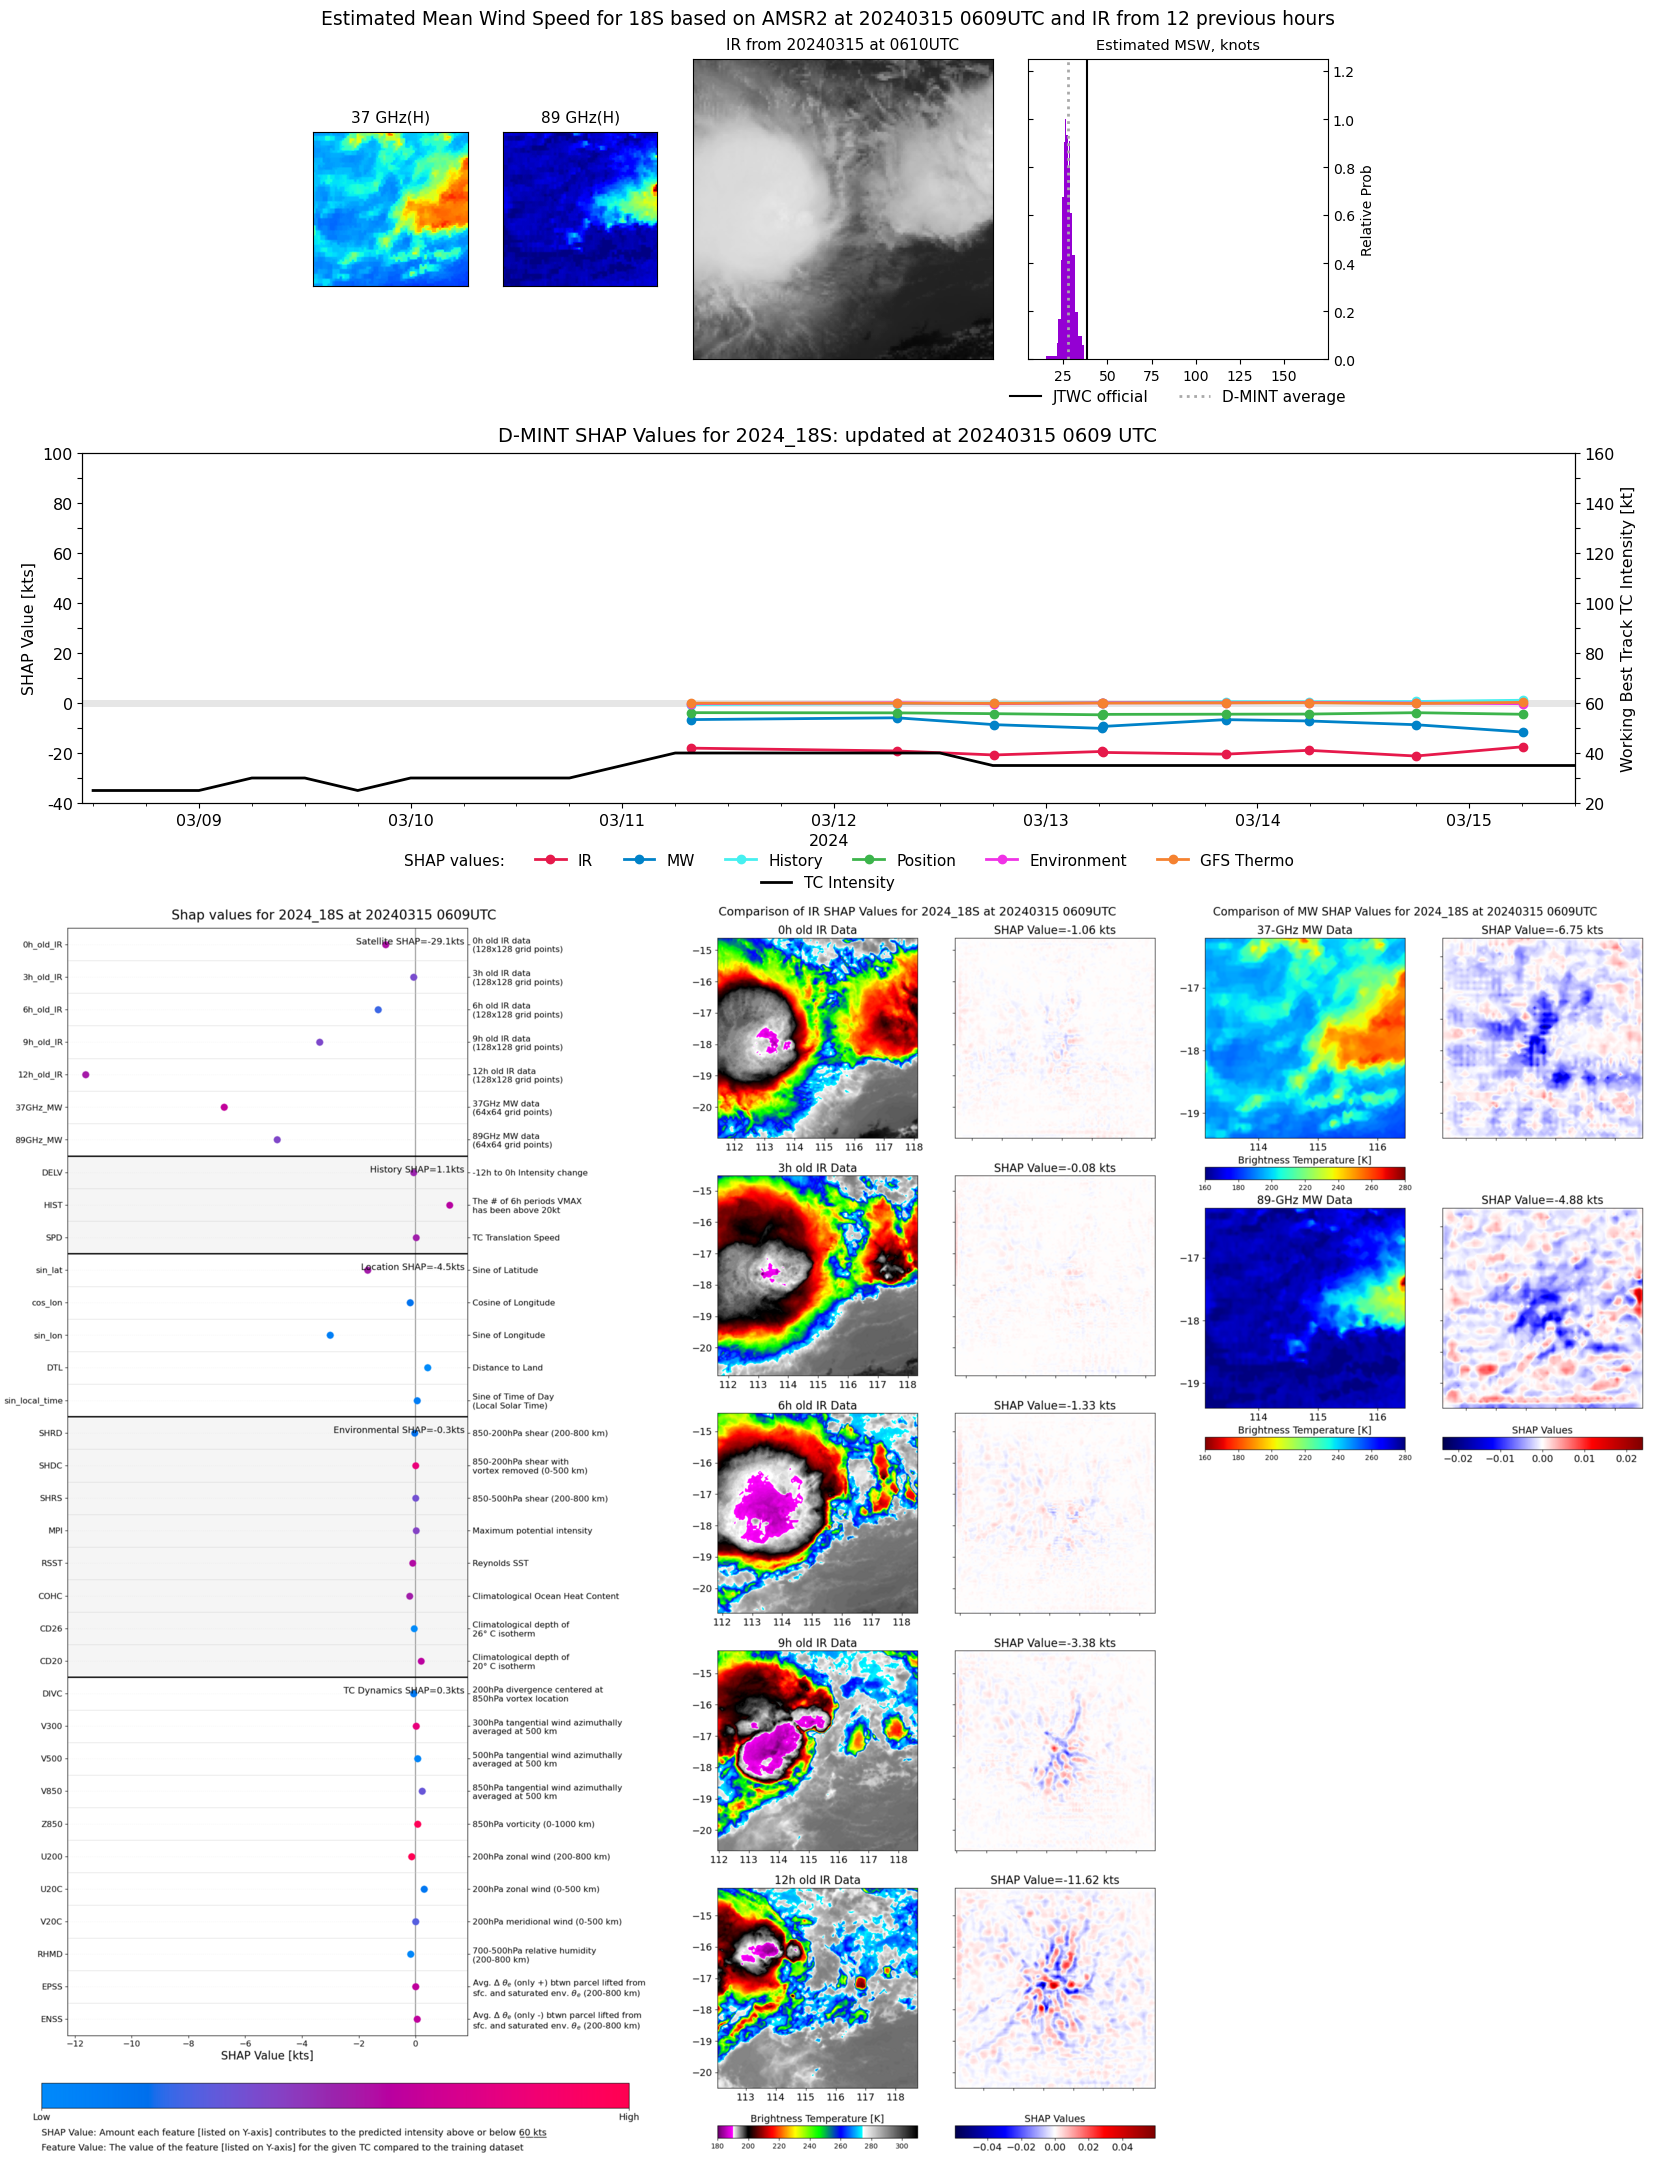 |
| 20240314 | 1757 UTC | AMSR2 | 1000 hPa | 27 kts | 25 kts | 29 kts | 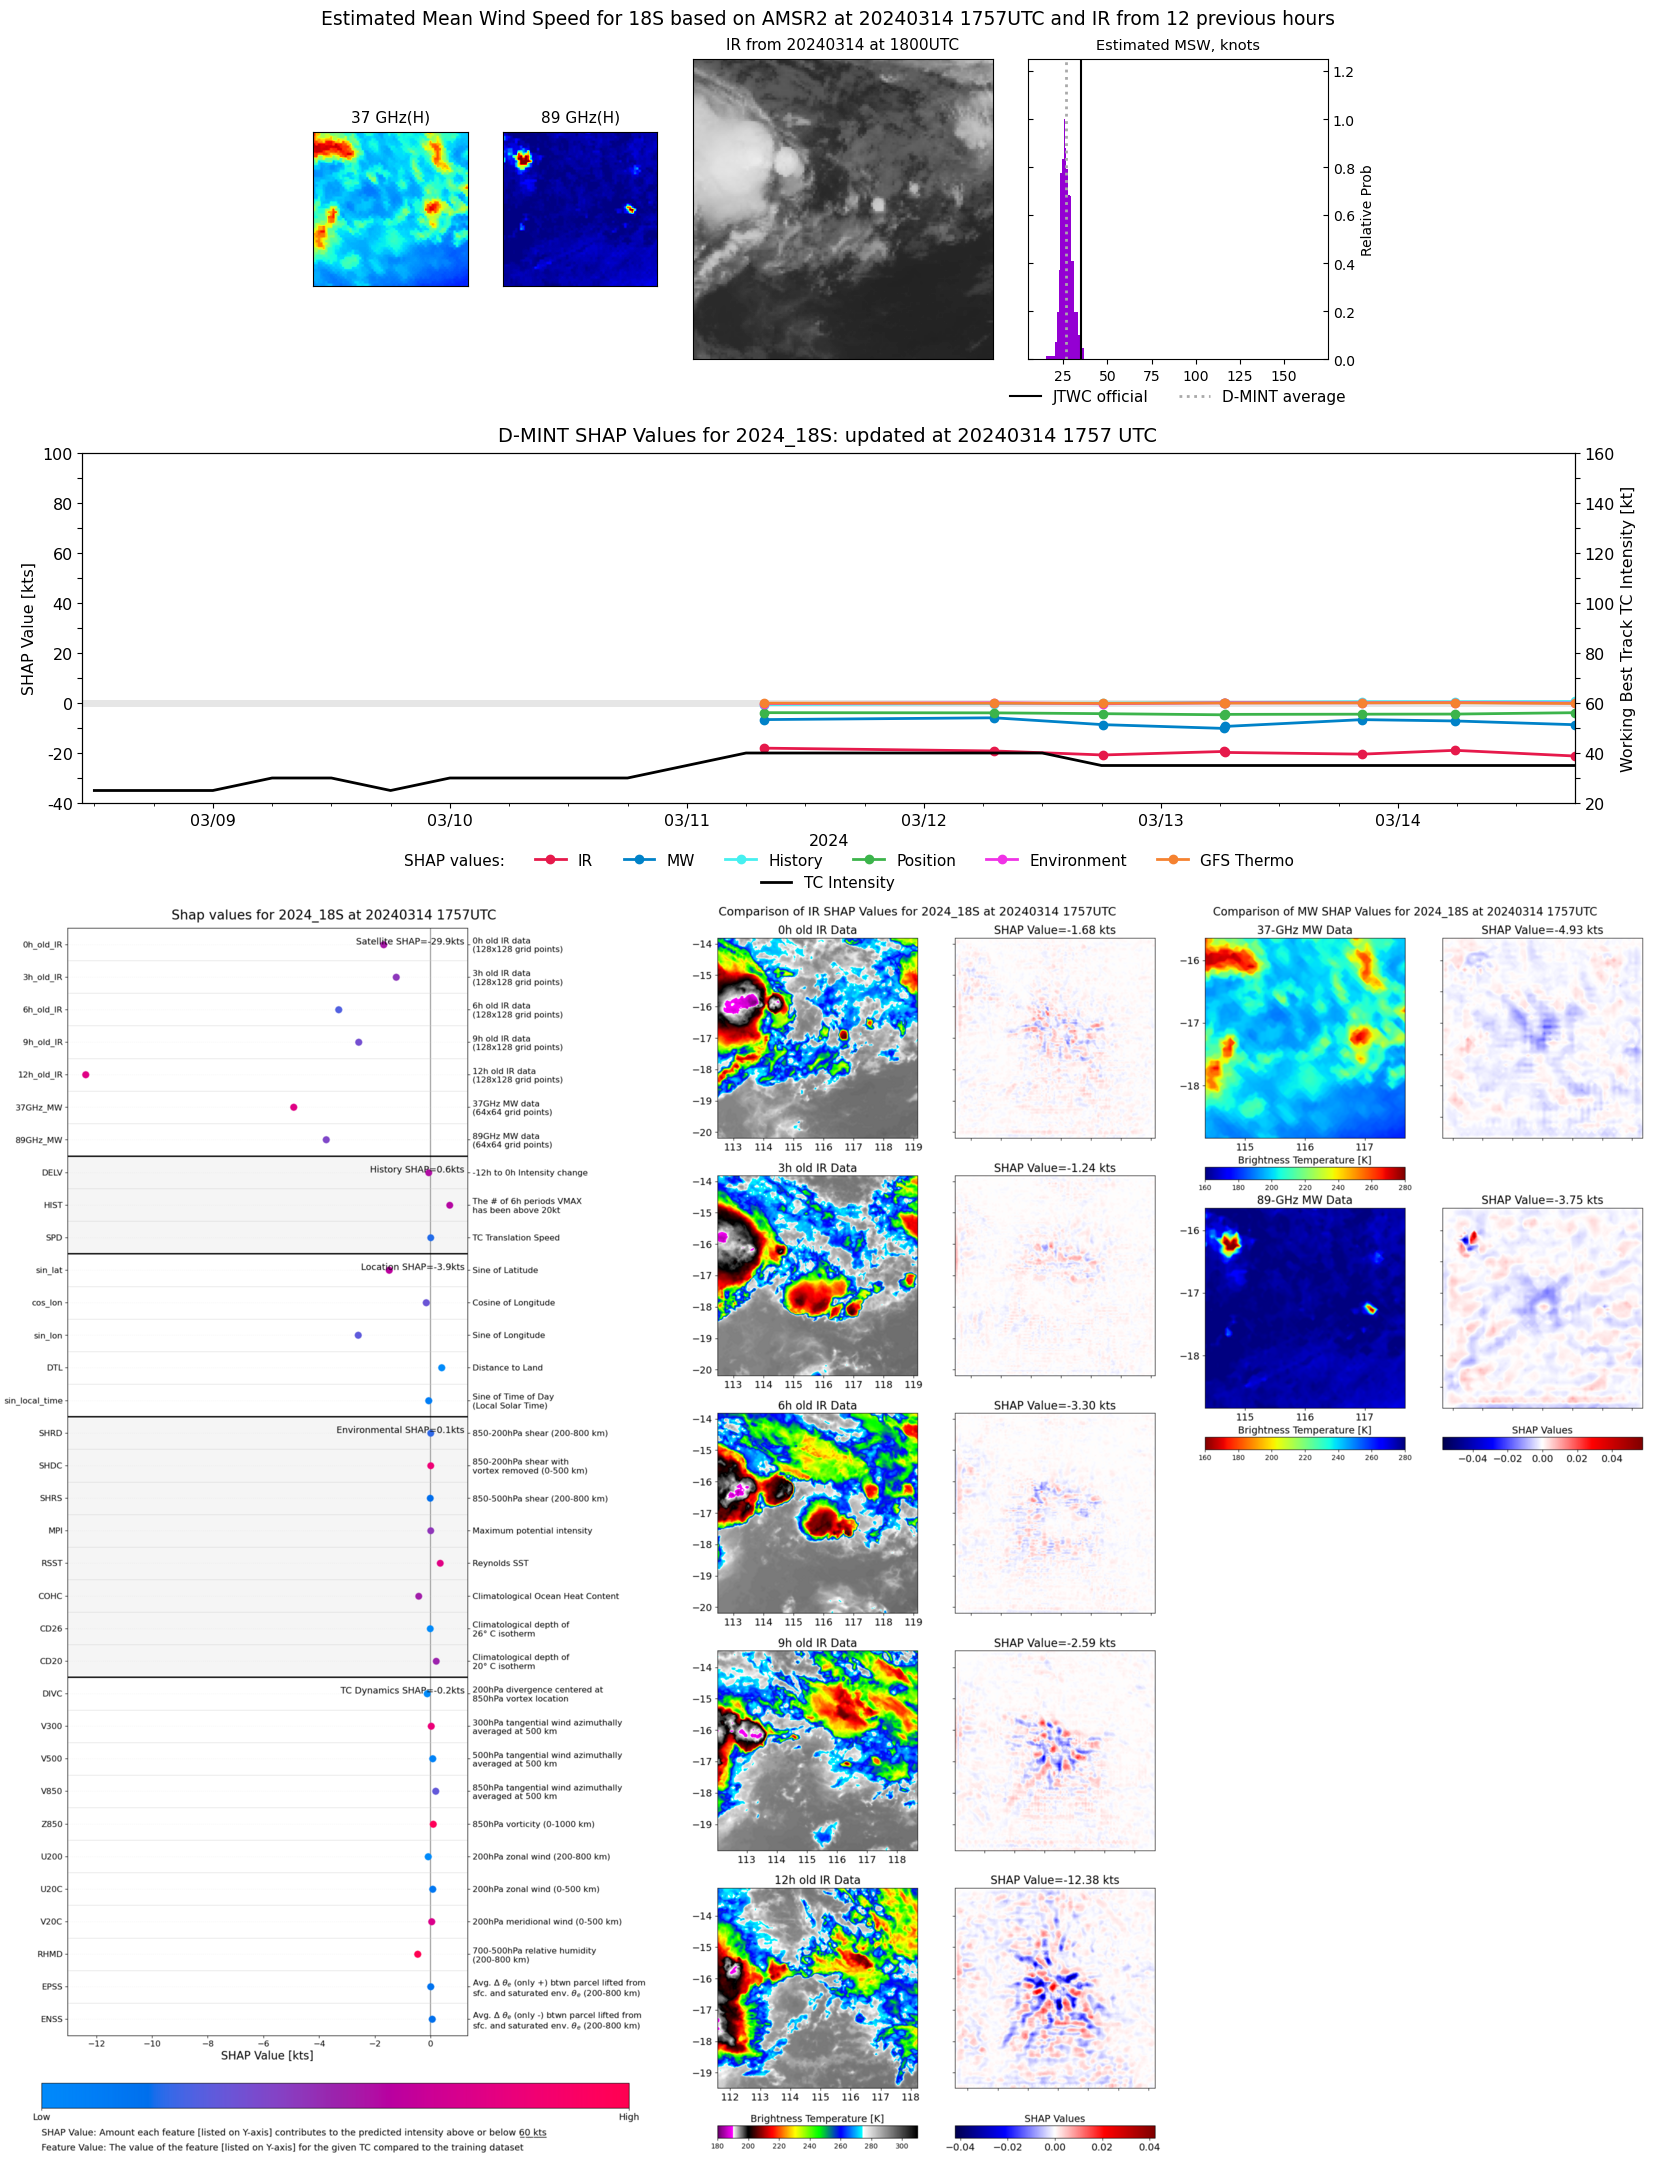 |
| 20240314 | 0548 UTC | GMI | 999 hPa | 30 kts | 27 kts | 33 kts | 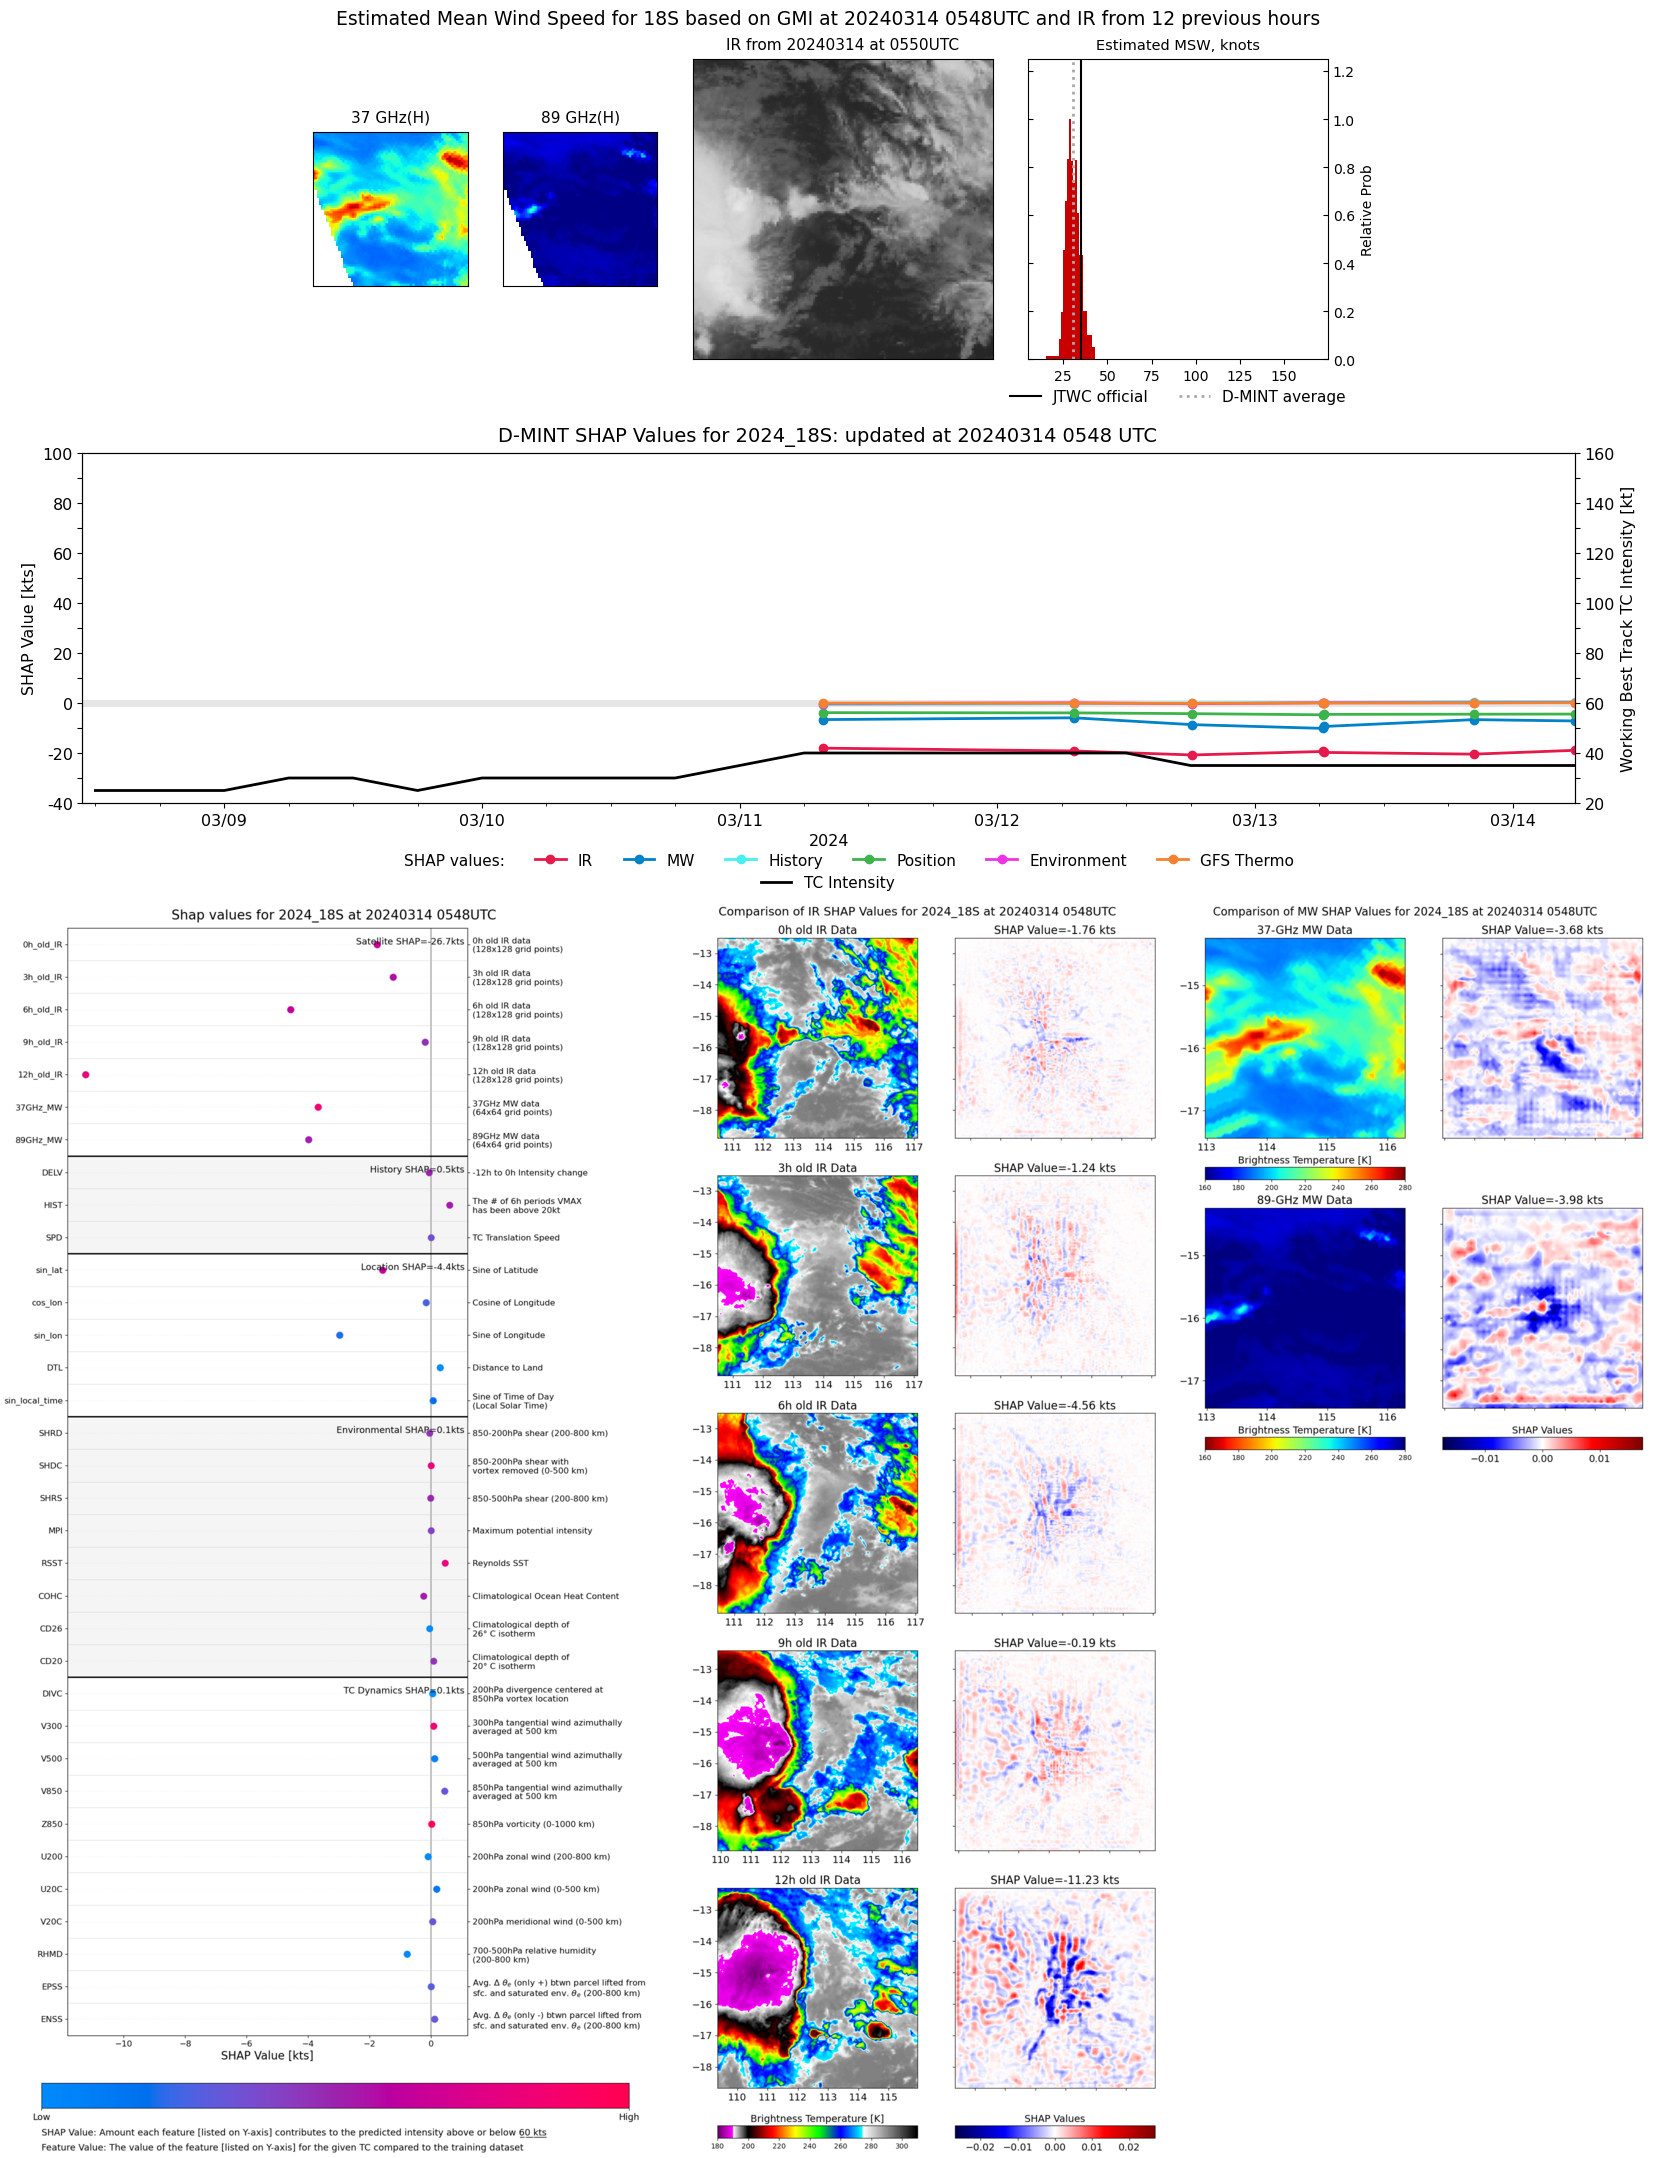 |
| 20240313 | 2023 UTC | SSMISF18 | 998 hPa | 29 kts | 26 kts | 32 kts | 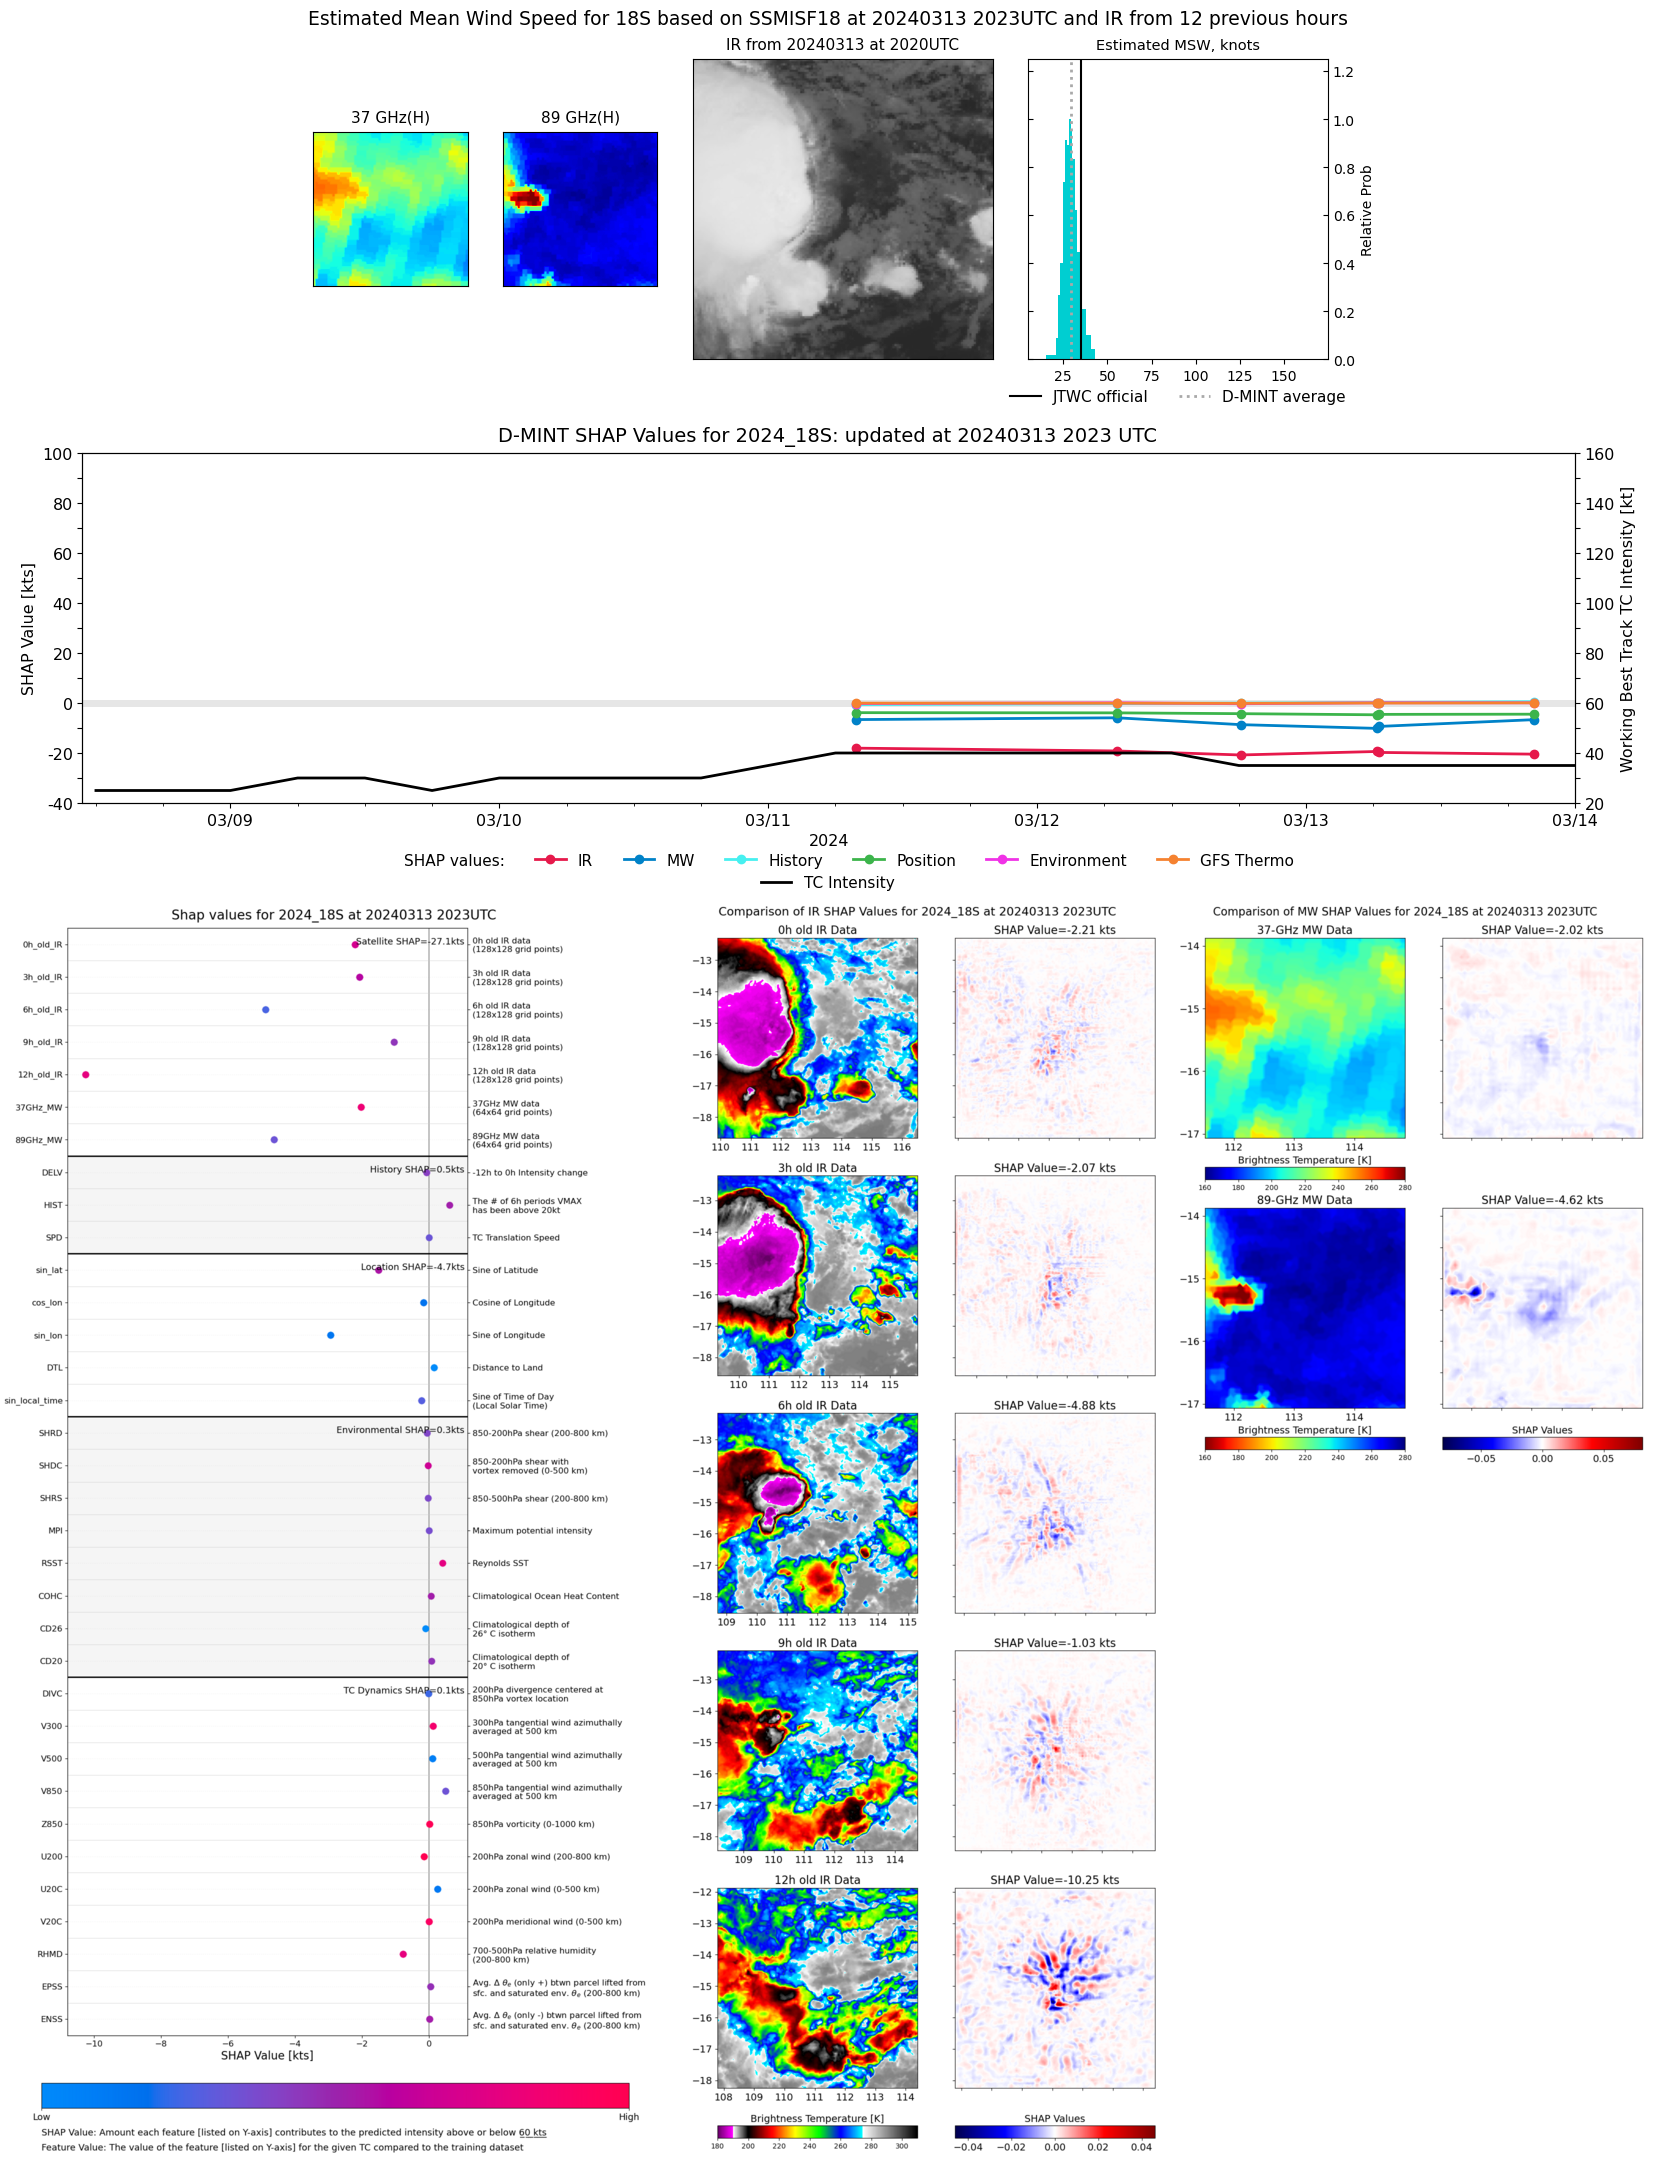 |
| 20240313 | 0628 UTC | GMI | 999 hPa | 27 kts | 25 kts | 30 kts | 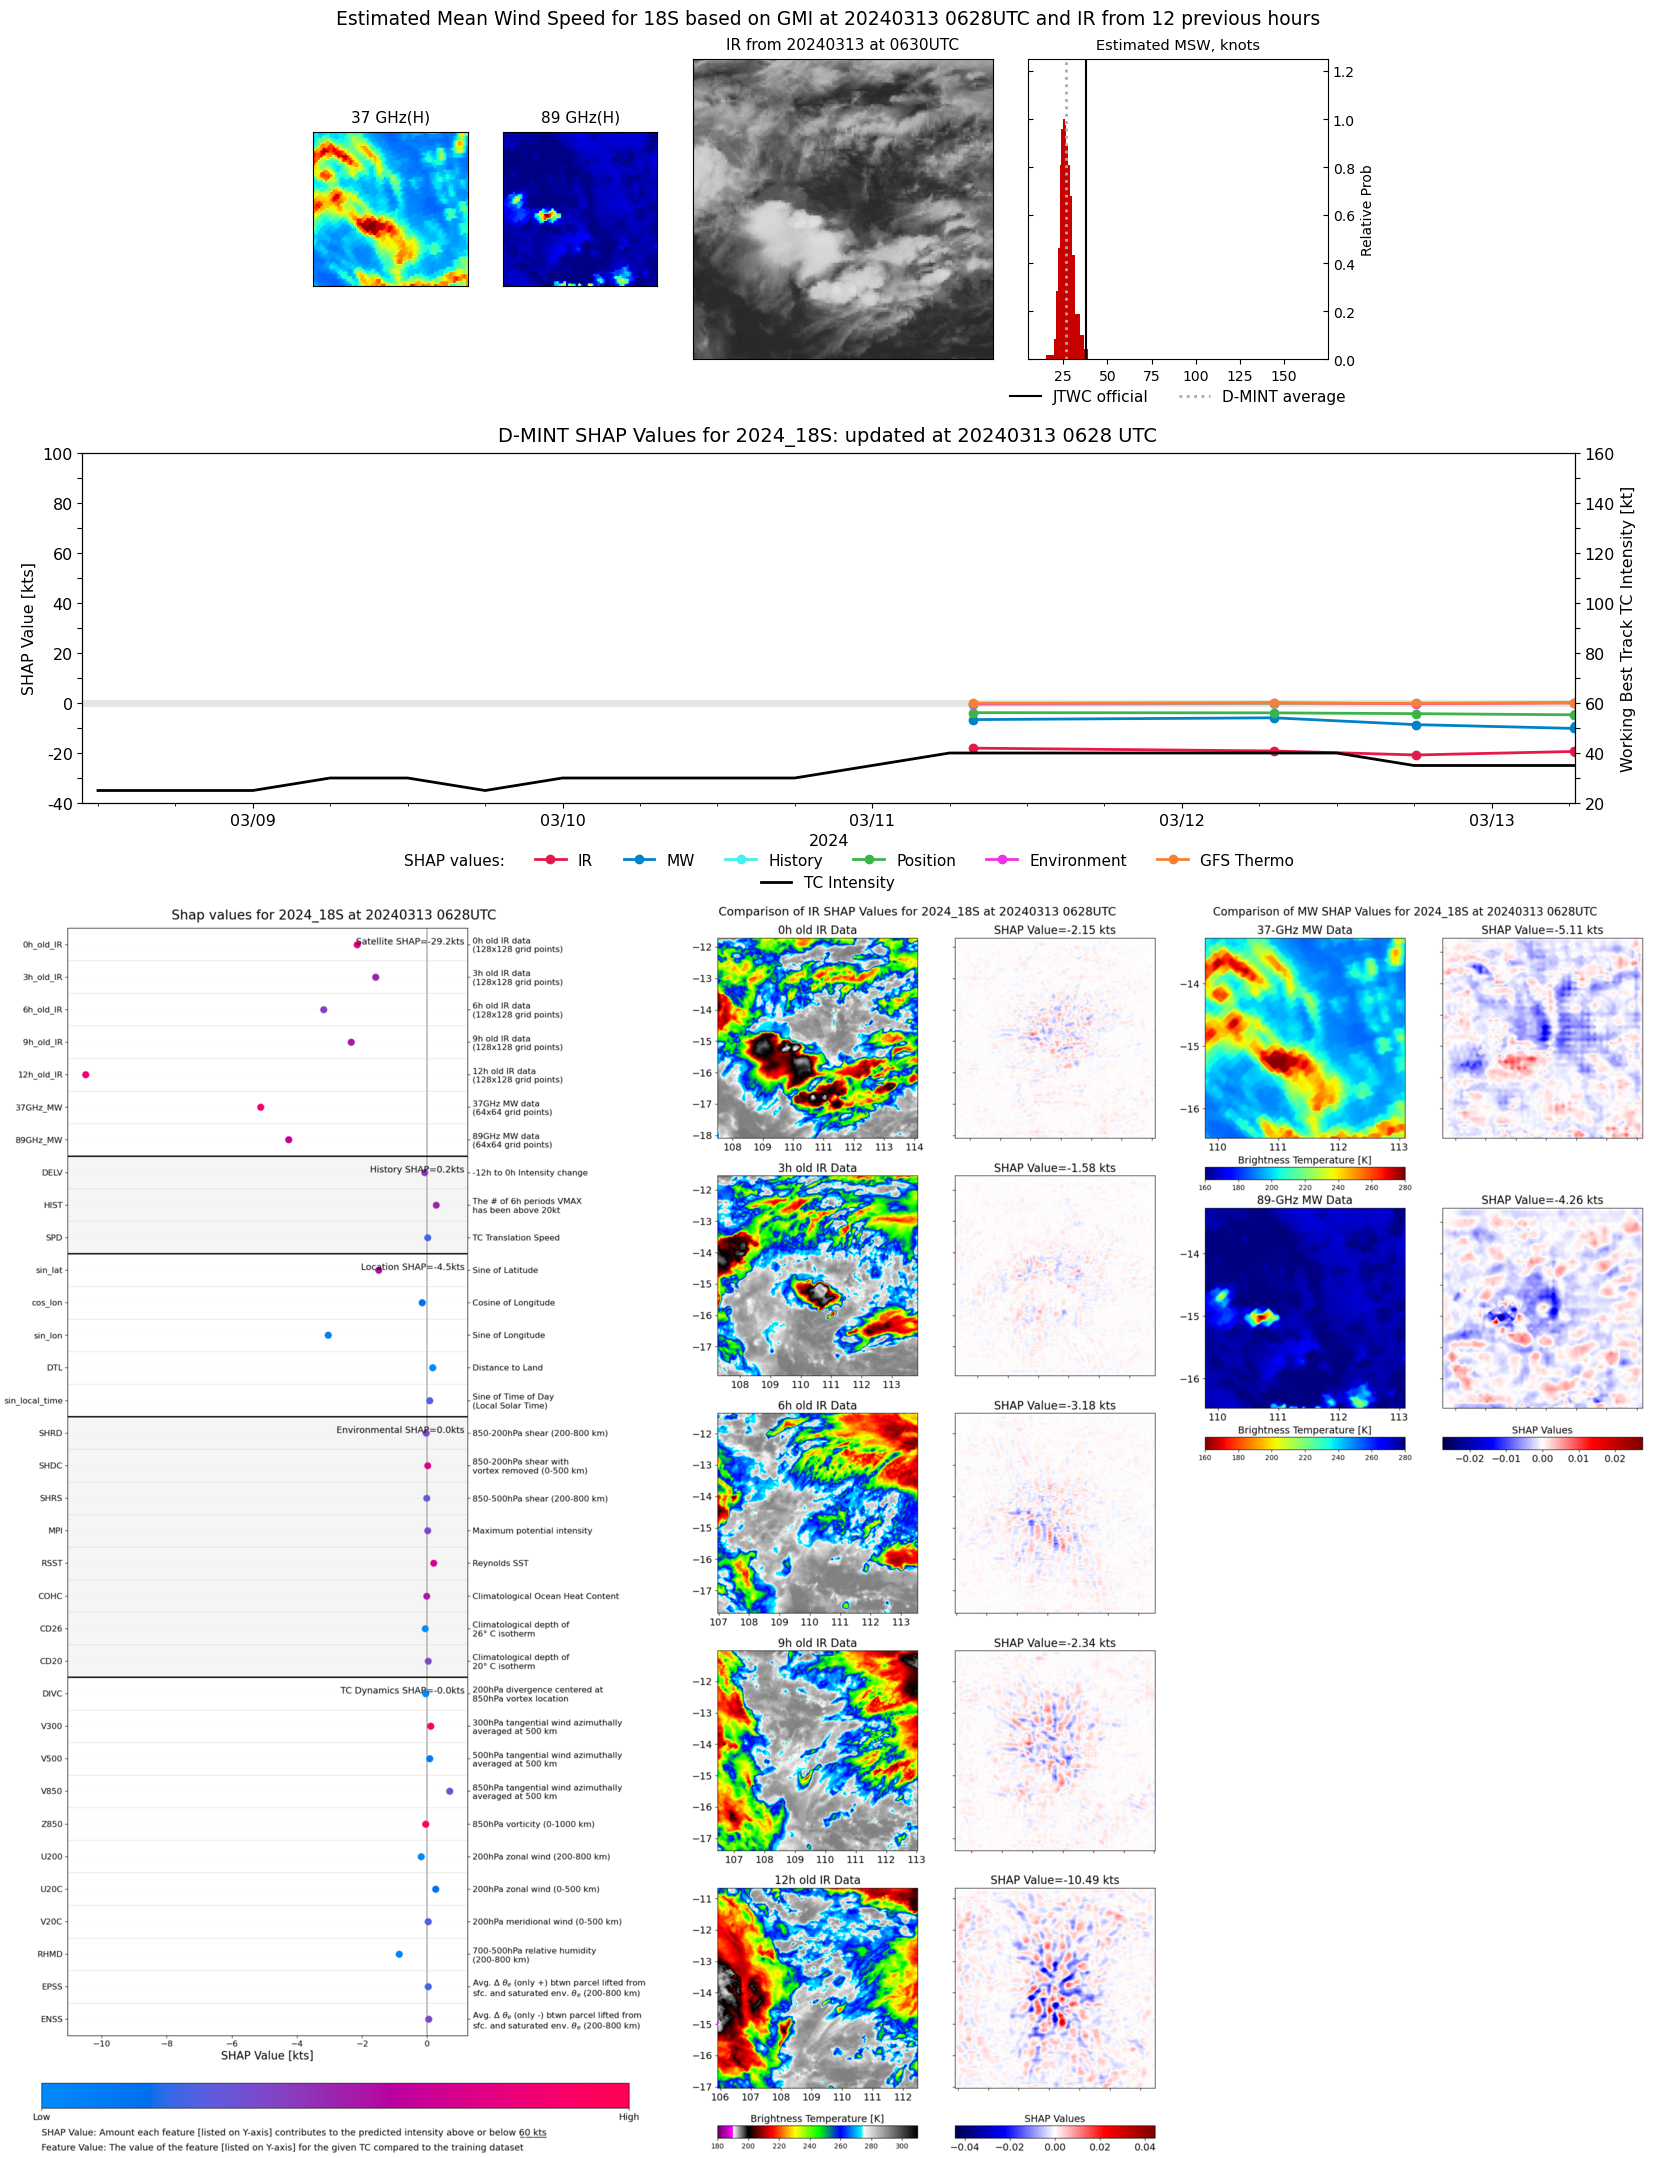 |
| 20240313 | 0622 UTC | AMSR2 | 999 hPa | 26 kts | 24 kts | 29 kts | 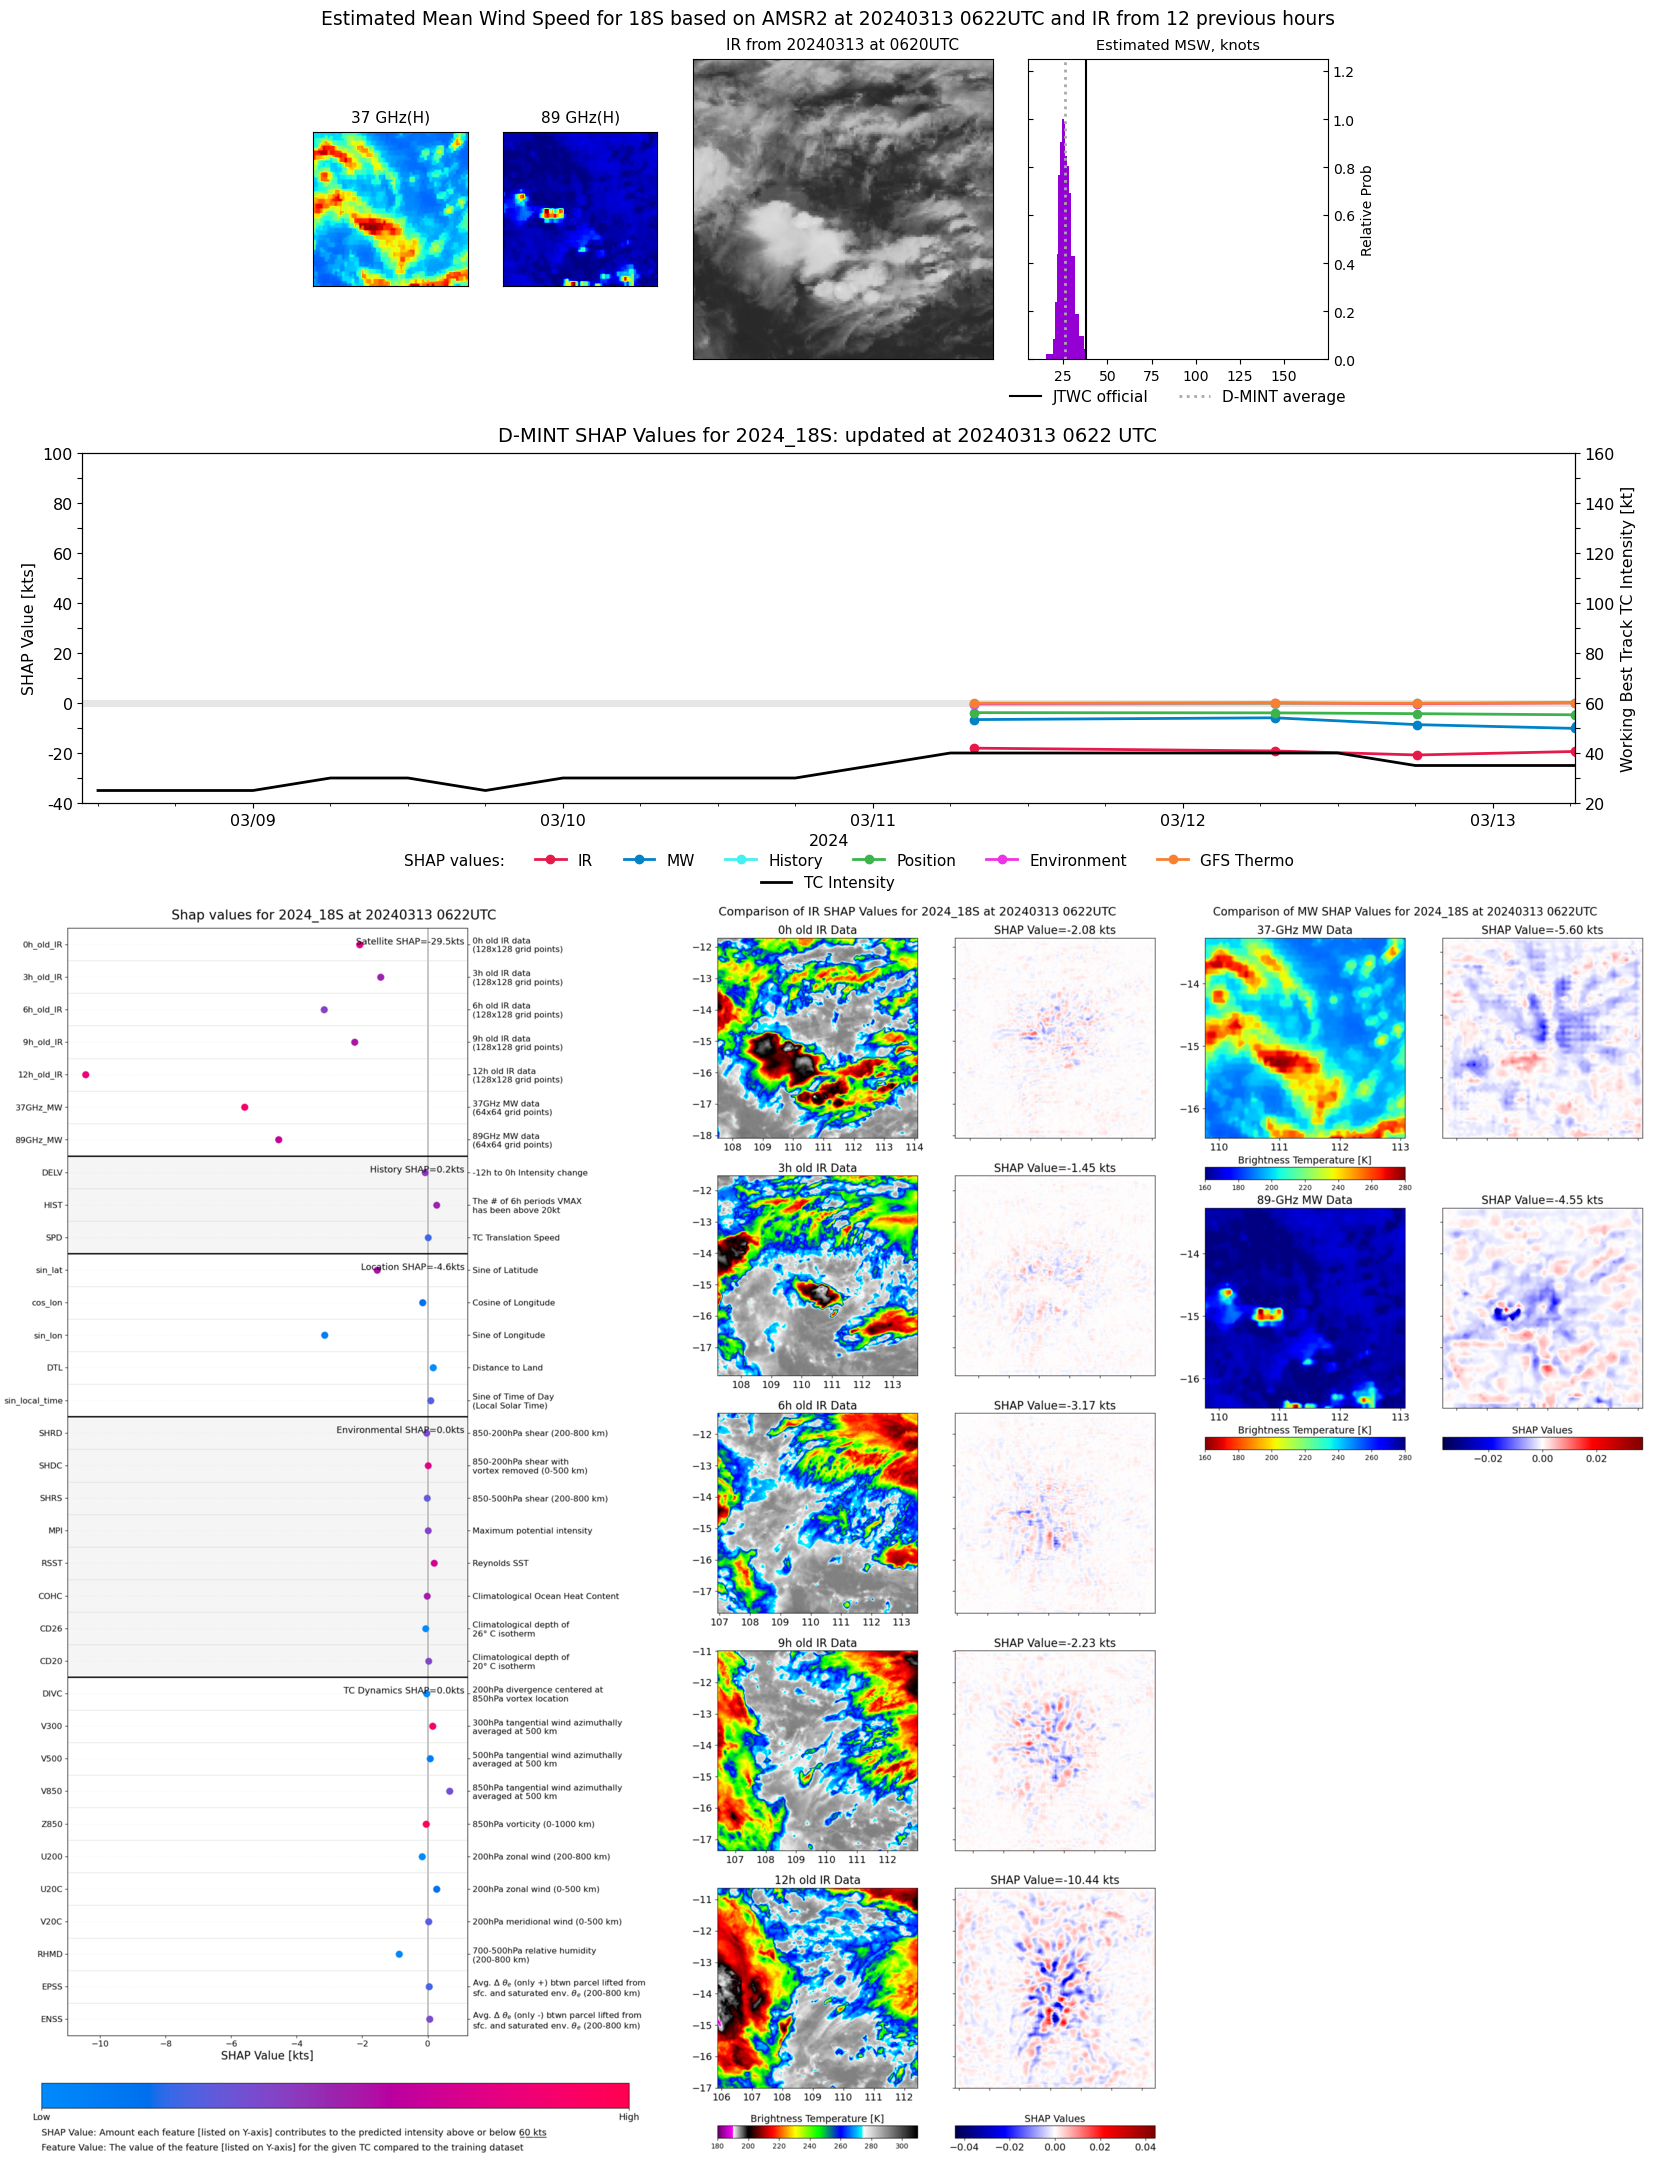 |
| 20240312 | 1809 UTC | AMSR2 | 1001 hPa | 26 kts | 24 kts | 28 kts | 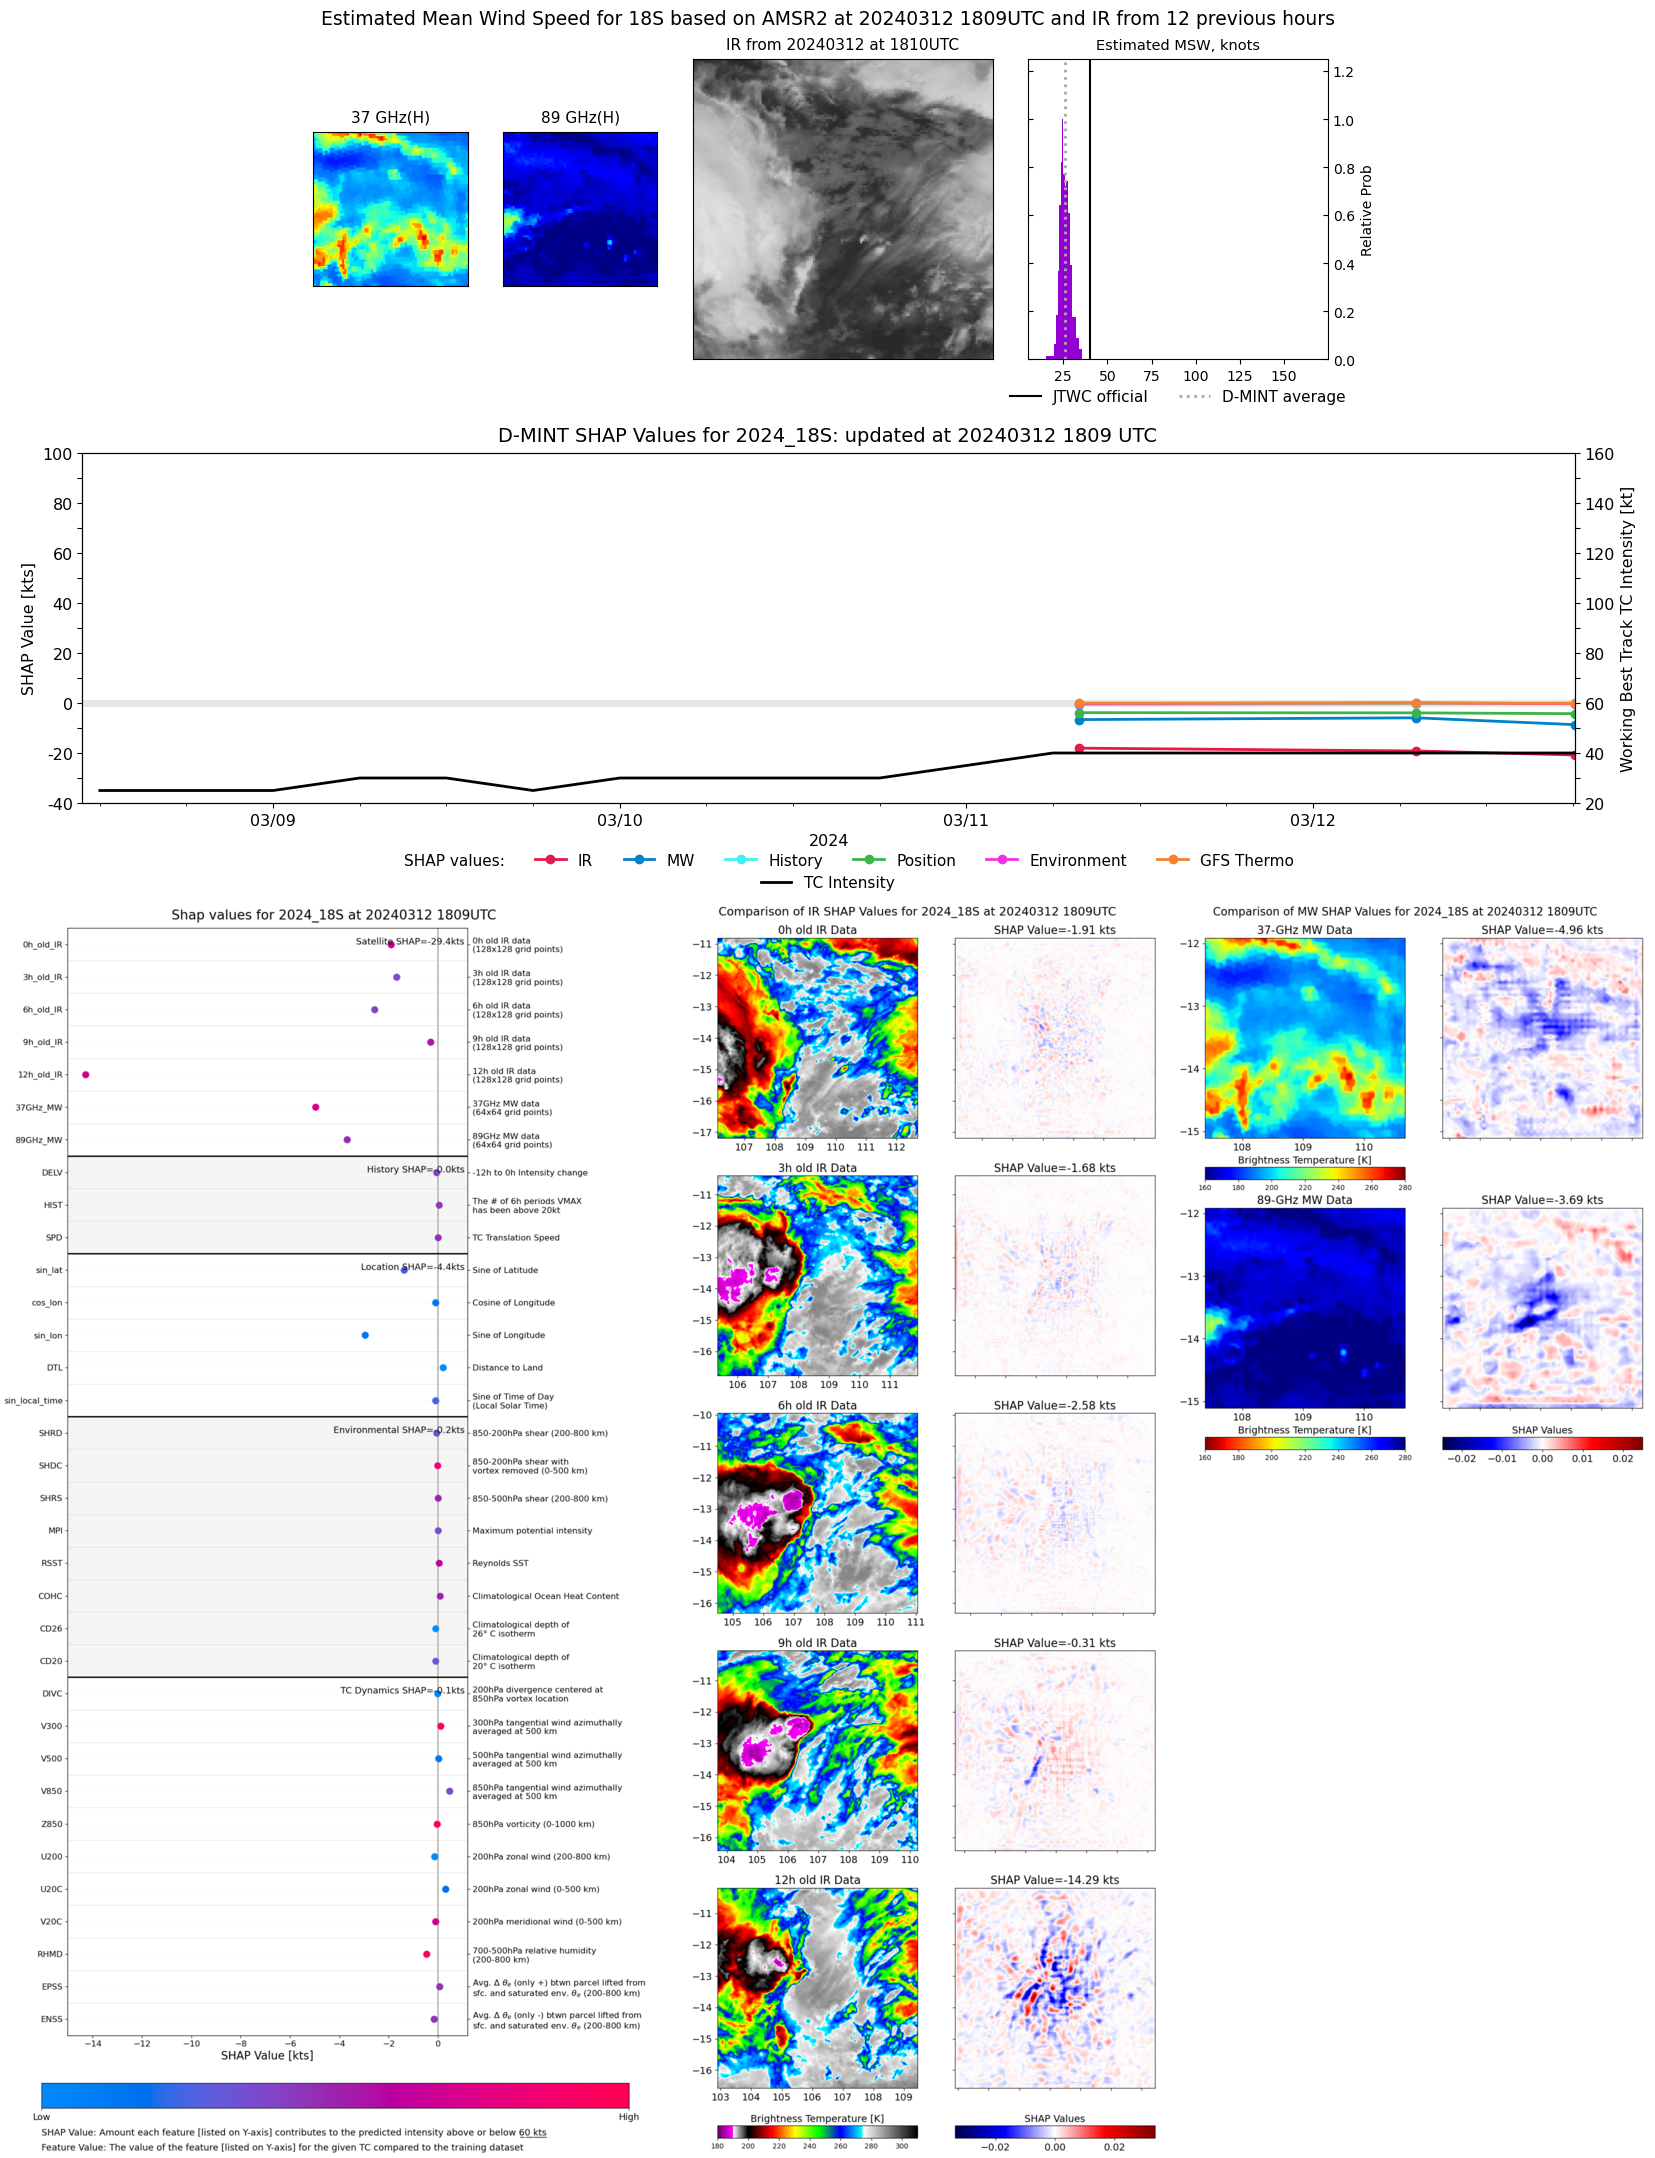 |
| 20240312 | 0708 UTC | GMI | 998 hPa | 30 kts | 28 kts | 33 kts | 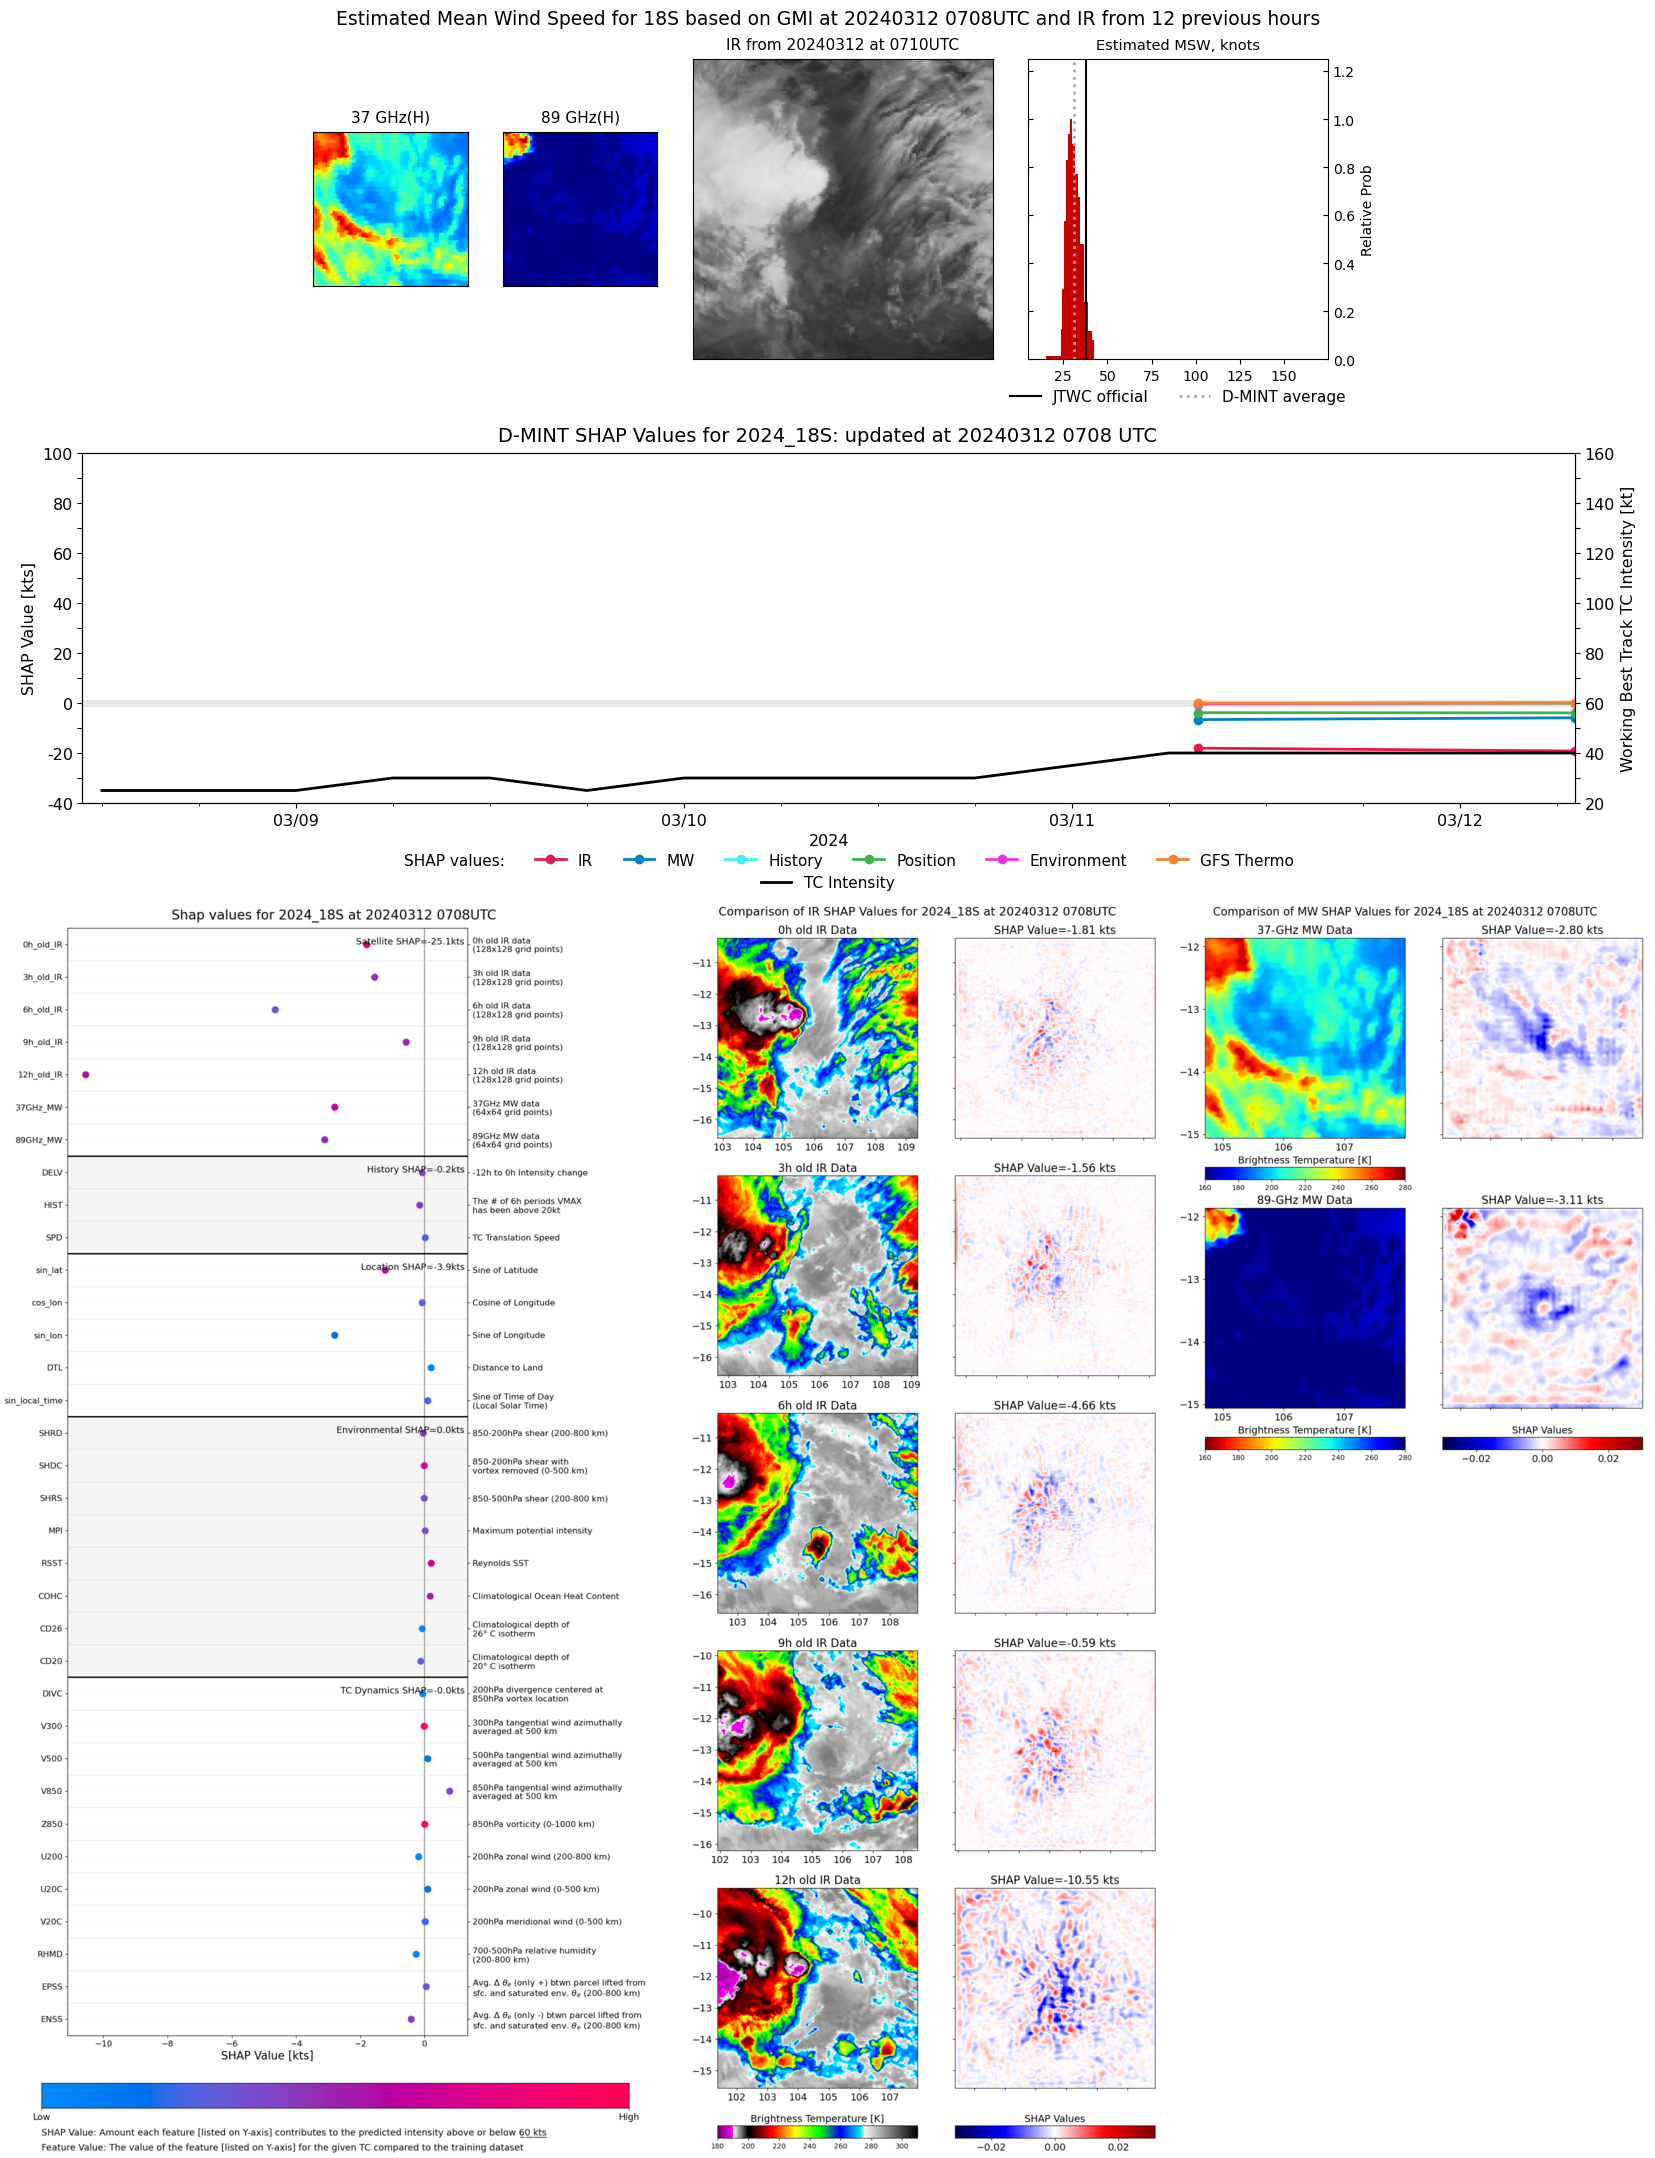 |
| 20240311 | 0748 UTC | GMI | 1002 hPa | 31 kts | 28 kts | 34 kts | 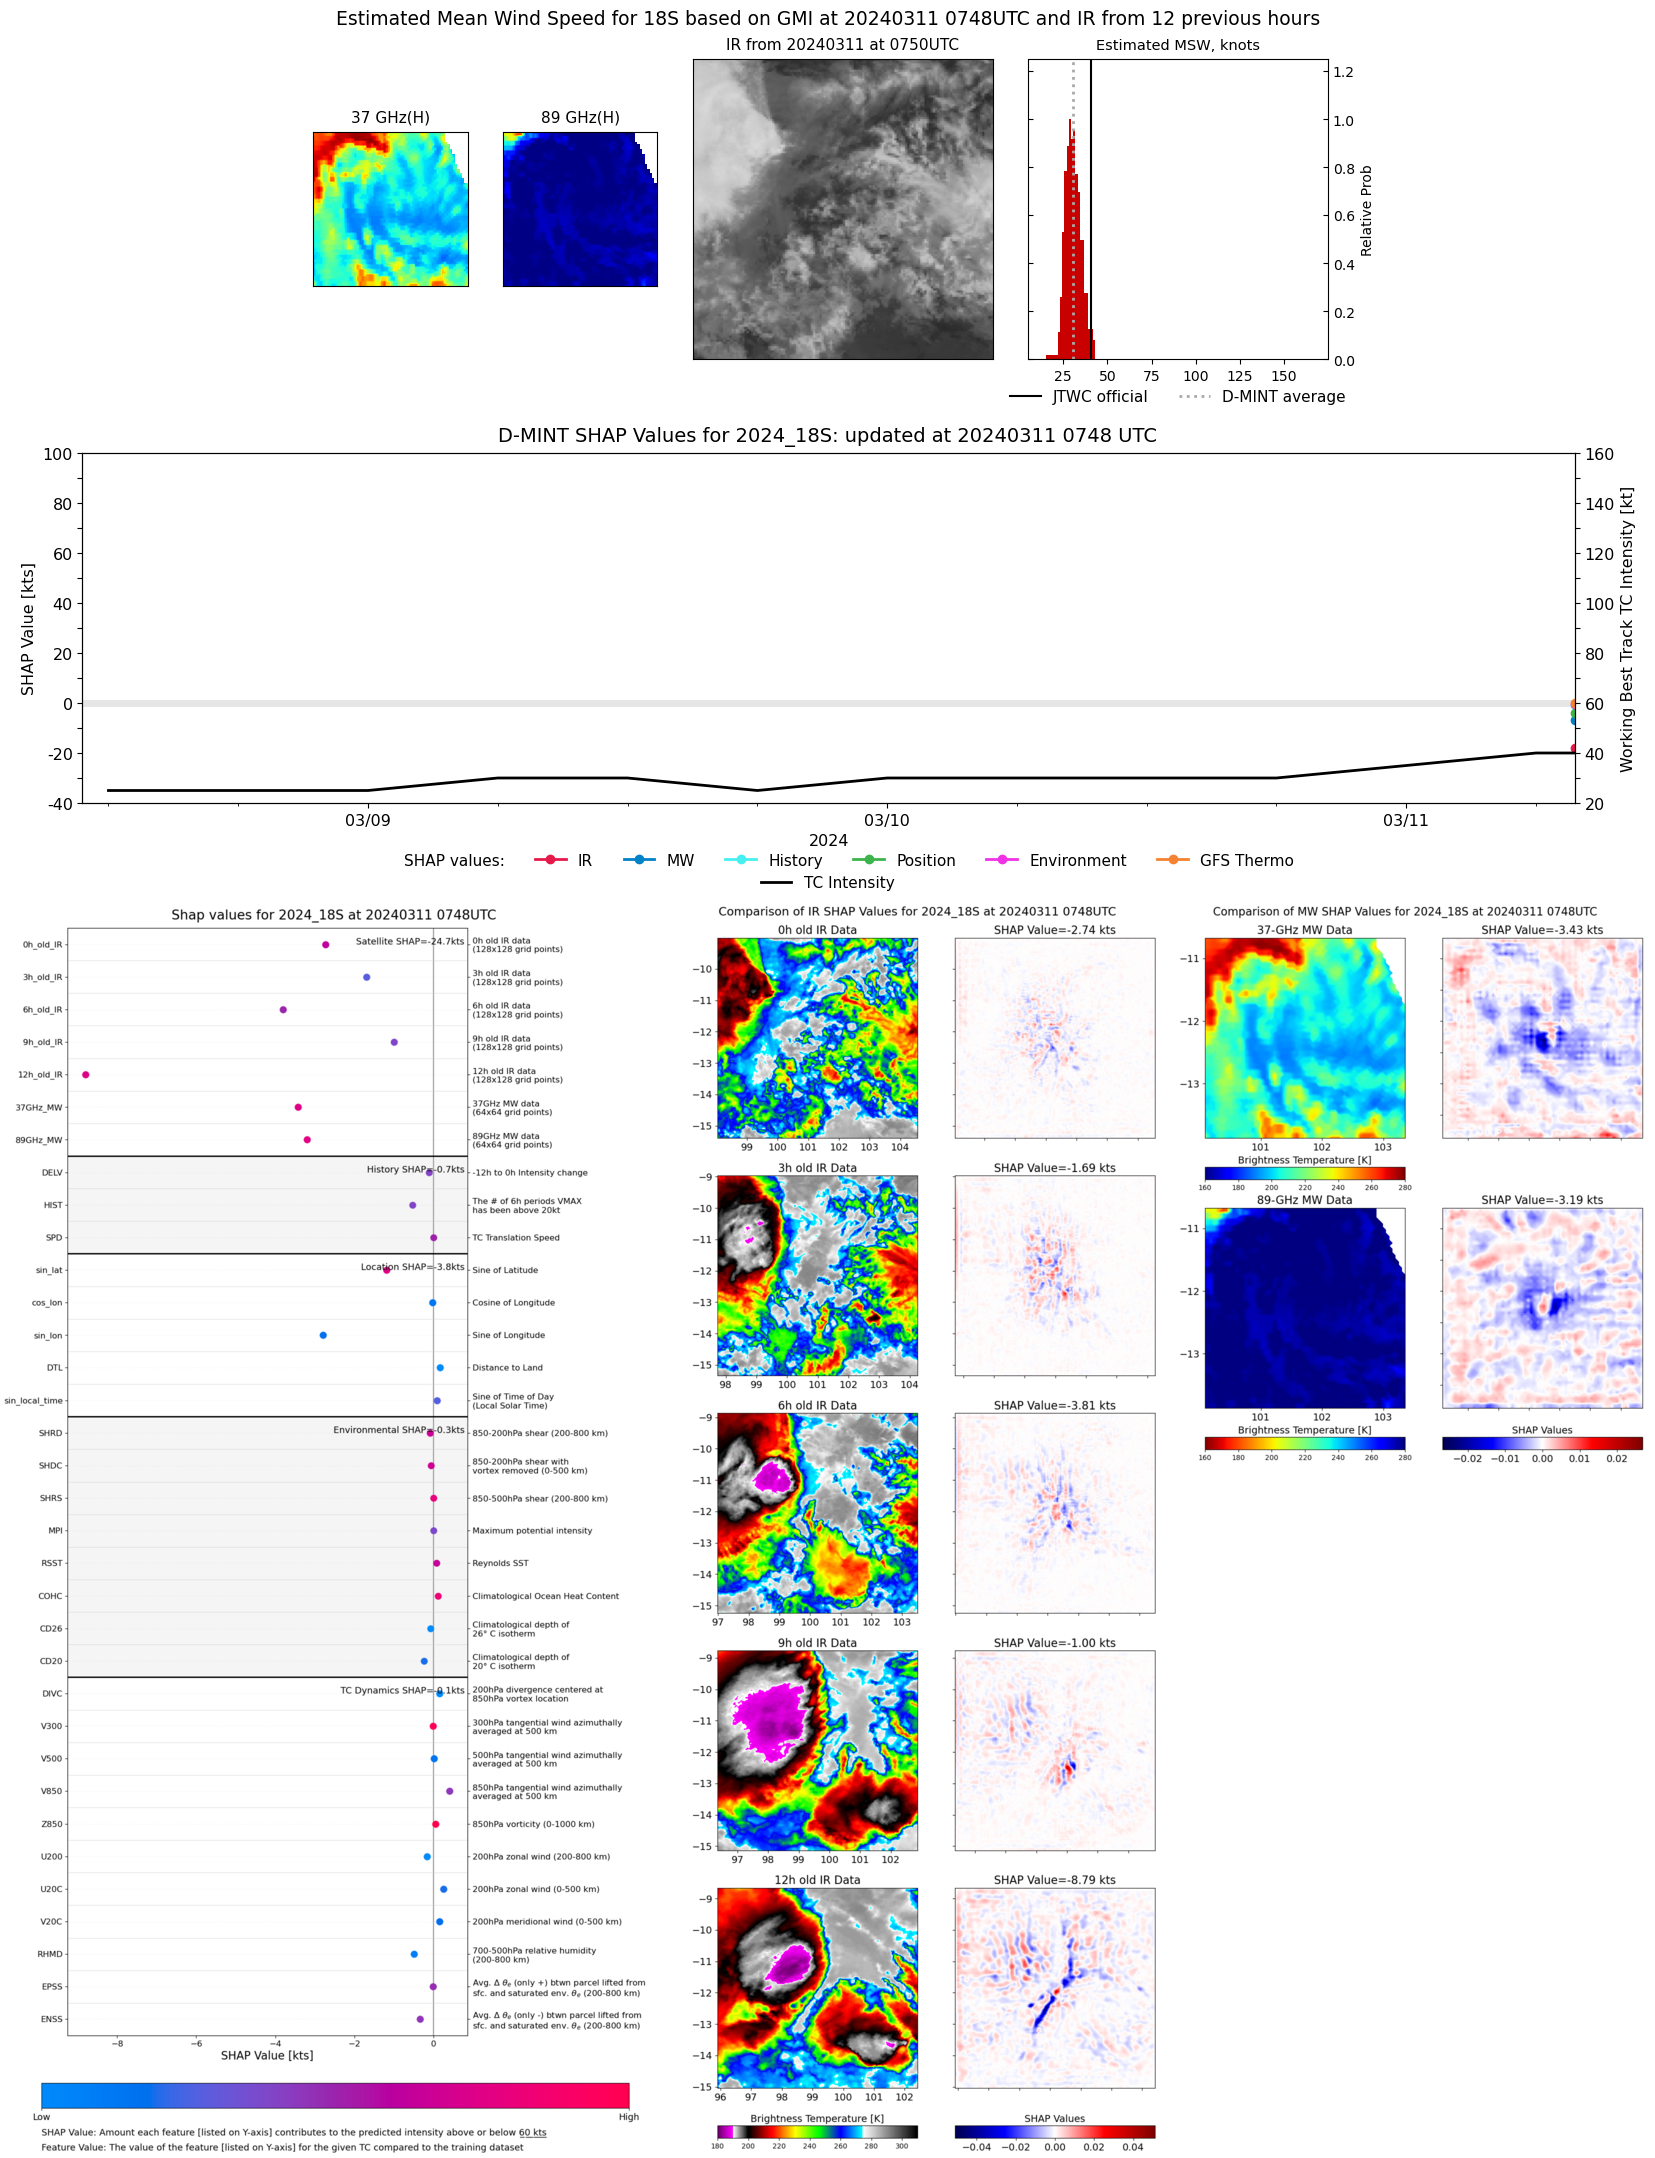 |