|
||

 |
D-MINT HISTORY FILE for 2024_21S
| Date | Time | MW Sensor | MSLP | Vmax (30th-70th percentile average) | Vmax 25th percentile | Vmax 75th percentile | Image |
| 20240411 | 0848 UTC | GMI | 1001 hPa | 29 kts | 26 kts | 33 kts | 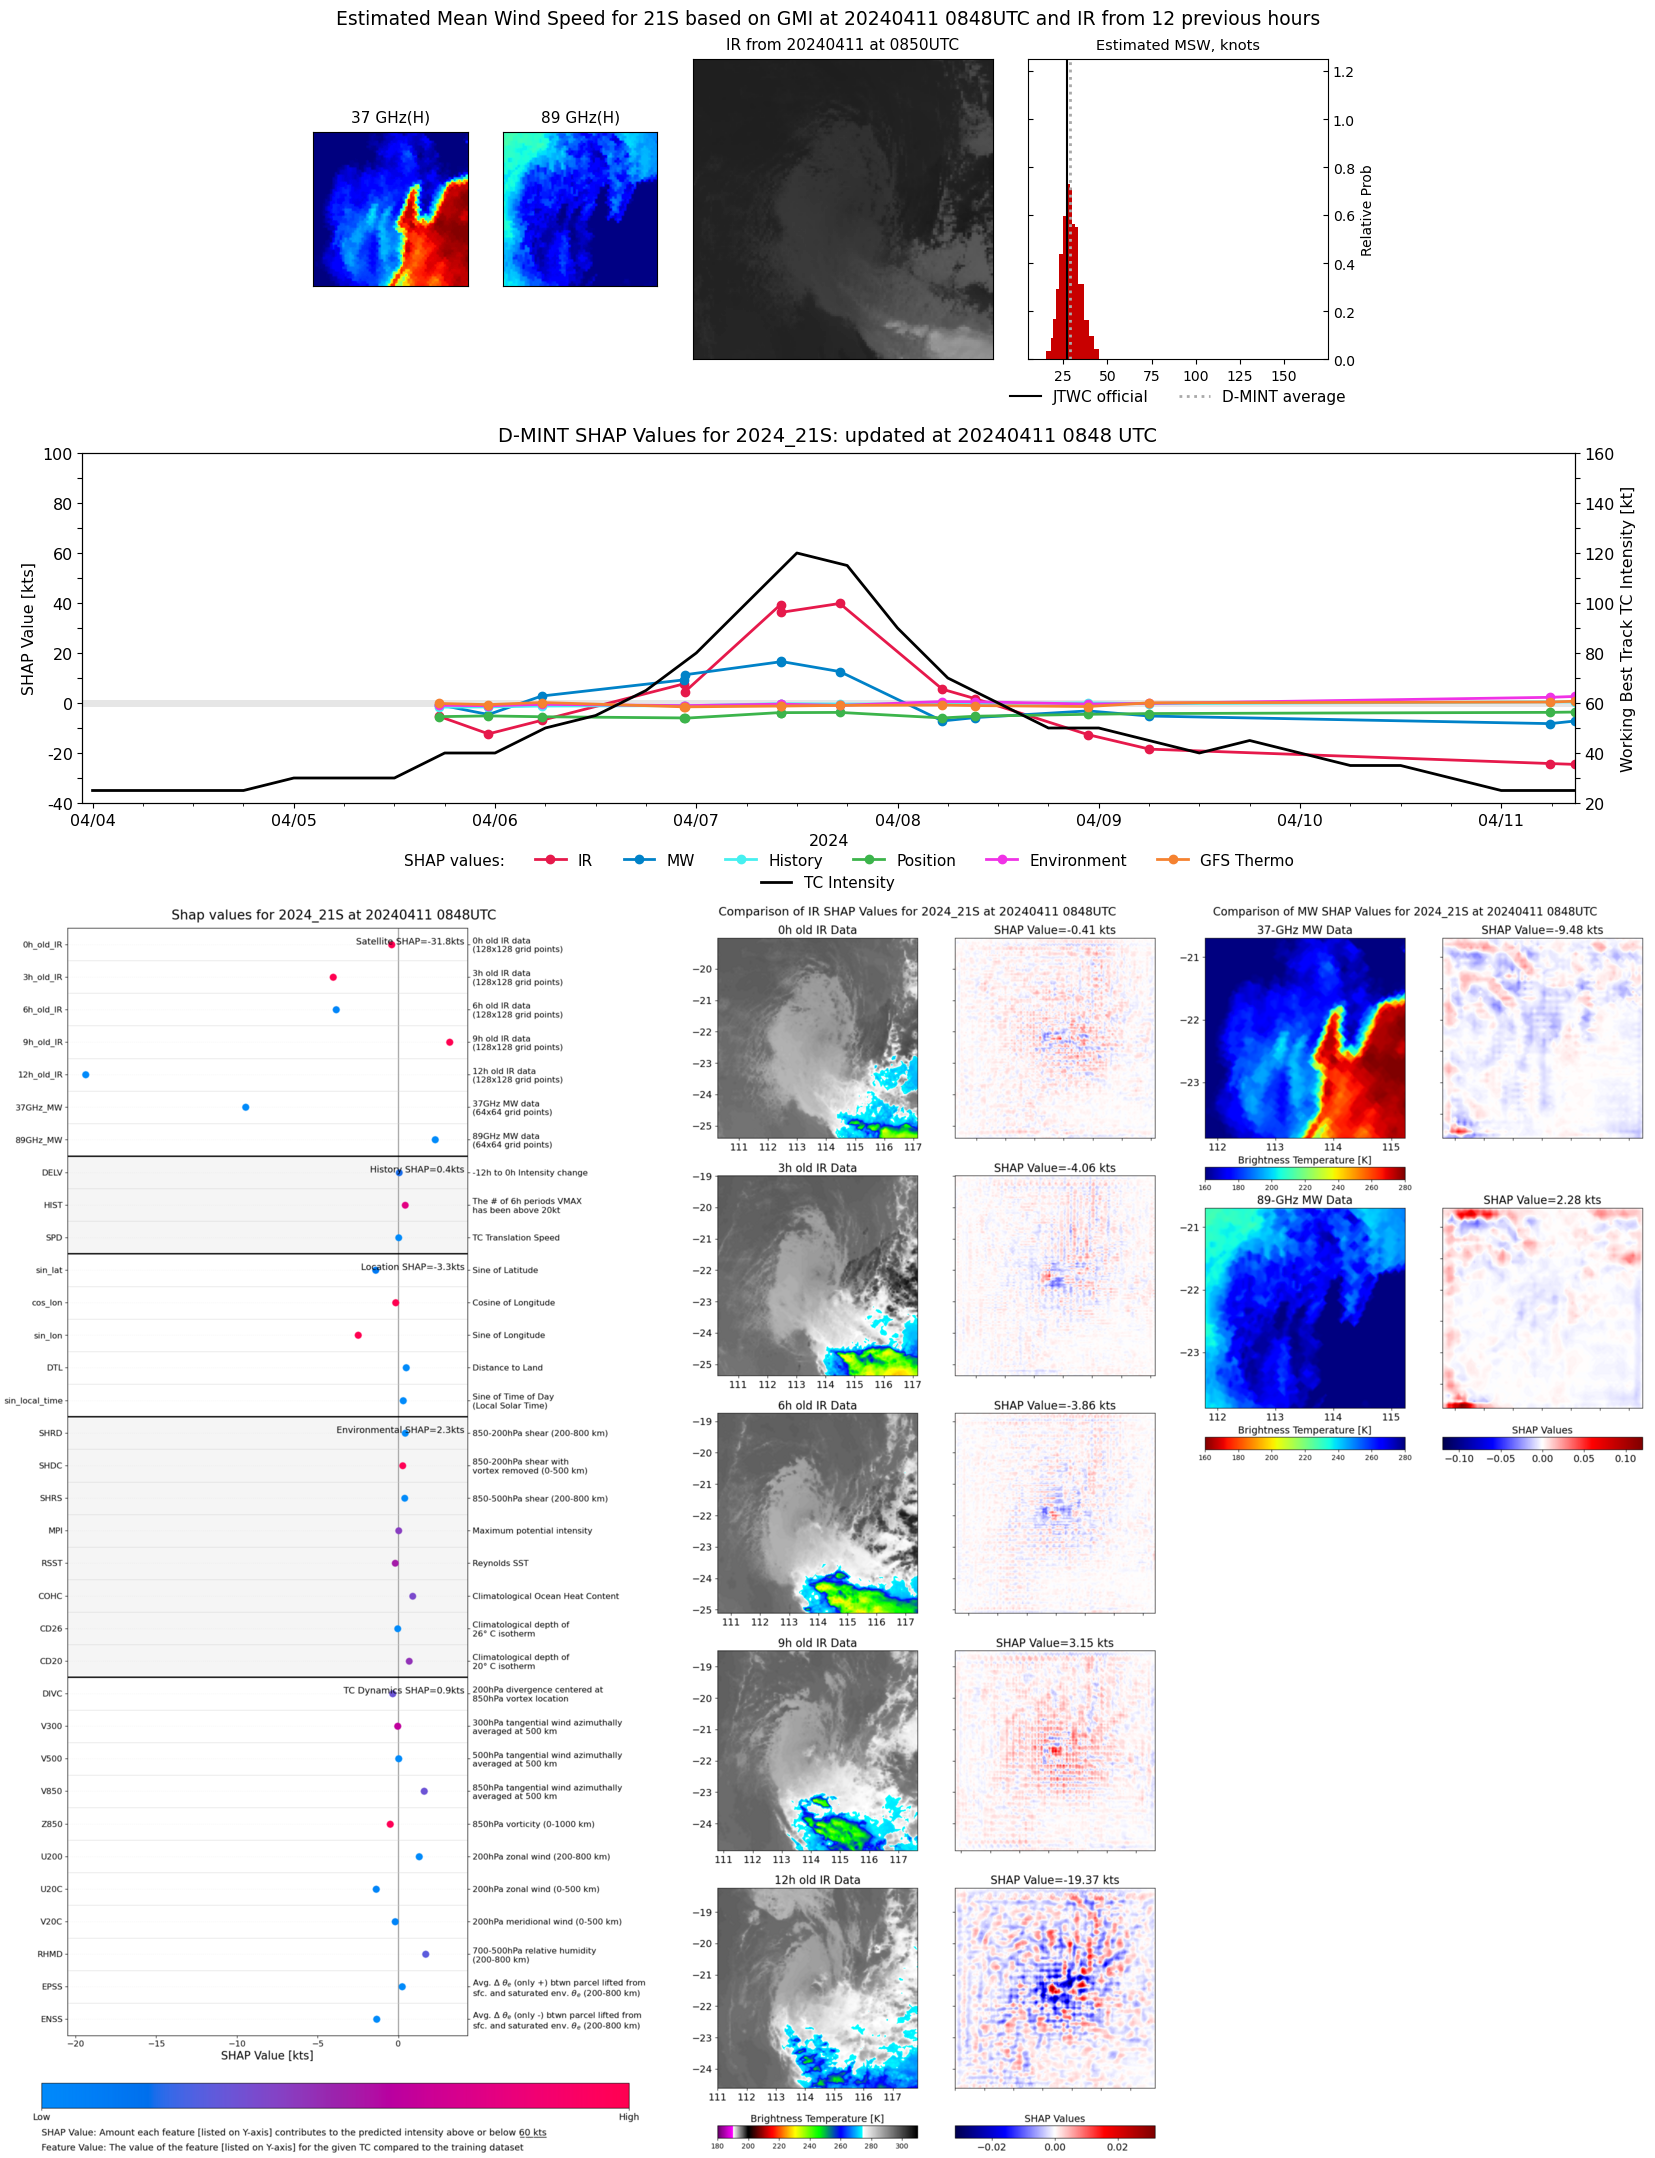 |
| 20240411 | 0550 UTC | AMSR2 | 1000 hPa | 27 kts | 24 kts | 31 kts |  |
| 20240410 | 2252 UTC | SSMISF17 | 1001 hPa | 29 kts | 25 kts | 33 kts | 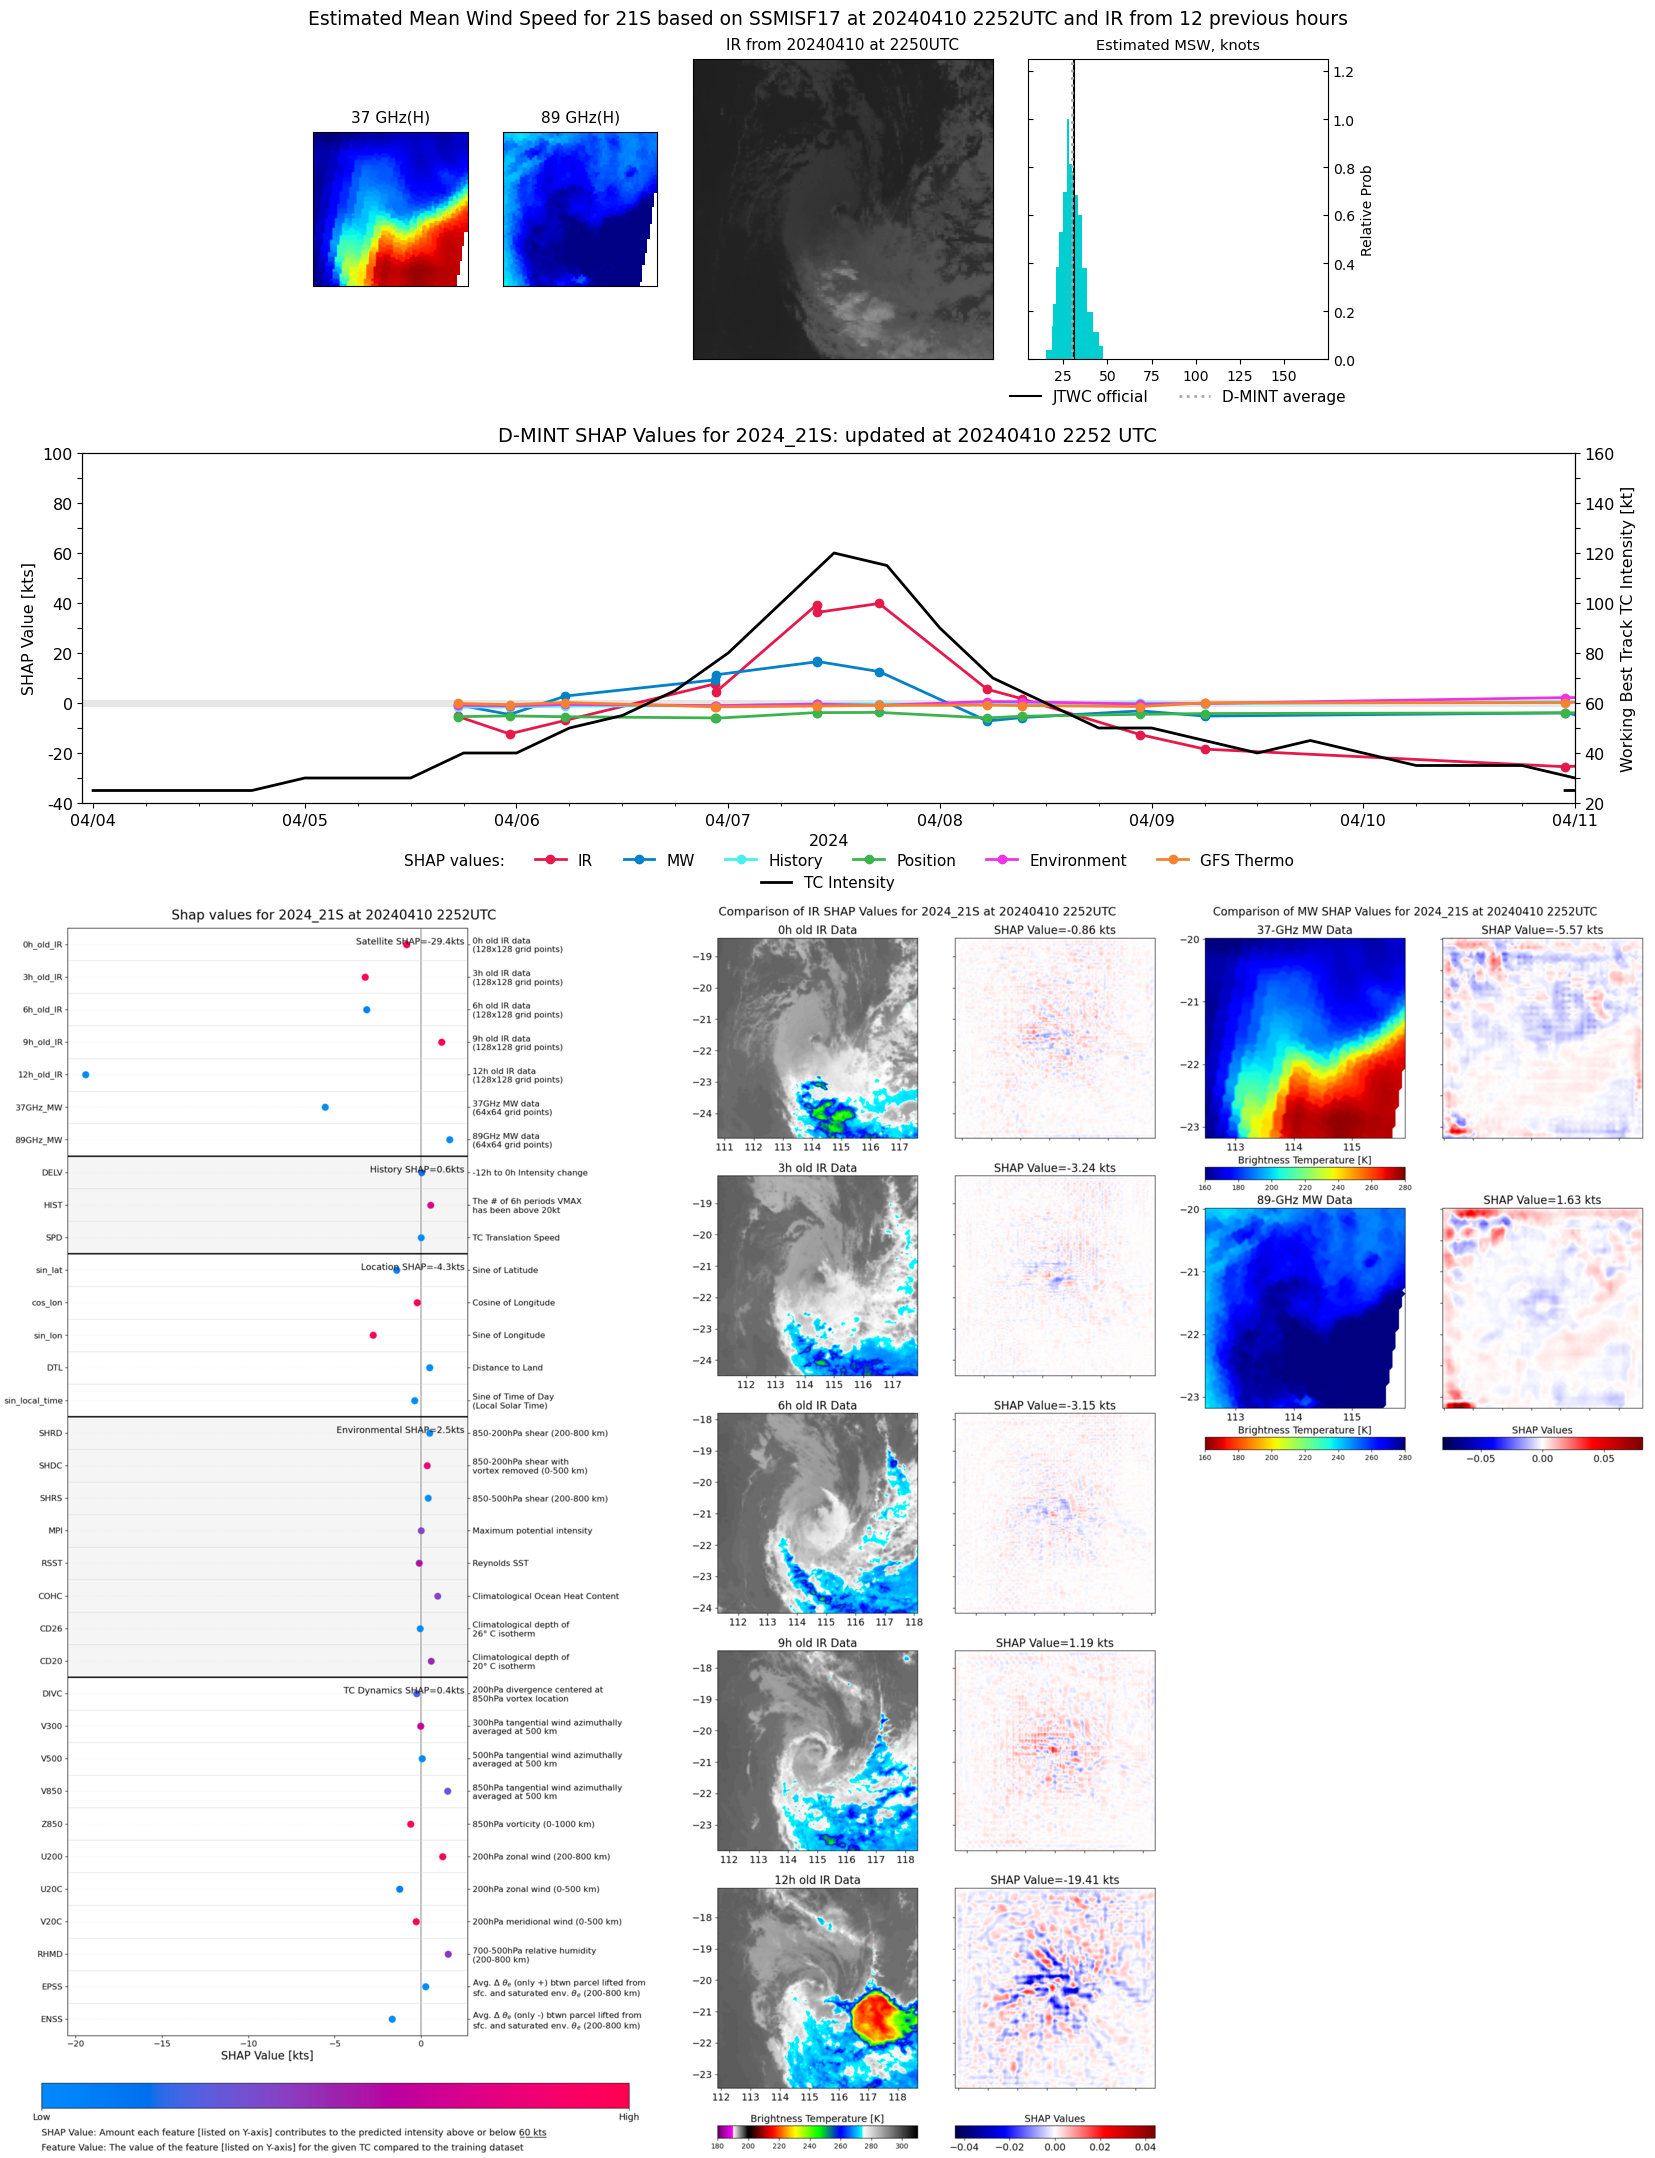 |
| 20240410 | 1739 UTC | AMSR2 | 1000 hPa | 28 kts | 24 kts | 33 kts |  |
| 20240409 | 1010 UTC | SSMISF16 | 997 hPa | 33 kts | 29 kts | 37 kts | 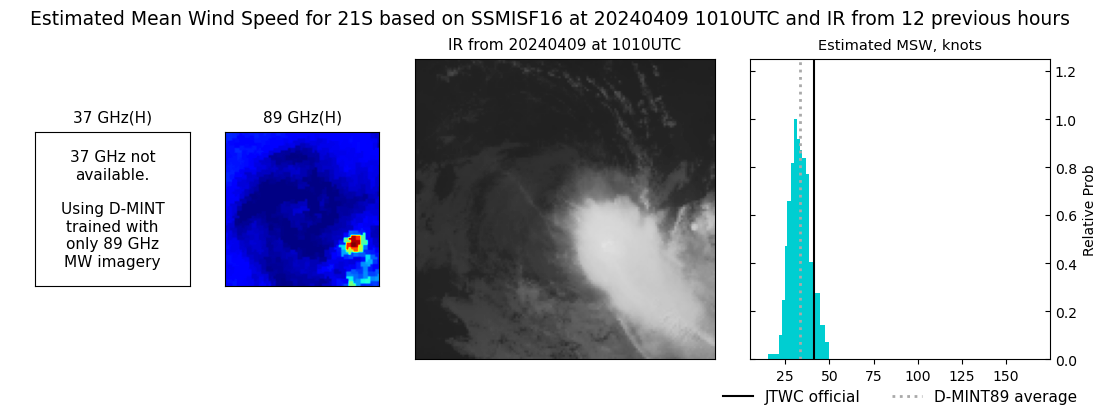 |
| 20240409 | 0603 UTC | AMSR2 | 996 hPa | 32 kts | 28 kts | 35 kts | 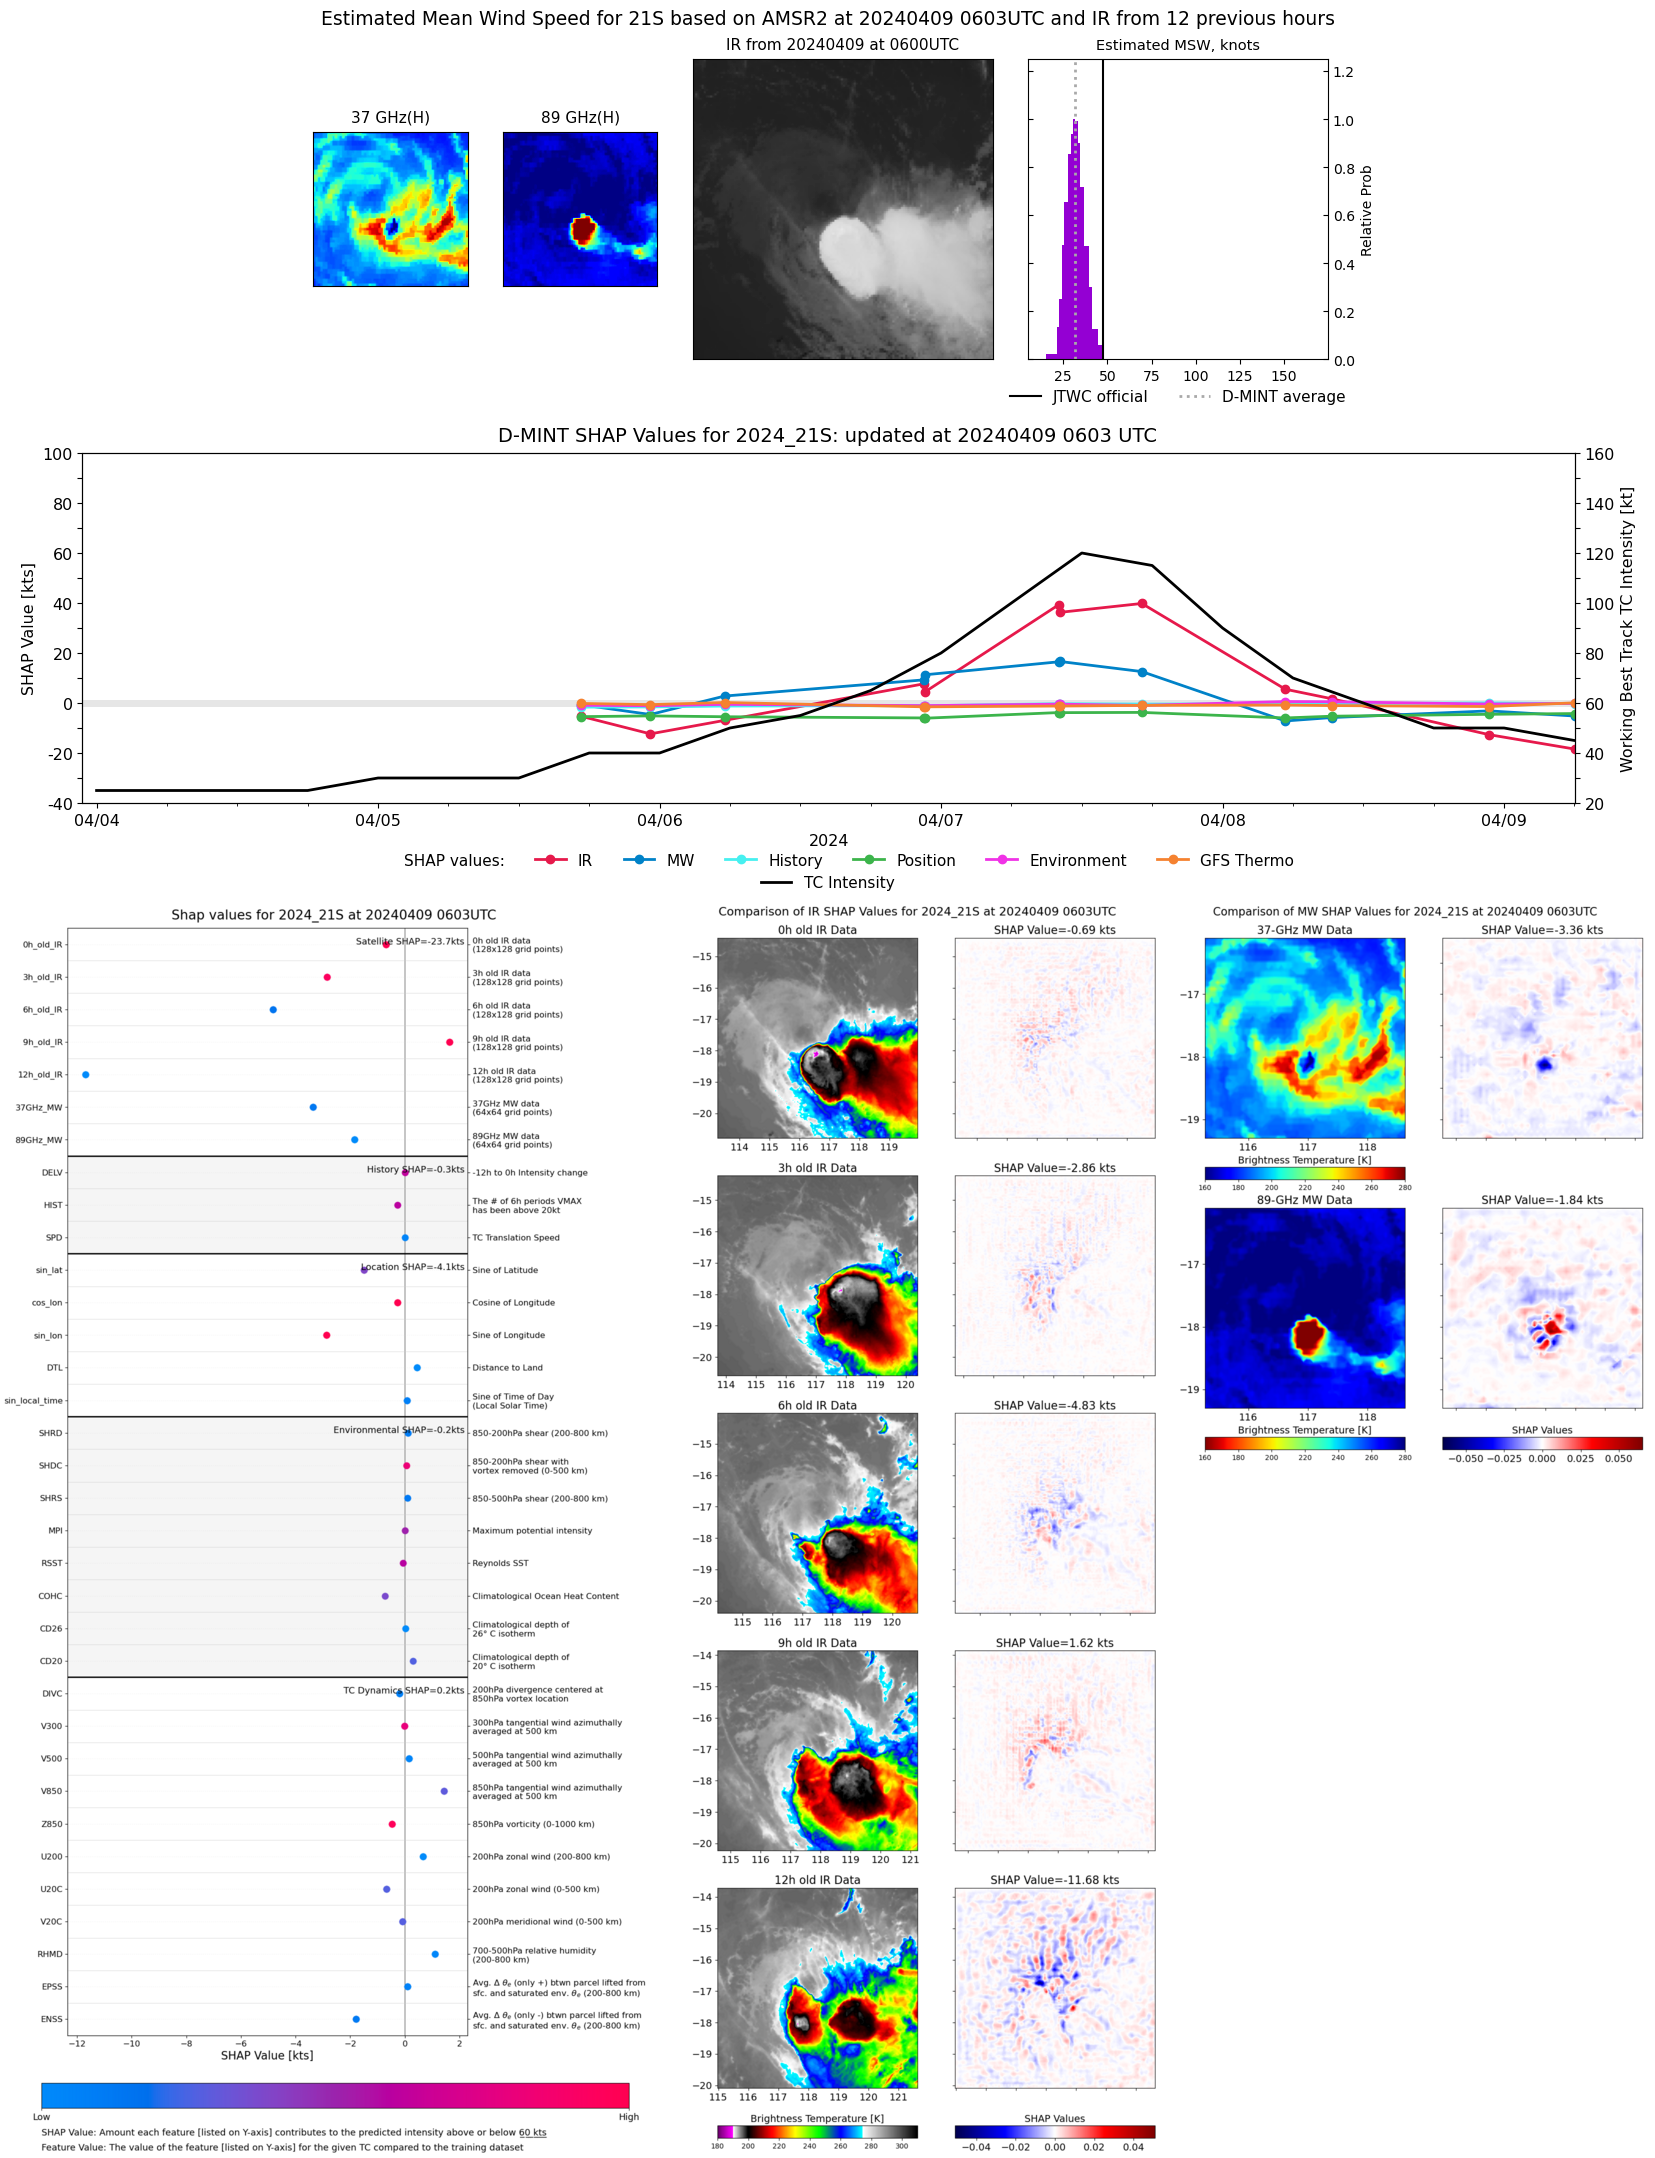 |
| 20240408 | 2243 UTC | GMI | 993 hPa | 38 kts | 33 kts | 43 kts | 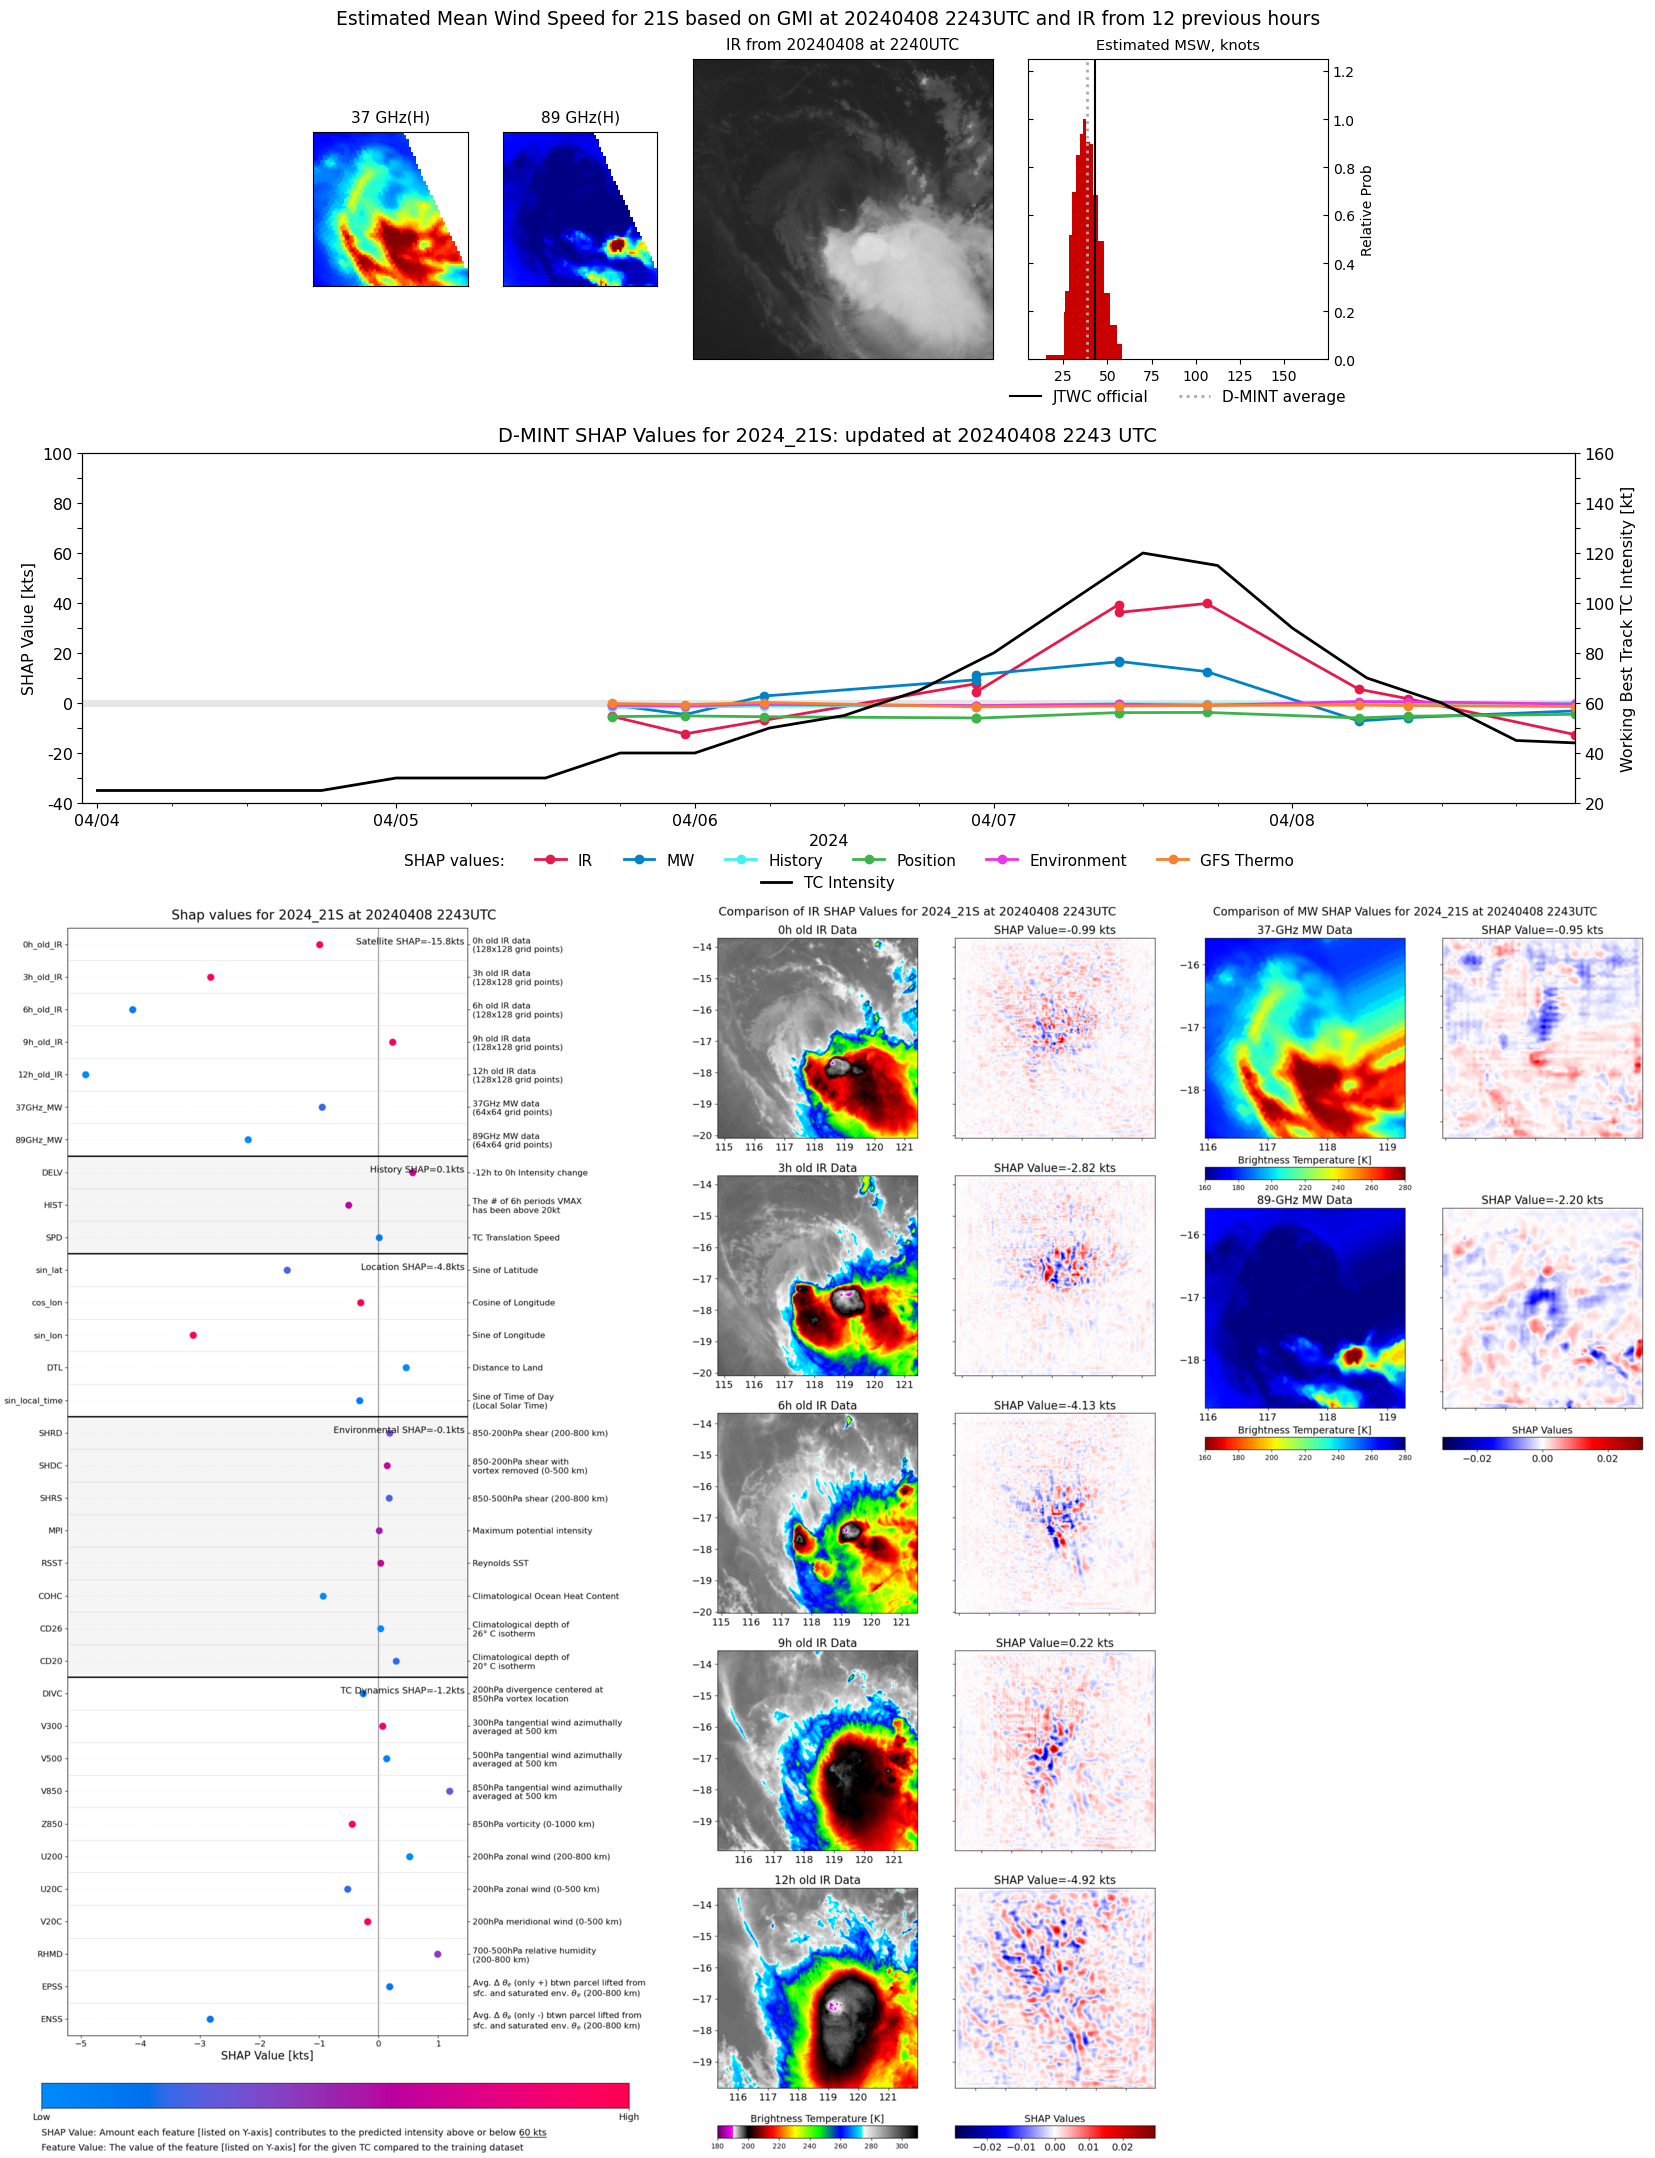 |
| 20240408 | 0918 UTC | GMI | 985 hPa | 50 kts | 44 kts | 56 kts | 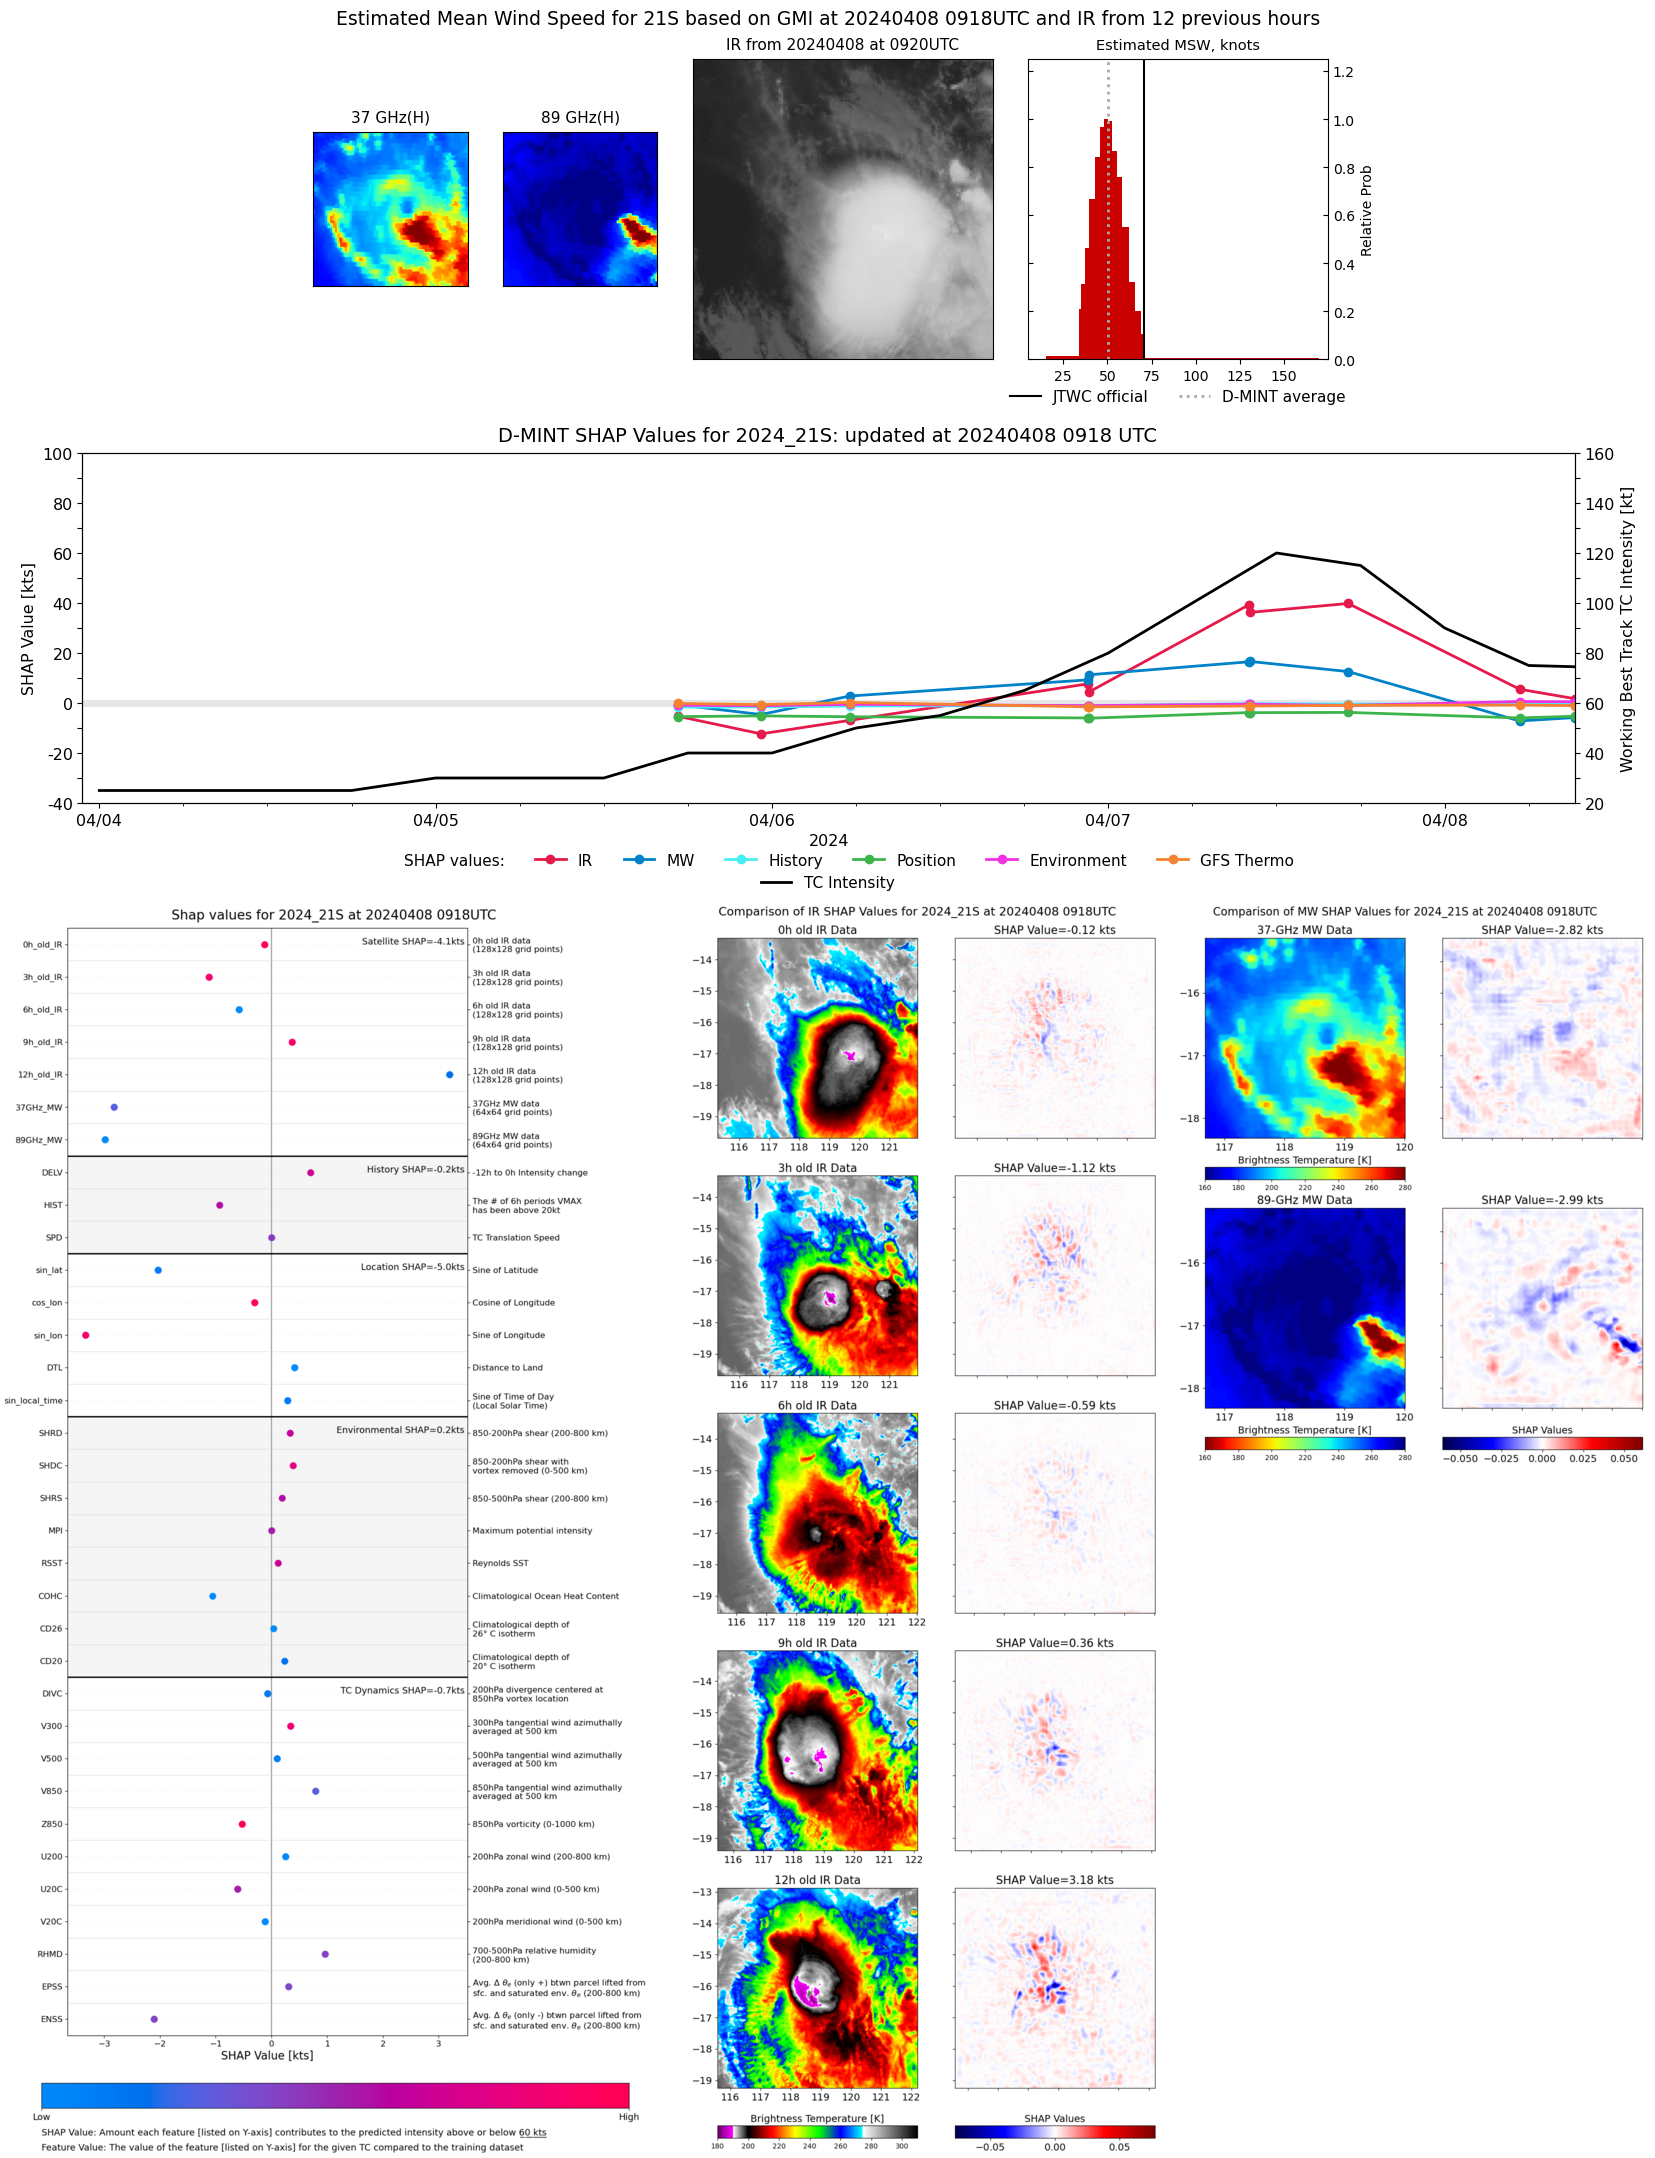 |
| 20240408 | 0521 UTC | AMSR2 | 981 hPa | 52 kts | 45 kts | 60 kts |  |
| 20240407 | 1707 UTC | AMSR2 | 939 hPa | 106 kts | 99 kts | 113 kts |  |
| 20240407 | 1007 UTC | GMI | 942 hPa | 107 kts | 99 kts | 114 kts | 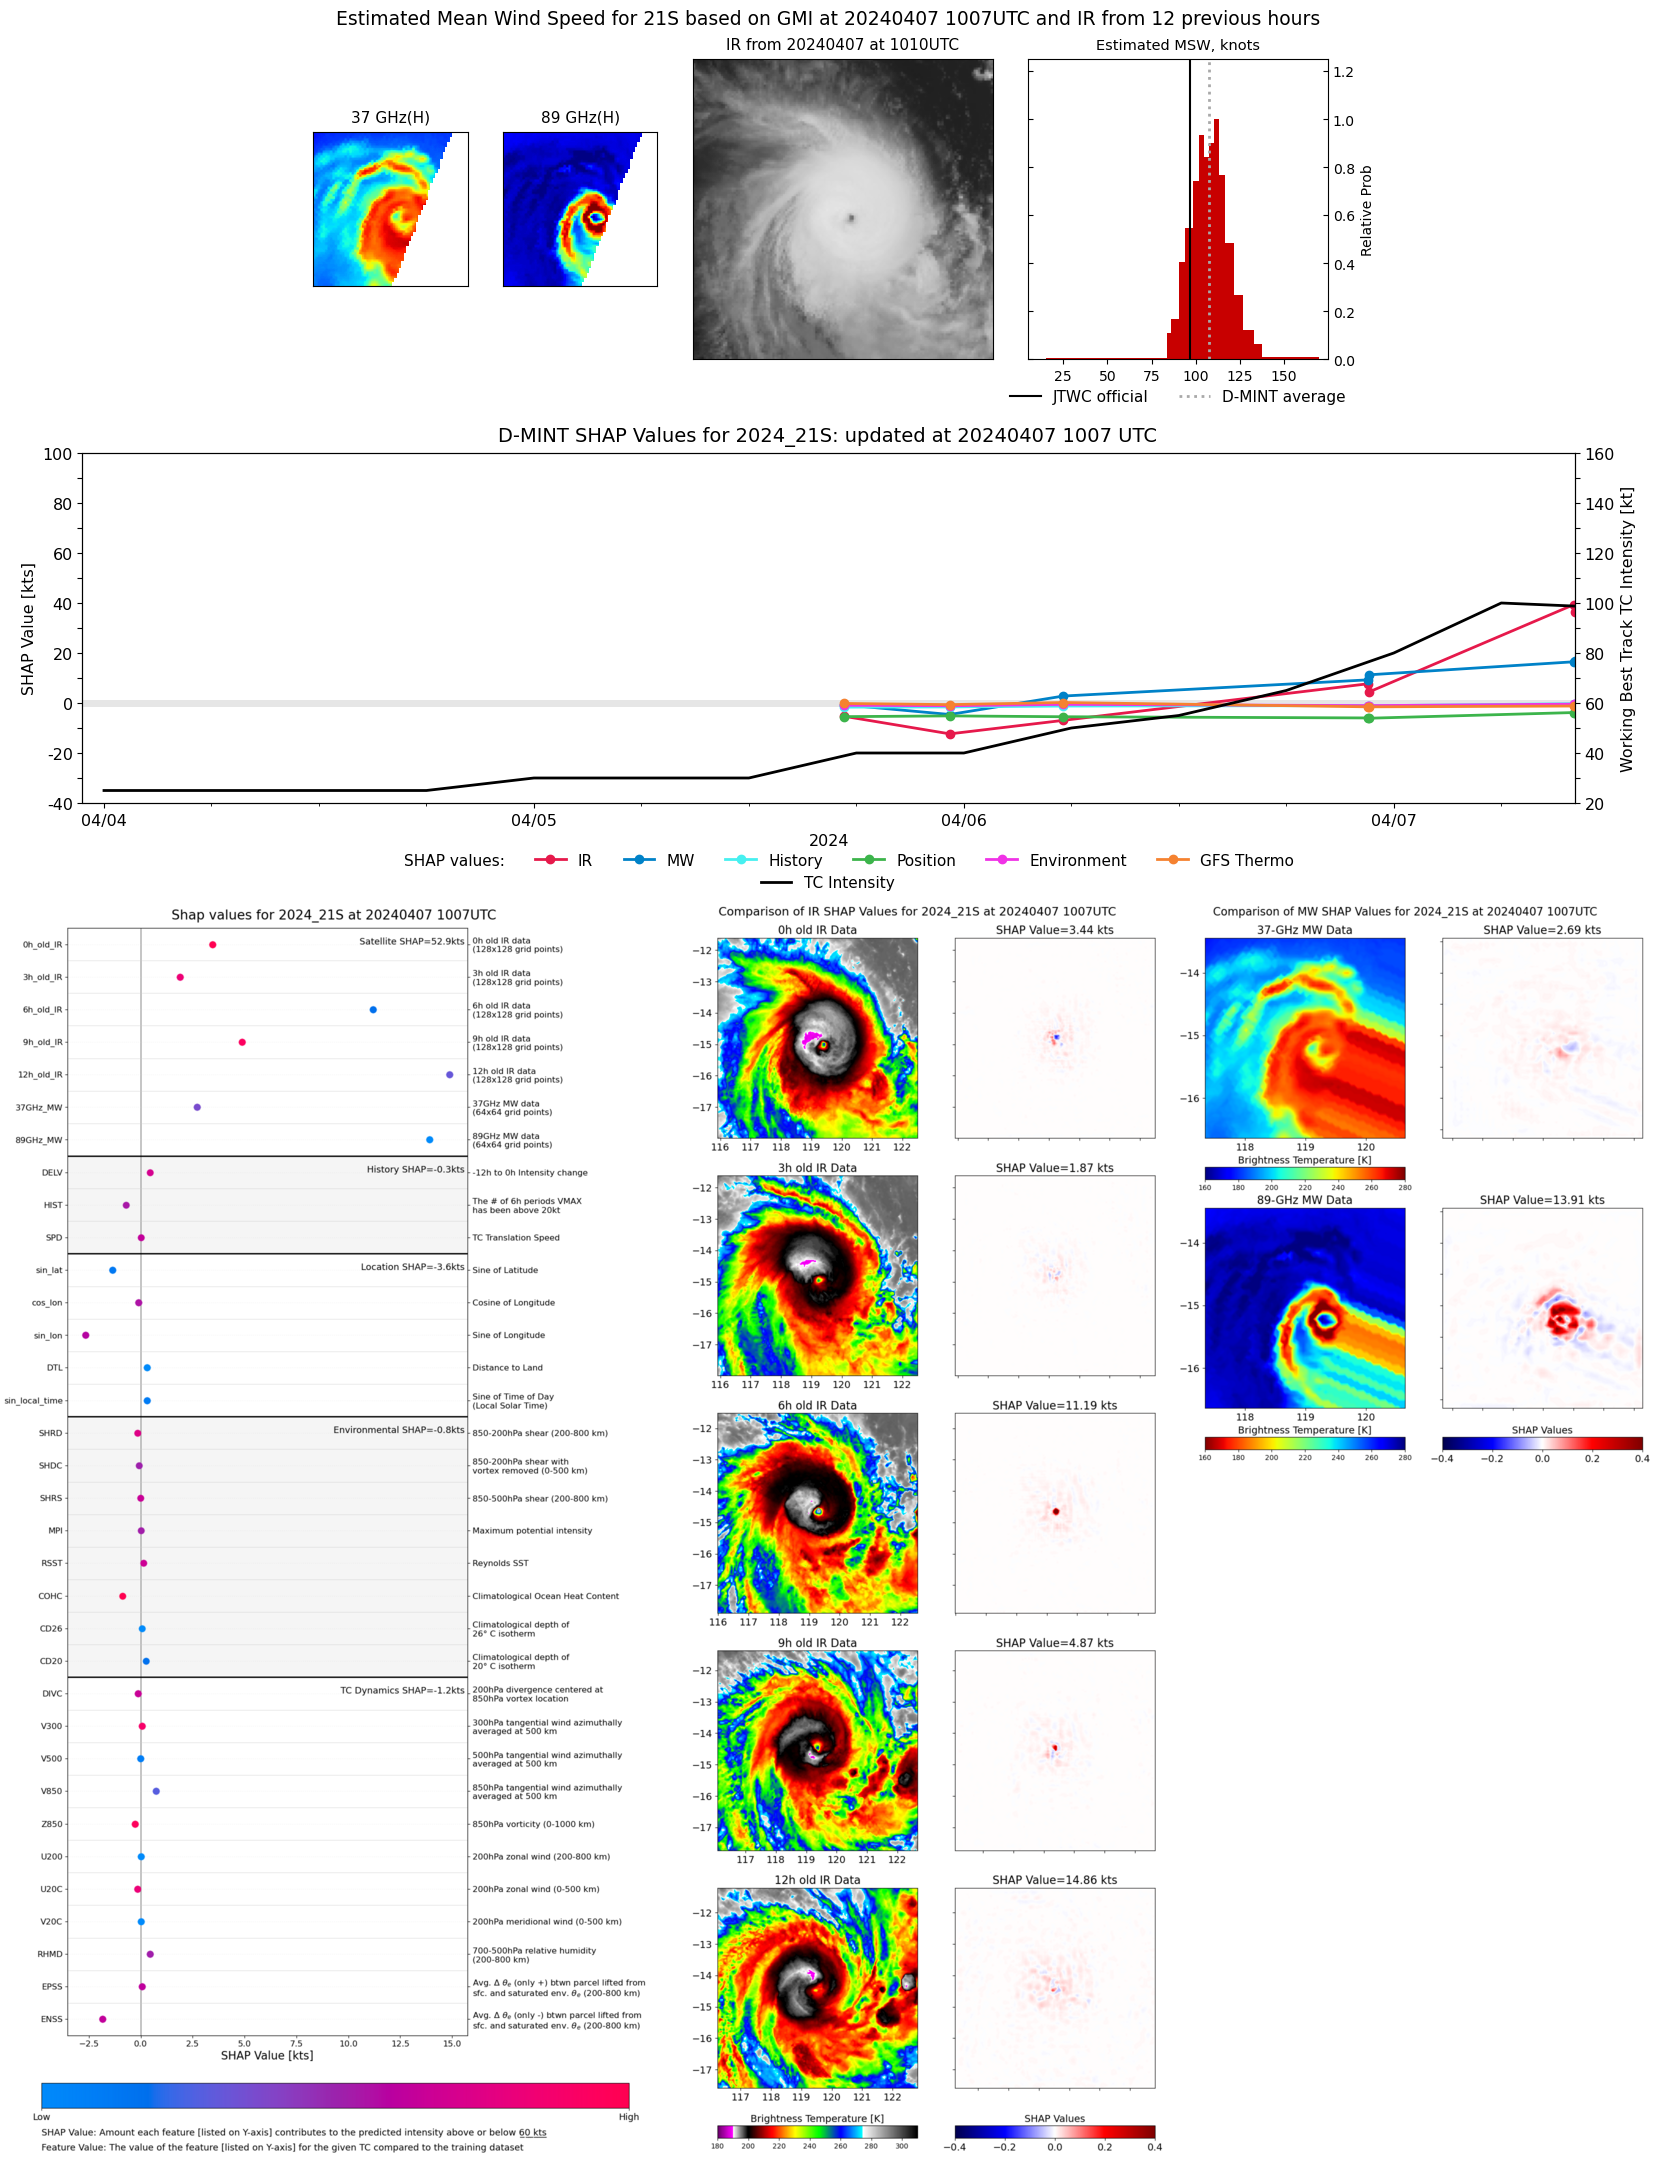 |
| 20240407 | 1003 UTC | GMI | 943 hPa | 110 kts | 102 kts | 117 kts | 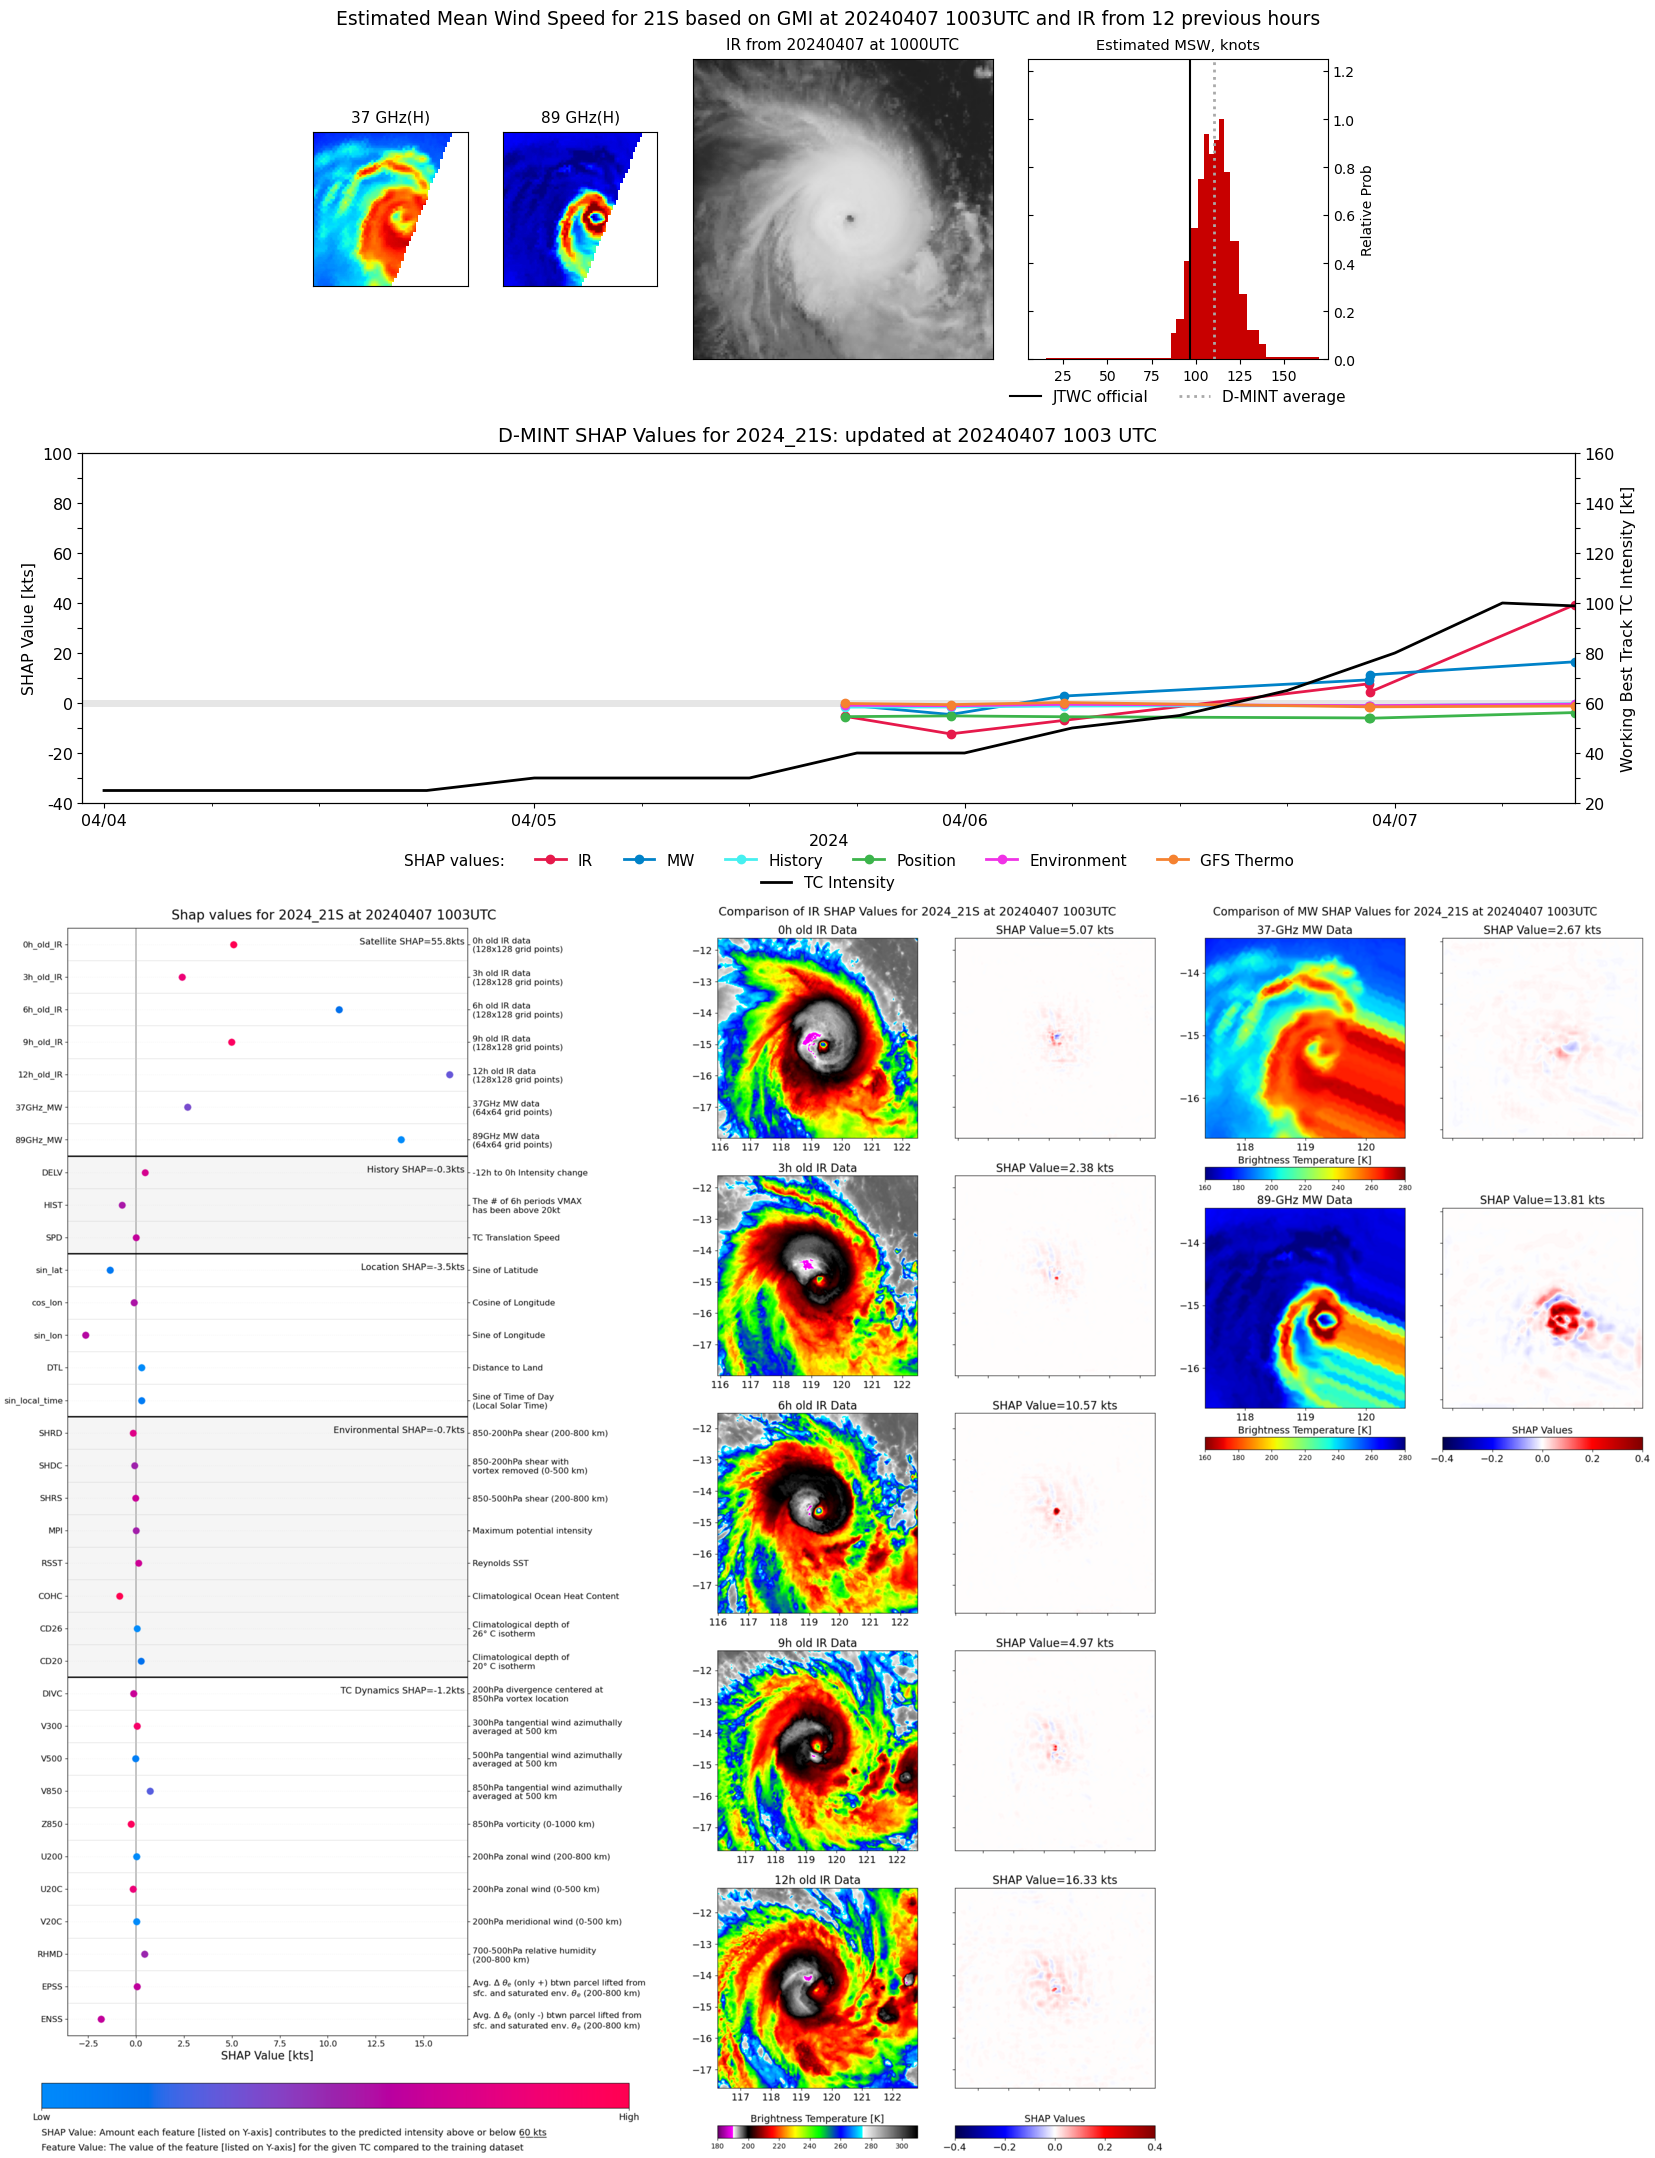 |
| 20240406 | 2236 UTC | GMI | 975 hPa | 66 kts | 60 kts | 73 kts |  |
| 20240406 | 2233 UTC | GMI | 970 hPa | 68 kts | 61 kts | 74 kts | 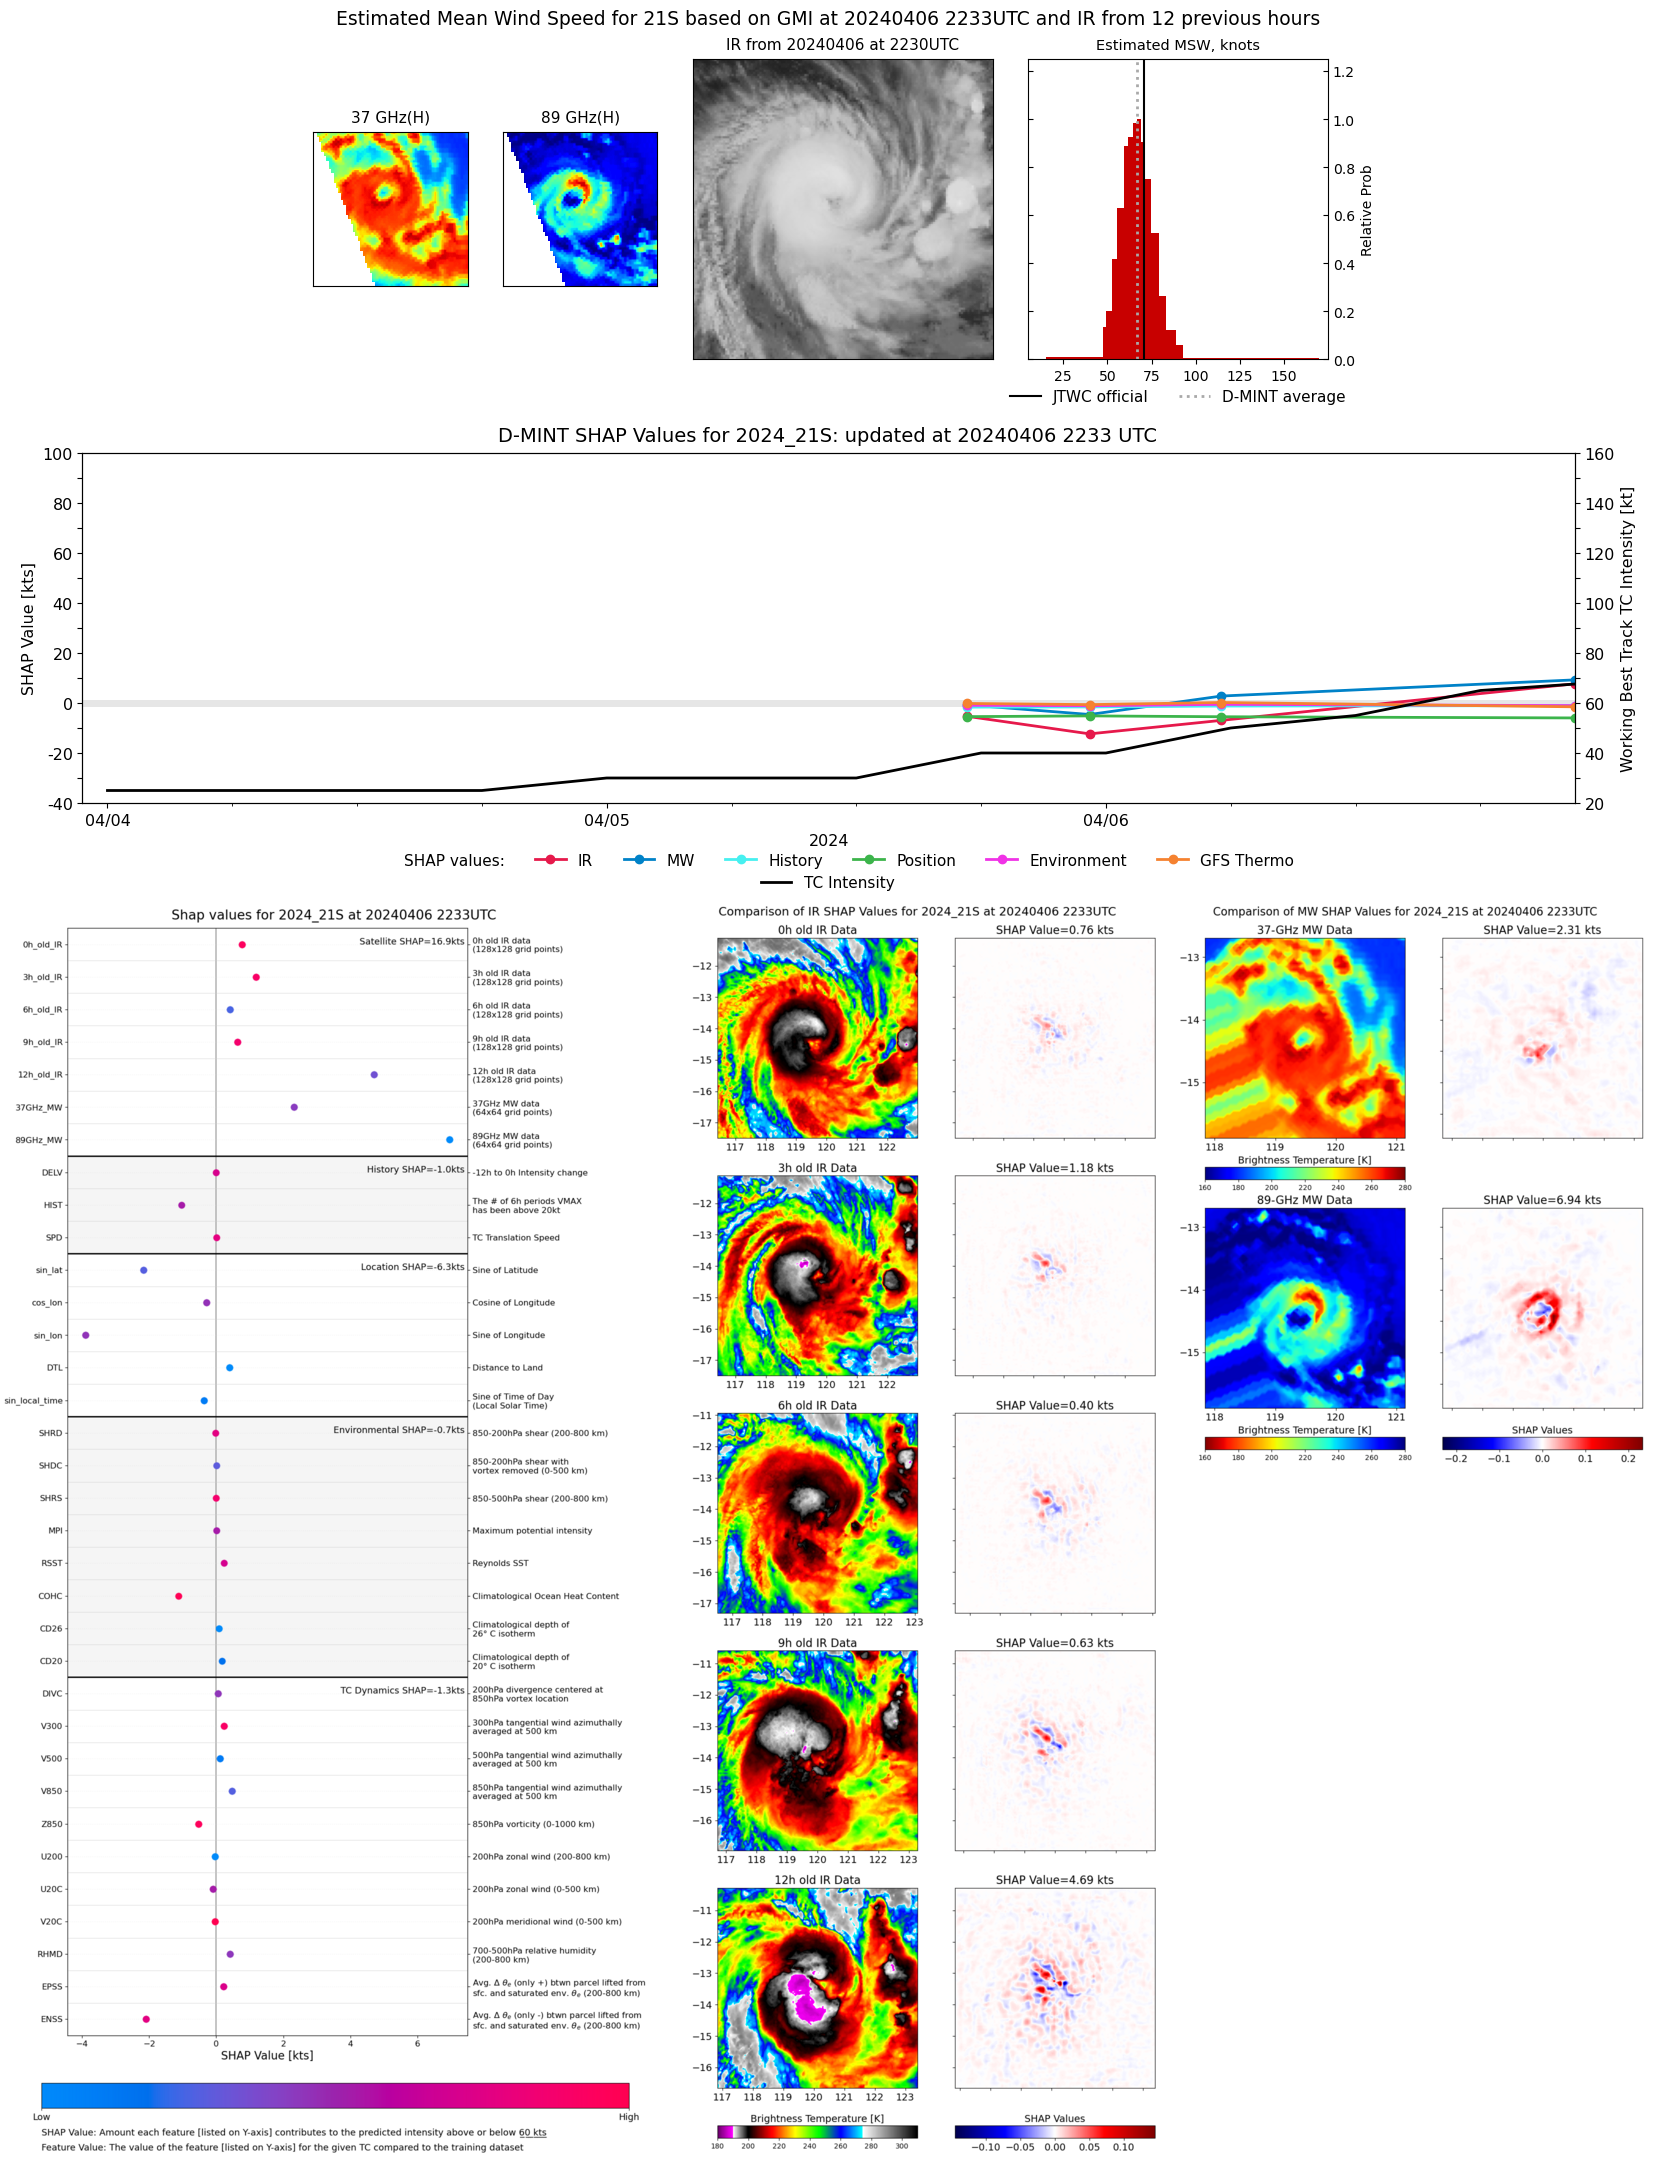 |
| 20240406 | 0533 UTC | AMSR2 | 989 hPa | 49 kts | 43 kts | 55 kts | 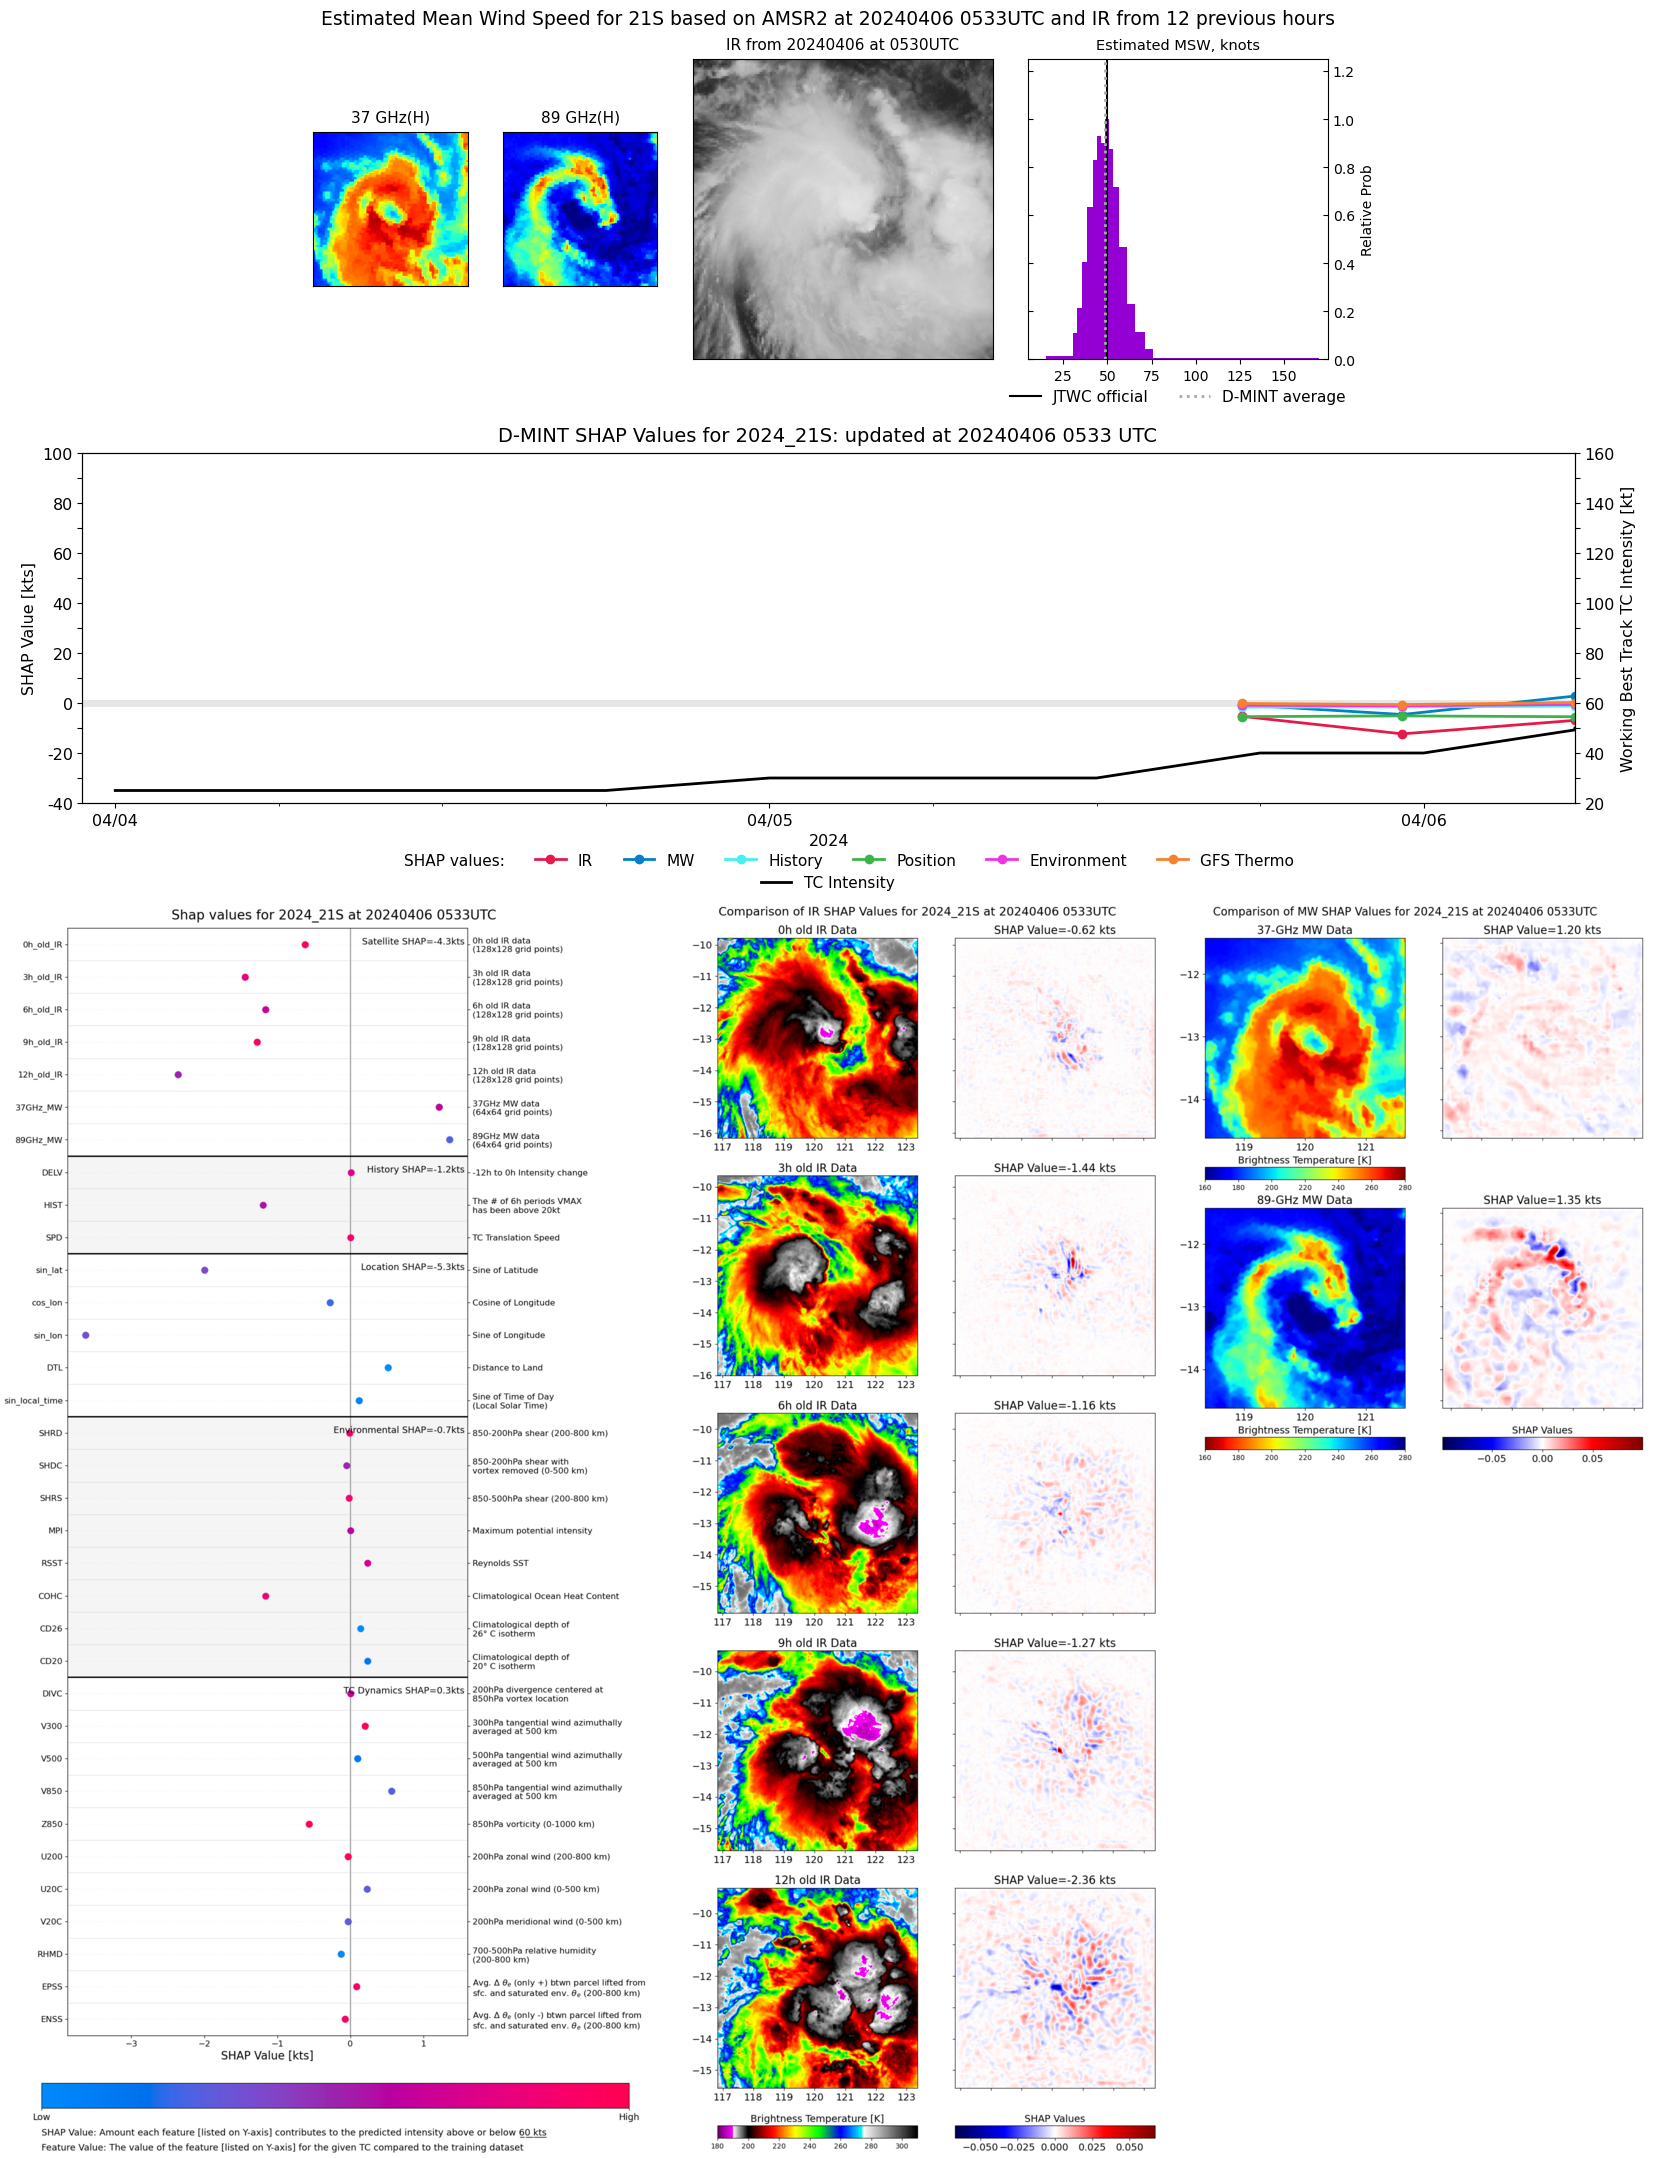 |
| 20240405 | 2313 UTC | GMI | 991 hPa | 35 kts | 30 kts | 39 kts |  |
| 20240405 | 1719 UTC | AMSR2 | 992 hPa | 46 kts | 41 kts | 52 kts | 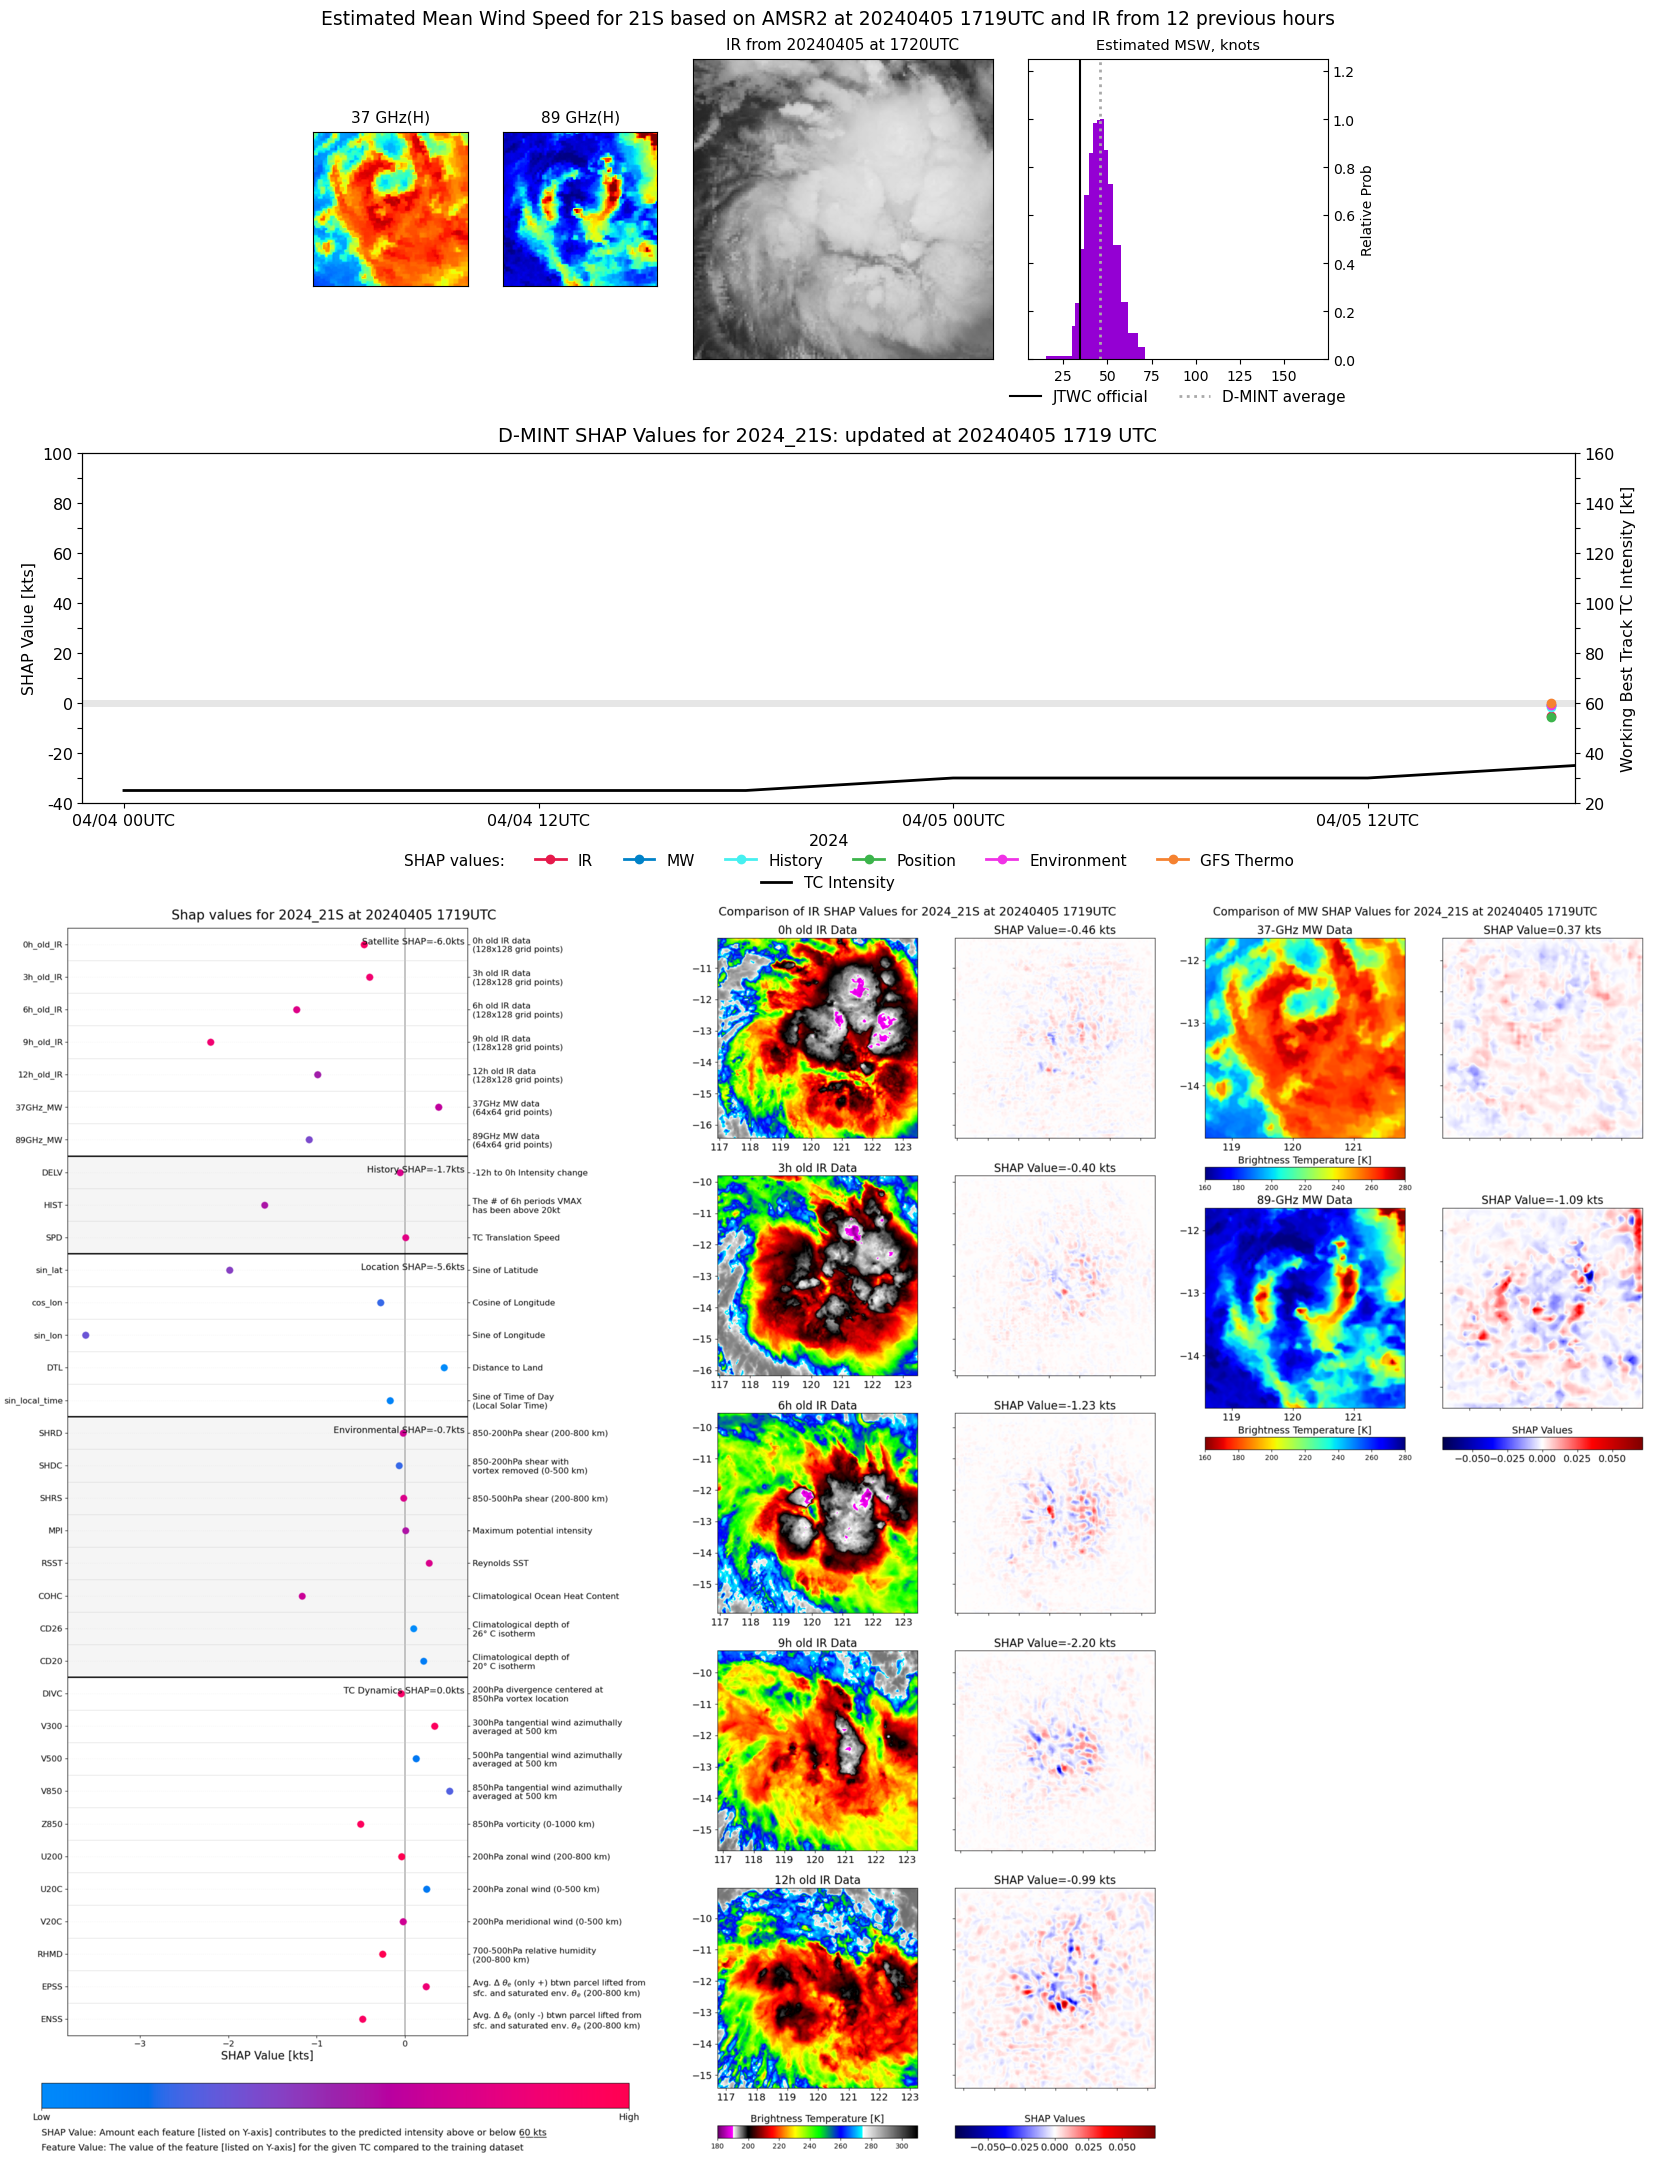 |