|
||

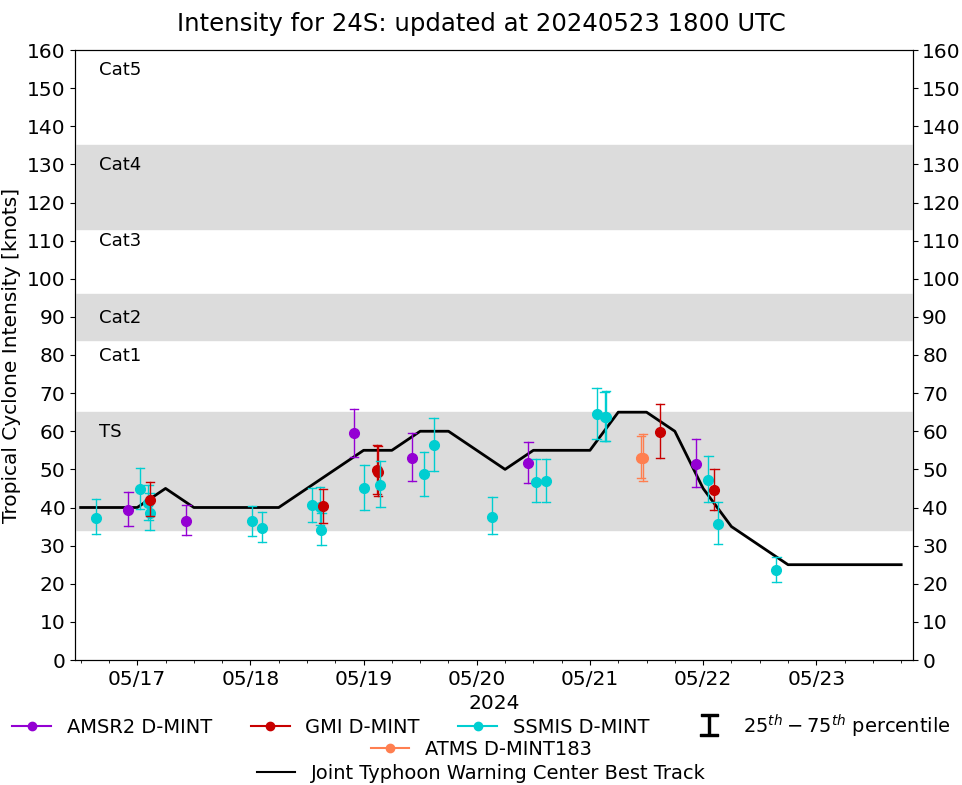 |
D-MINT HISTORY FILE for 2024_24S
| Date | Time | MW Sensor | MSLP | Vmax (30th-70th percentile average) | Vmax 25th percentile | Vmax 75th percentile | Image |
| 20240522 | 1532 UTC | SSMISF17 | 1008 hPa | 24 kts | 21 kts | 27 kts | 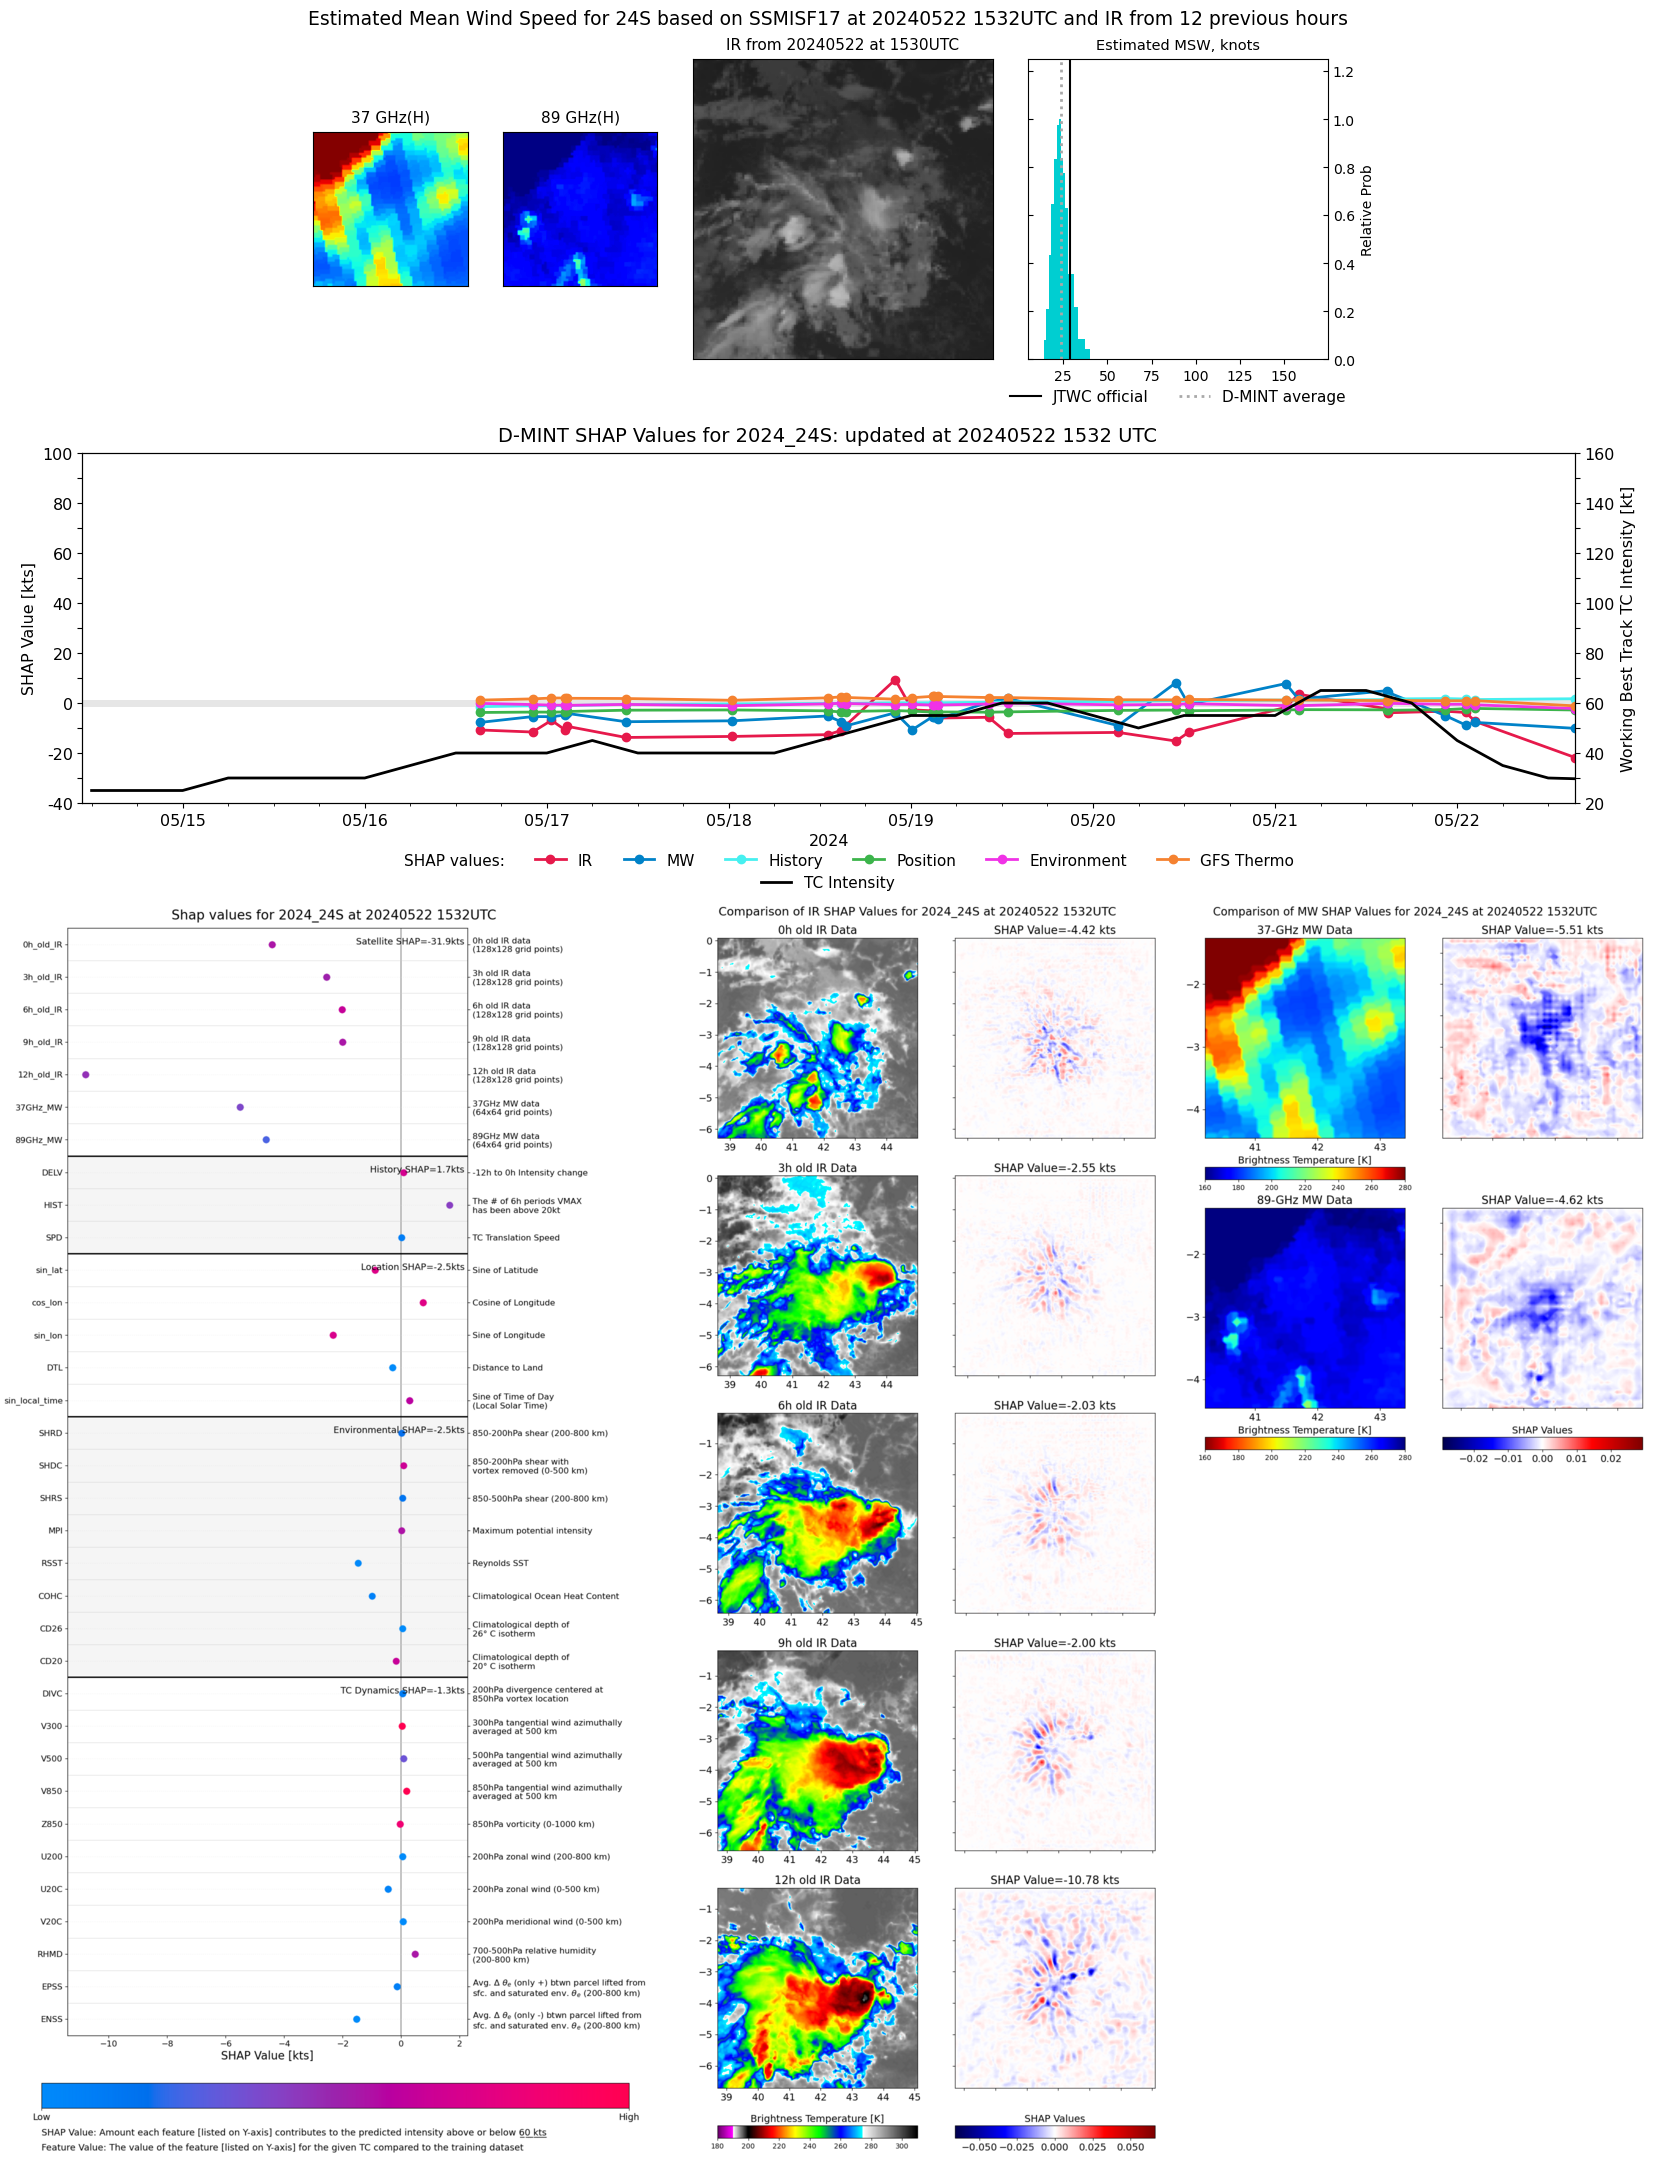 |
| 20240522 | 0310 UTC | SSMISF16 | 999 hPa | 36 kts | 30 kts | 41 kts | 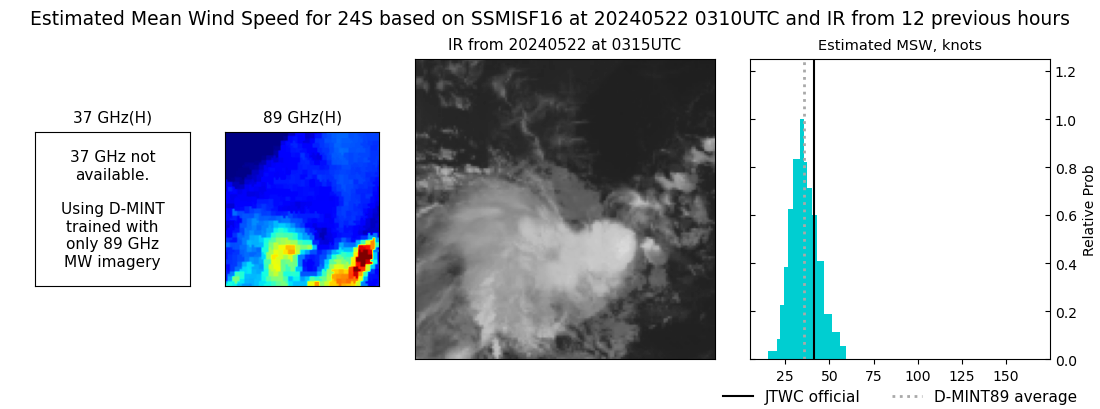 |
| 20240522 | 0223 UTC | GMI | 991 hPa | 45 kts | 39 kts | 50 kts |  |
| 20240522 | 0108 UTC | SSMISF18 | 992 hPa | 47 kts | 42 kts | 53 kts | 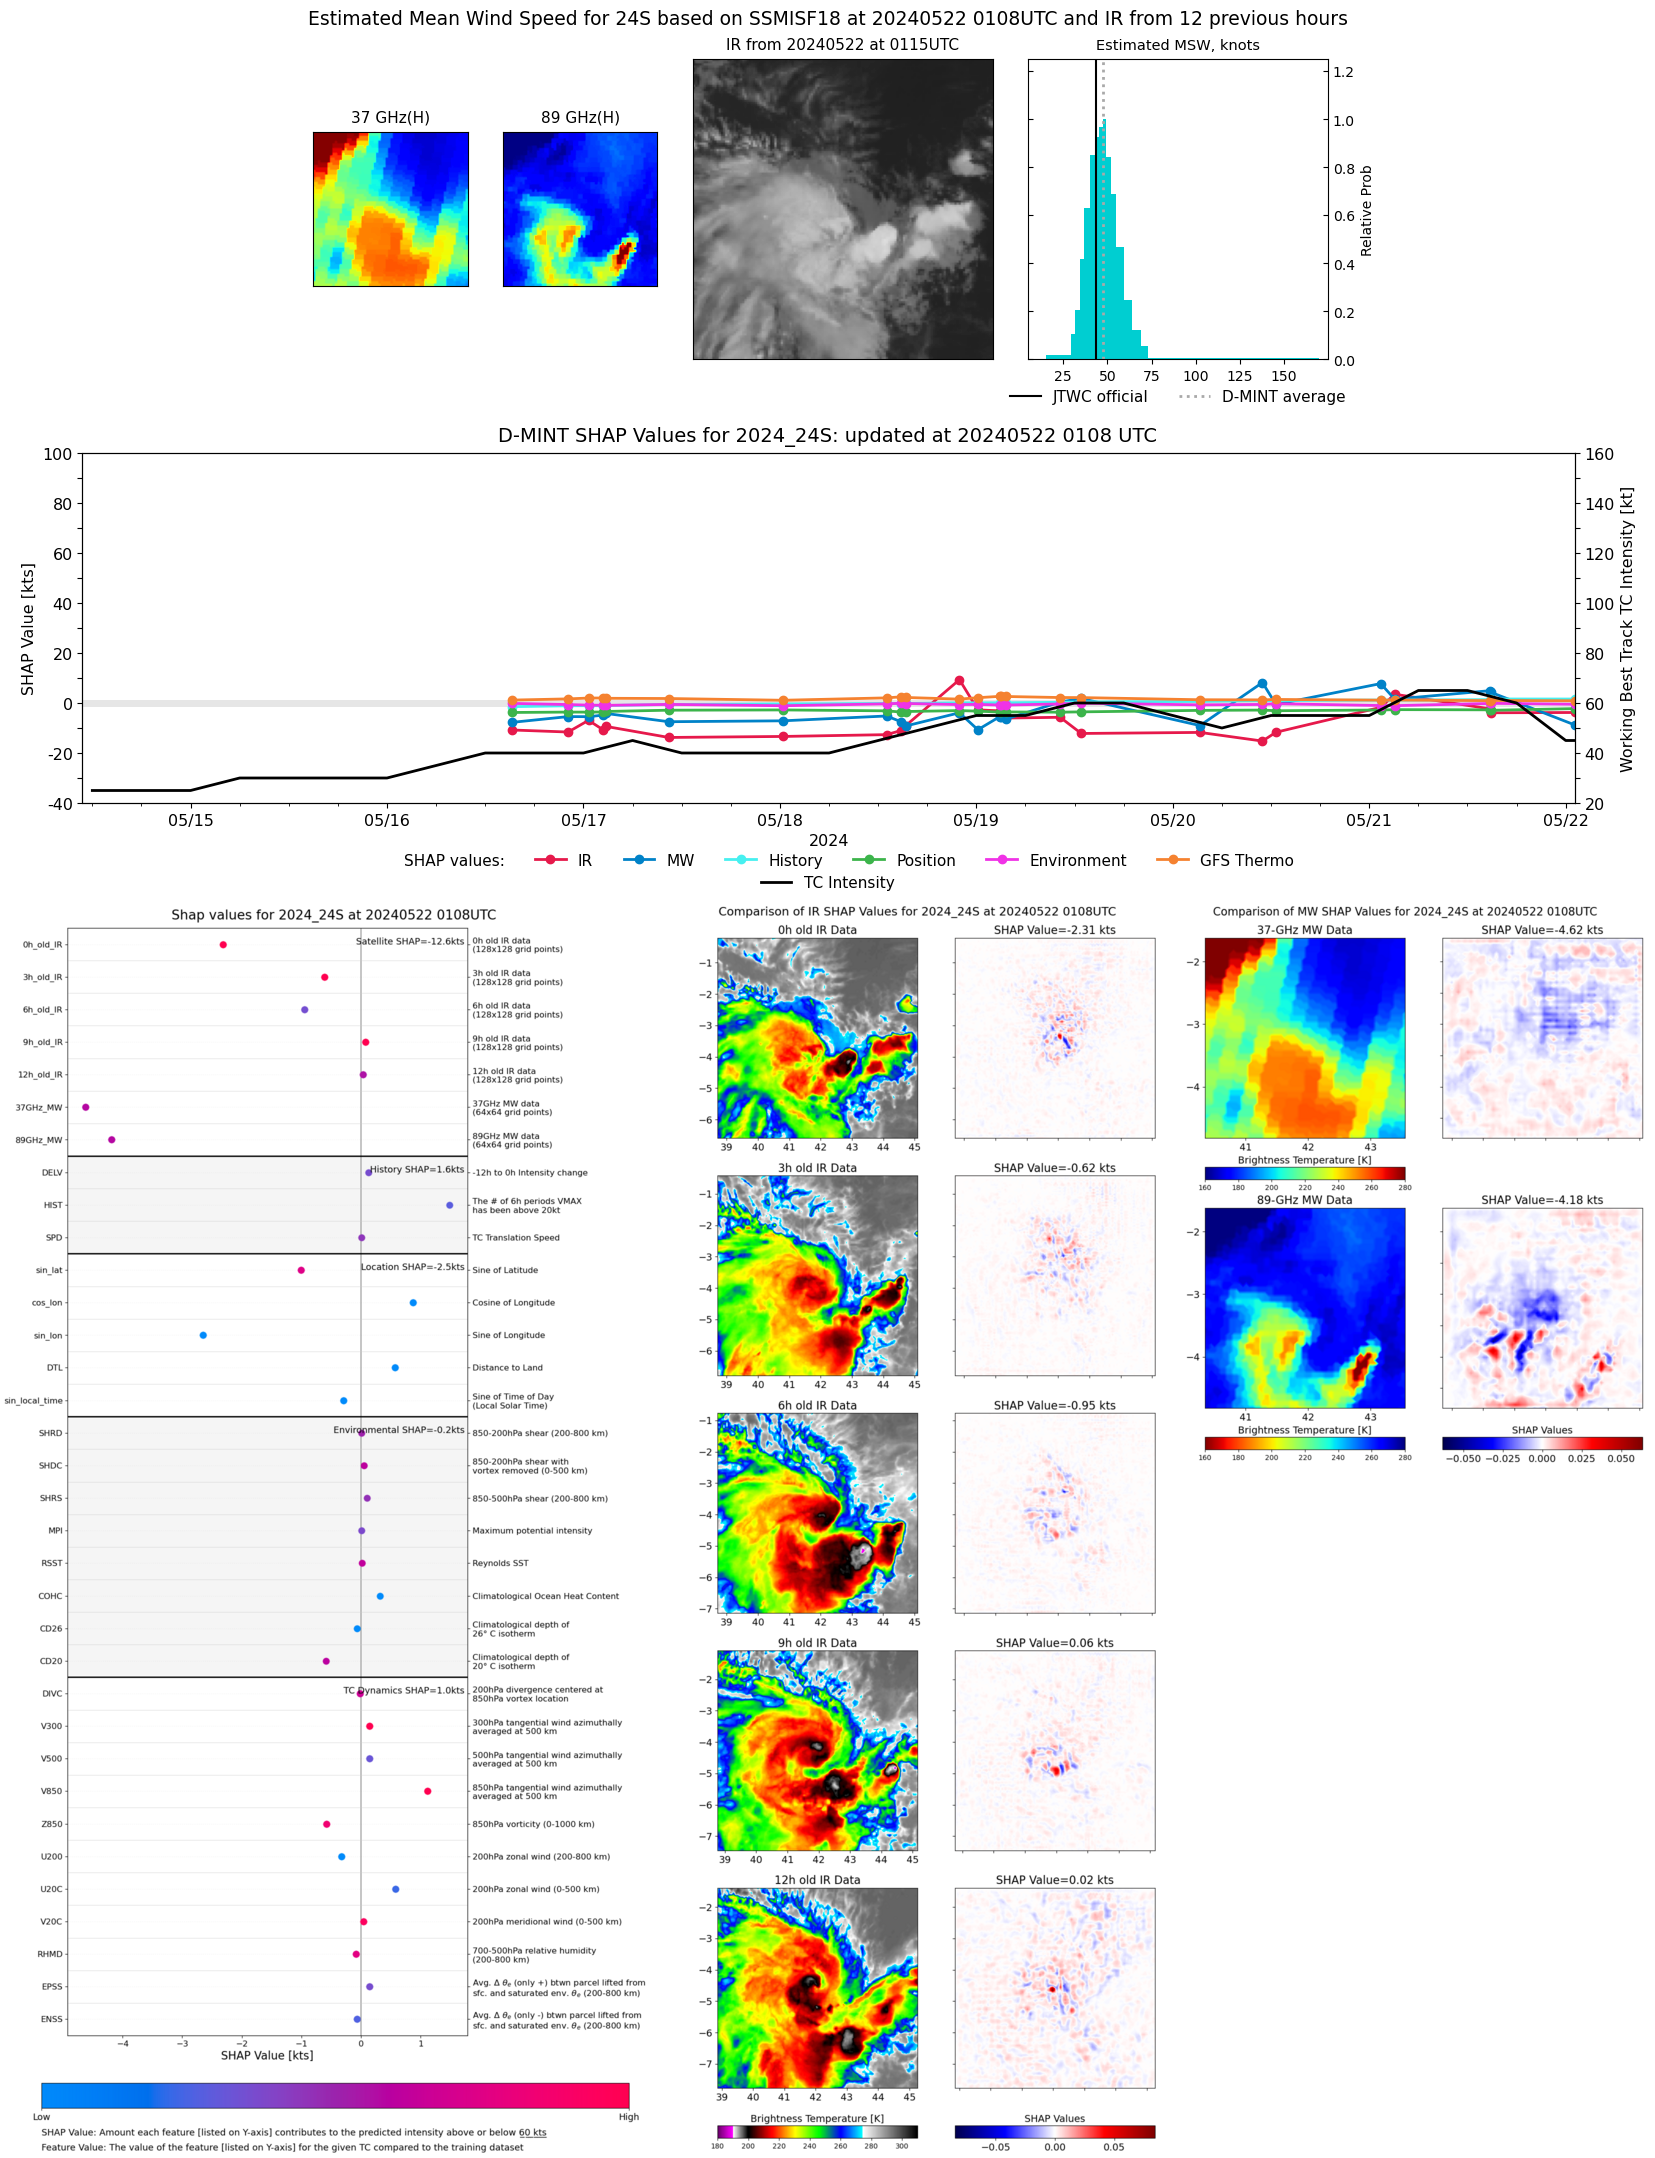 |
| 20240521 | 2226 UTC | AMSR2 | 985 hPa | 51 kts | 45 kts | 58 kts |  |
| 20240521 | 1452 UTC | GMI | 984 hPa | 60 kts | 53 kts | 67 kts | 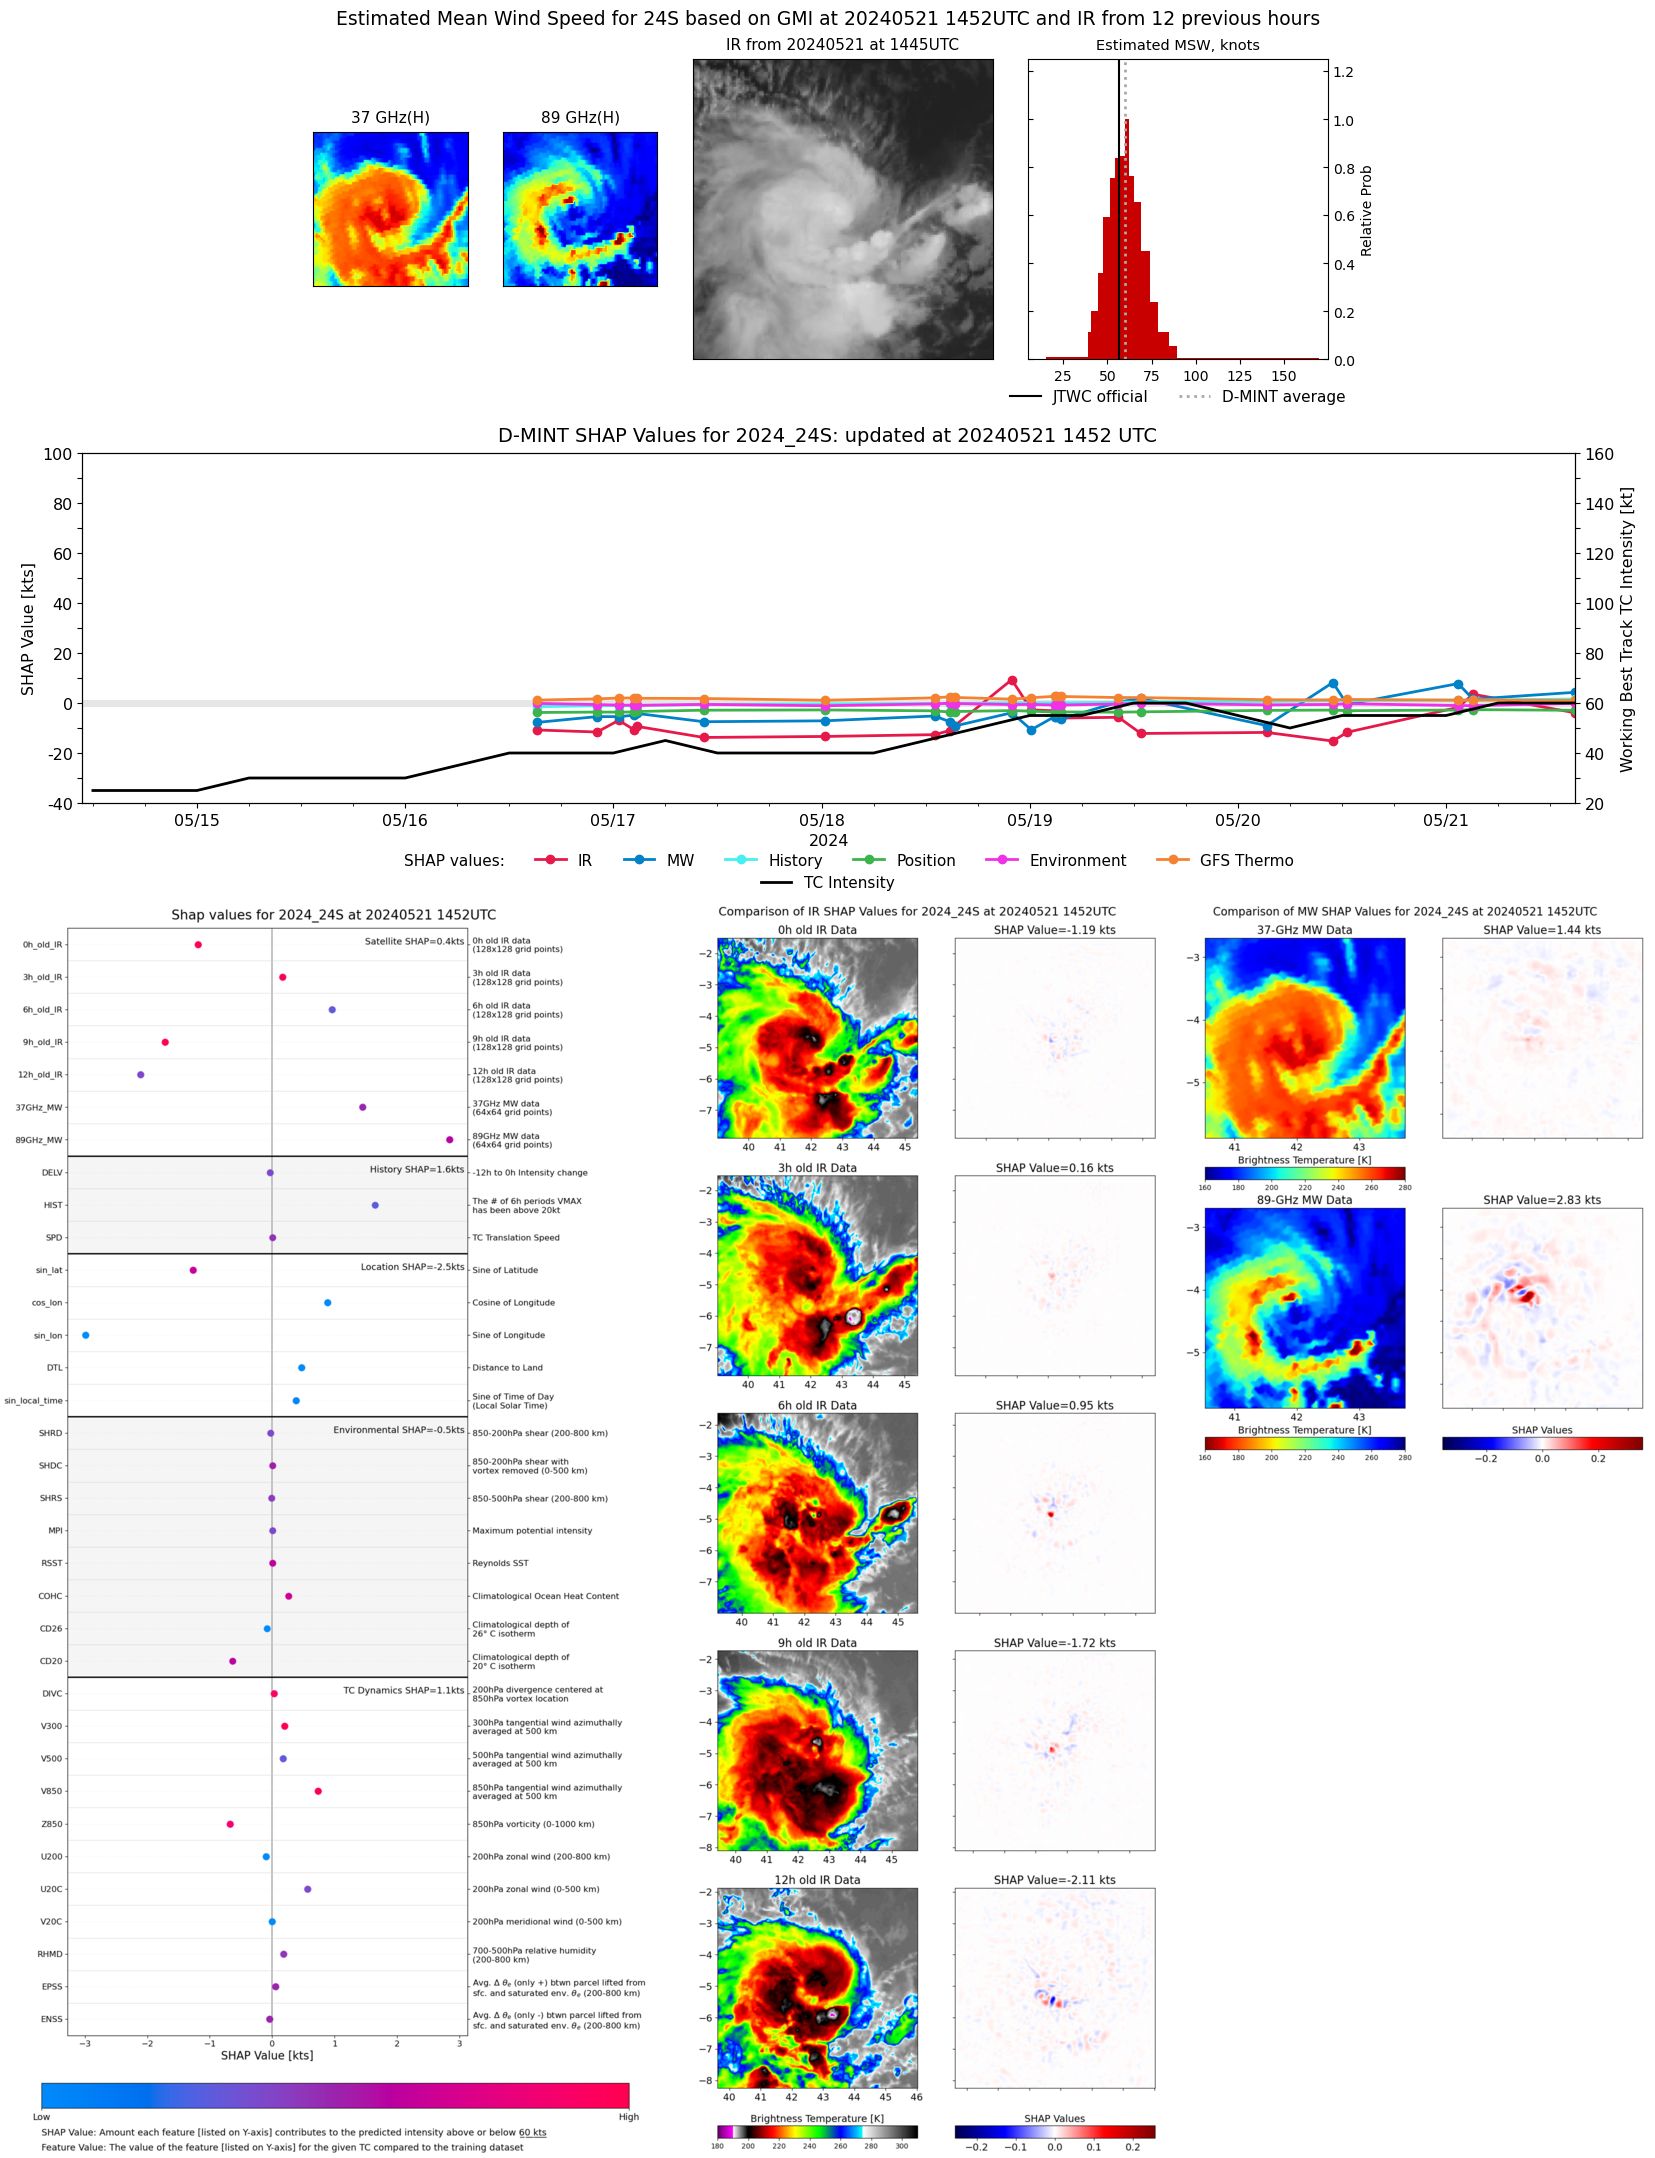 |
| 20240521 | 1114 UTC | ATMS | 985 hPa | 53 kts | 47 kts | 59 kts |  |
| 20240521 | 1048 UTC | ATMS | NaN hPa | 53 kts | 48 kts | 59 kts | 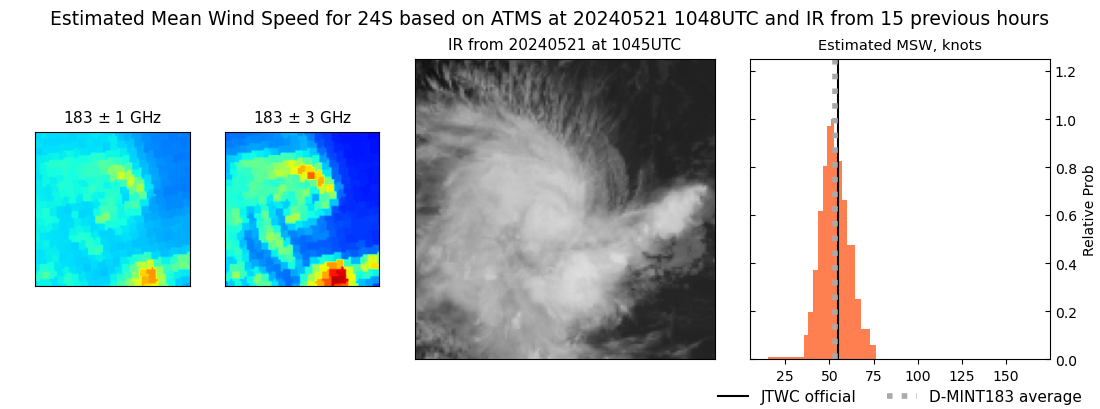 |
| 20240521 | 0323 UTC | SSMISF16 | 984 hPa | 64 kts | 57 kts | 71 kts | 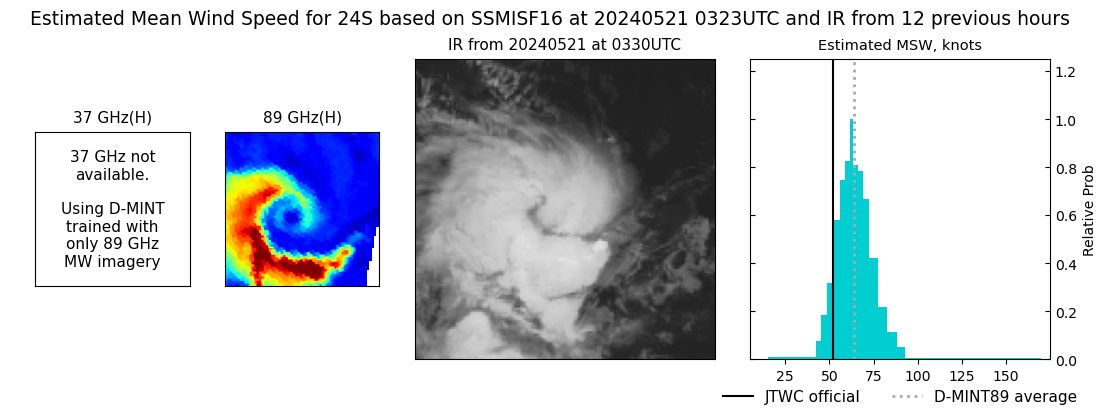 |
| 20240521 | 0306 UTC | SSMISF17 | 977 hPa | 64 kts | 57 kts | 70 kts | 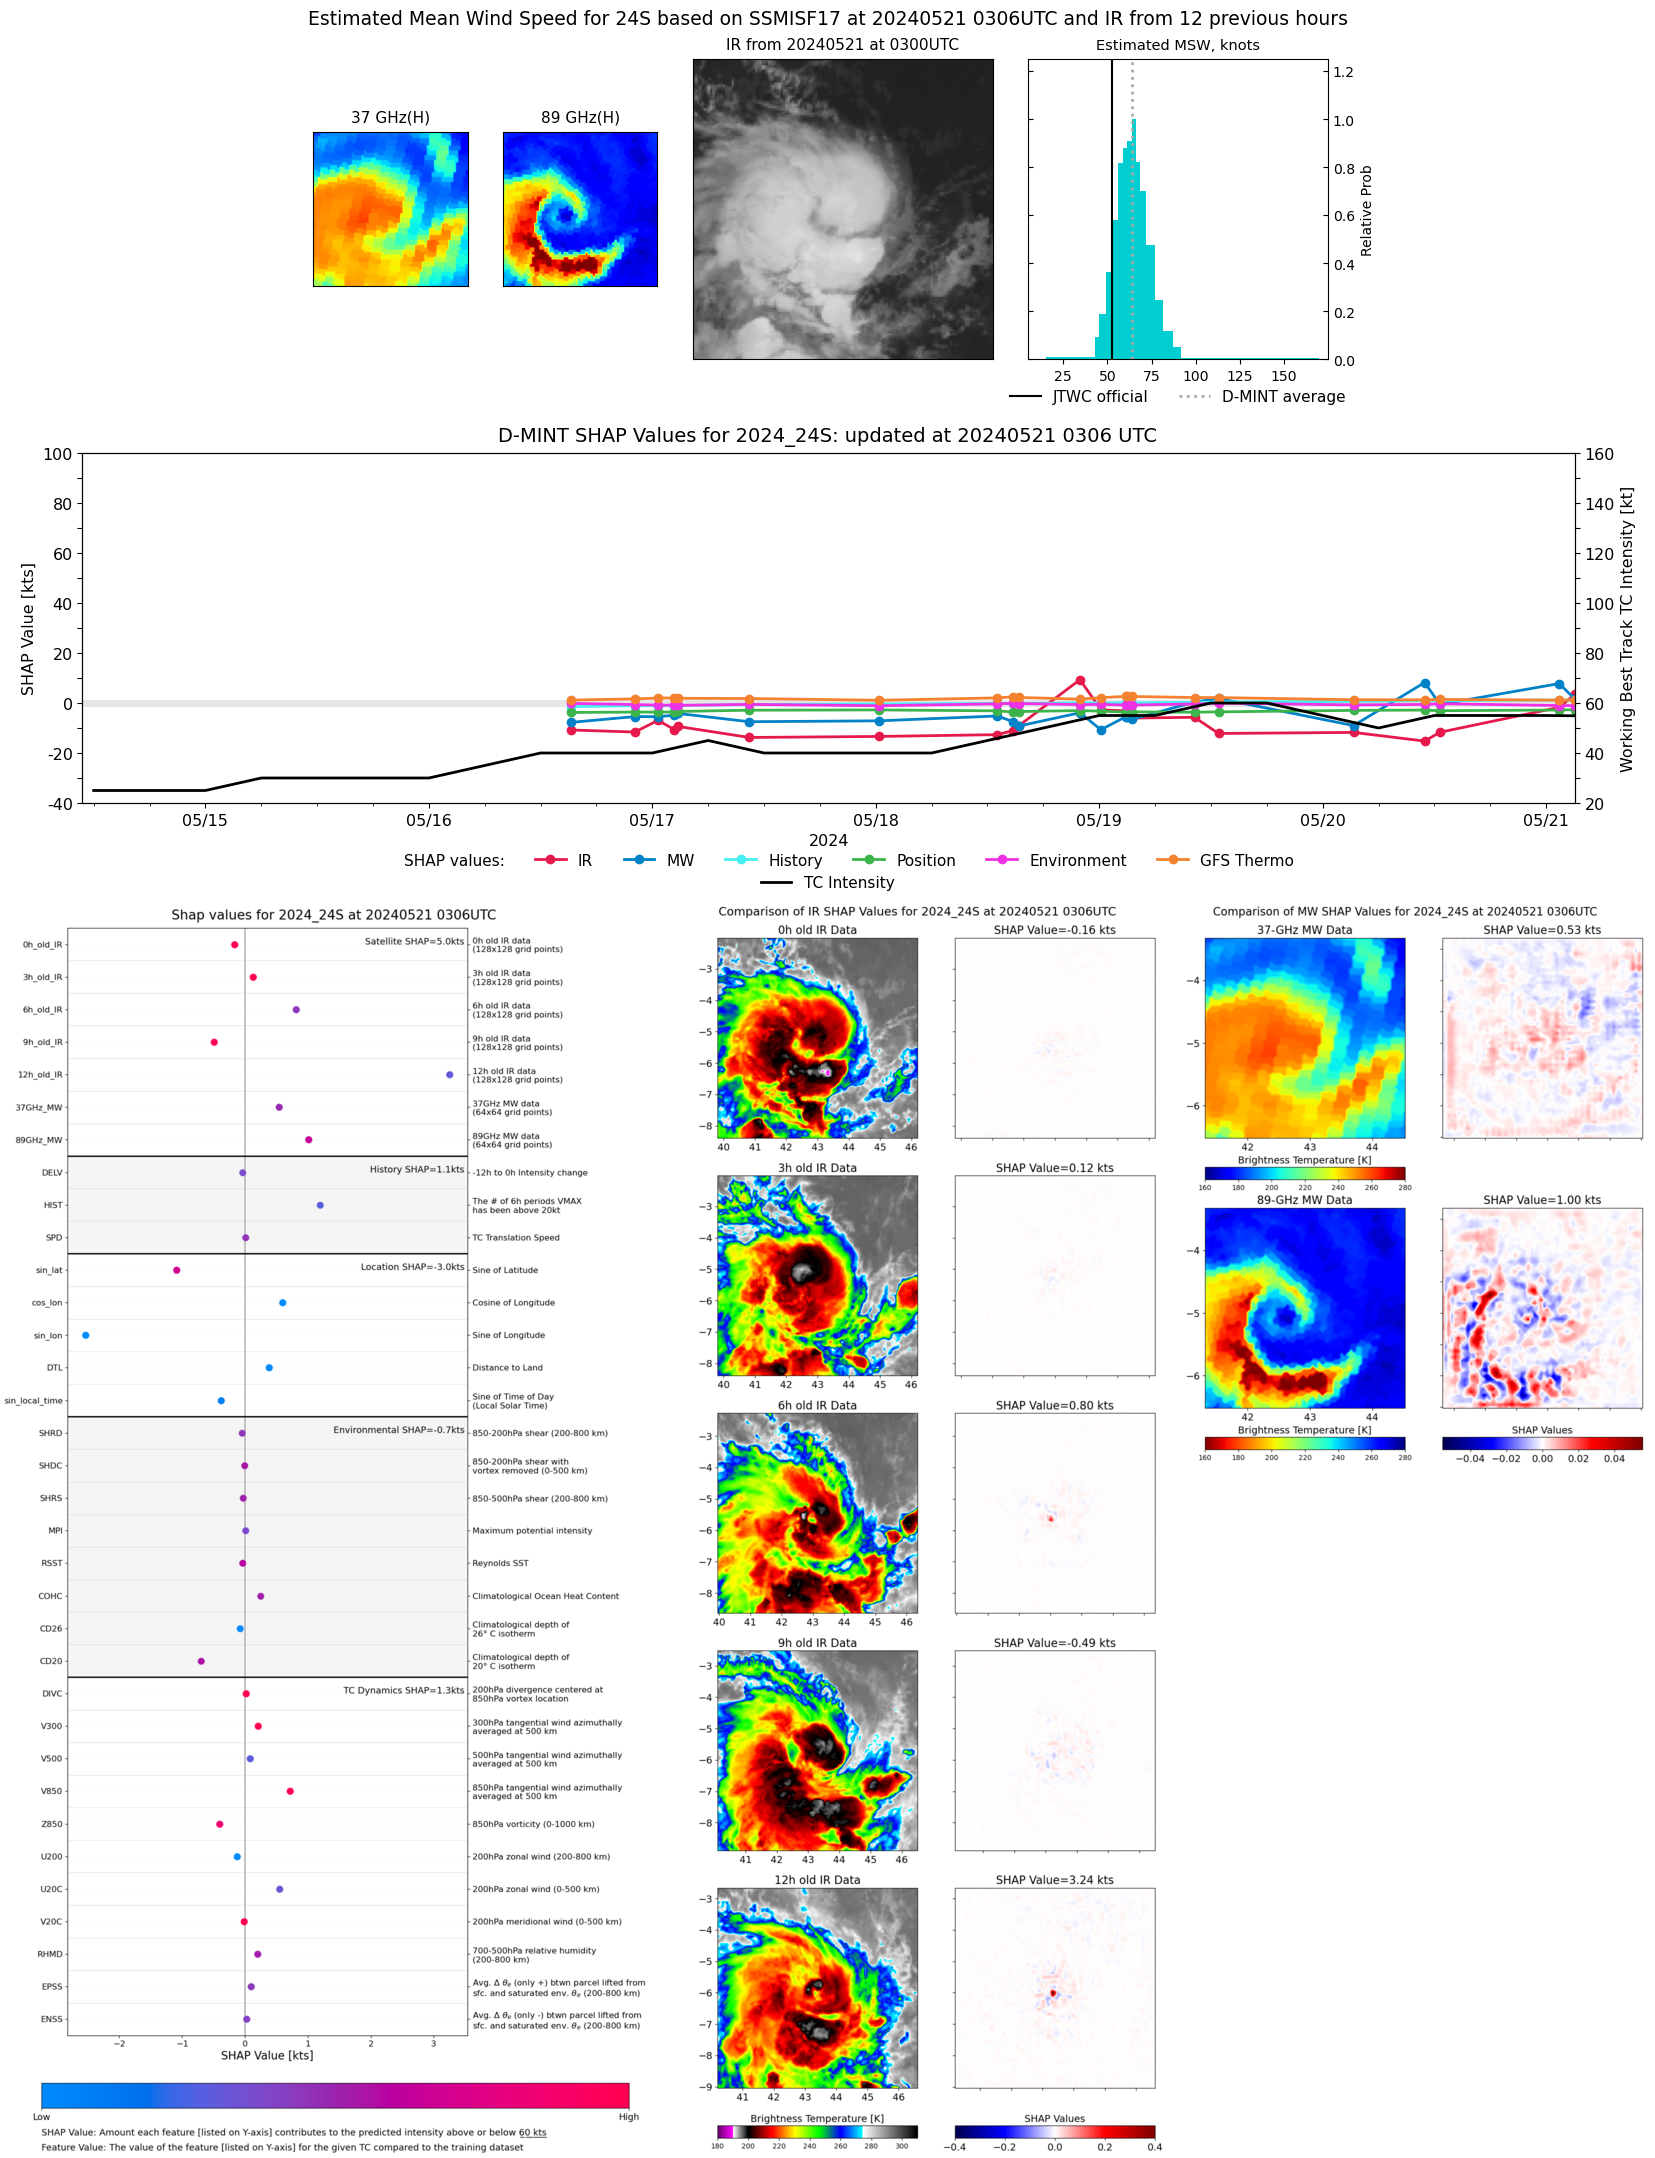 |
| 20240521 | 0124 UTC | SSMISF18 | 983 hPa | 65 kts | 58 kts | 71 kts | 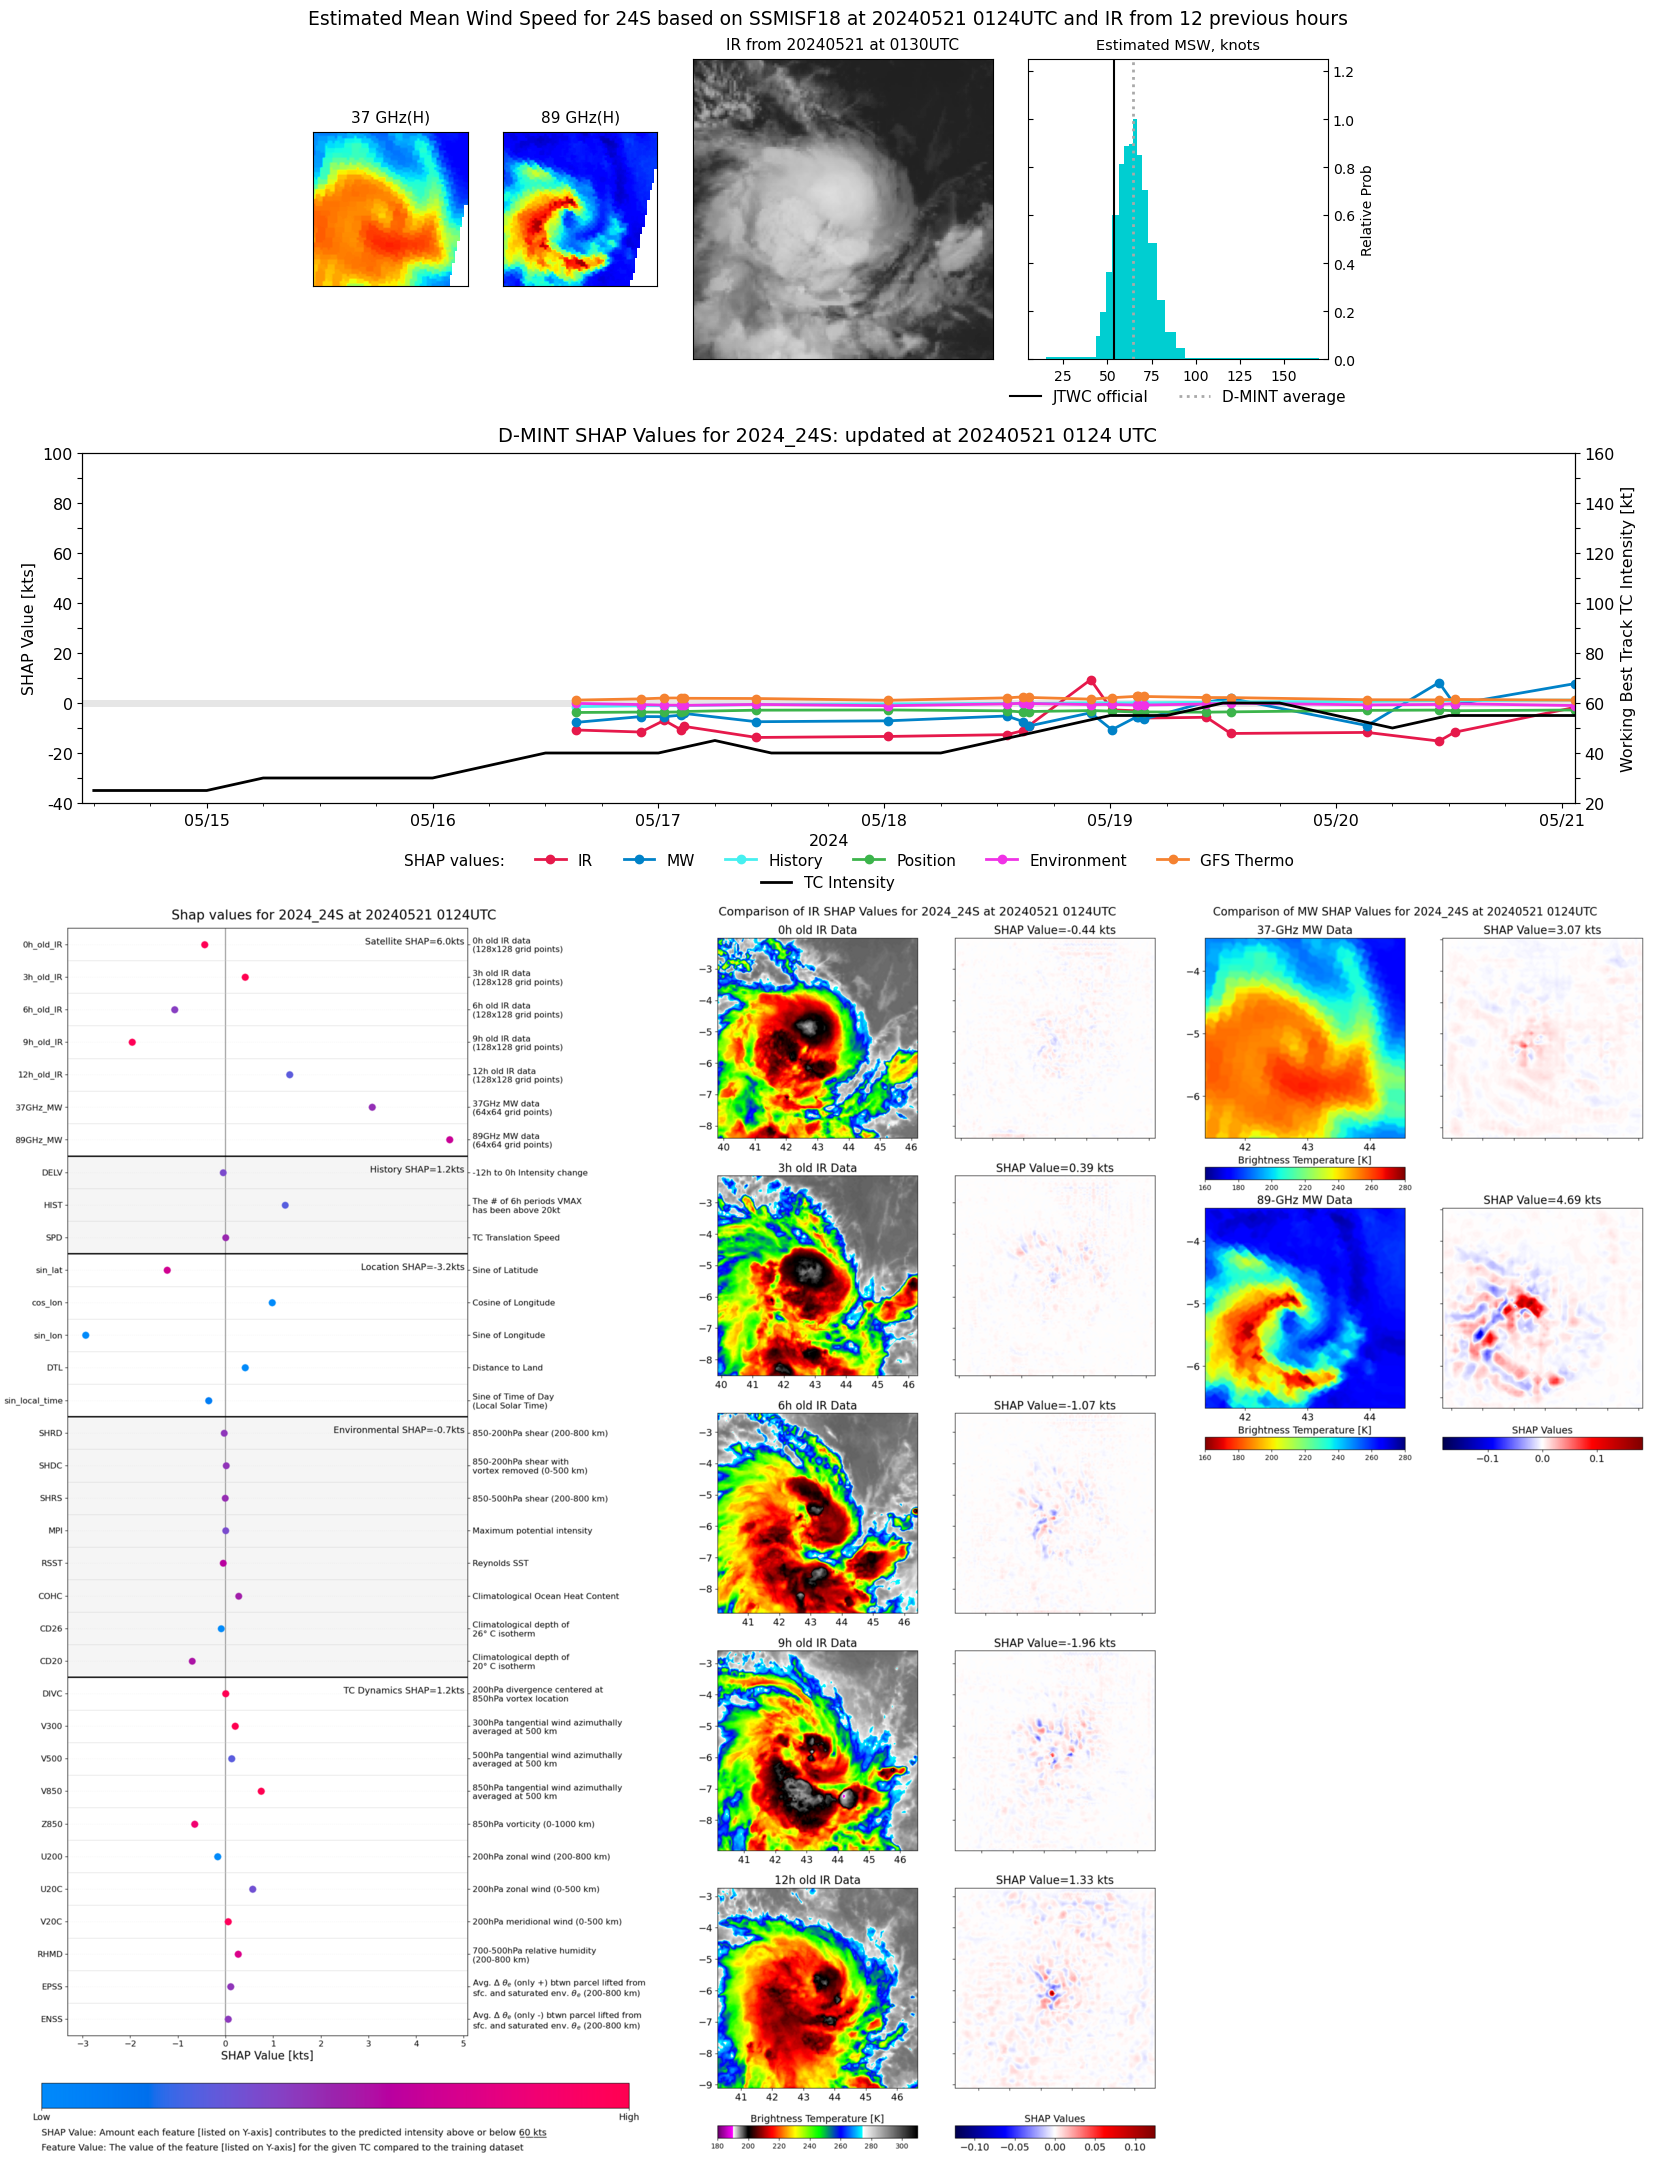 |
| 20240520 | 1438 UTC | SSMISF16 | 990 hPa | 47 kts | 41 kts | 53 kts | 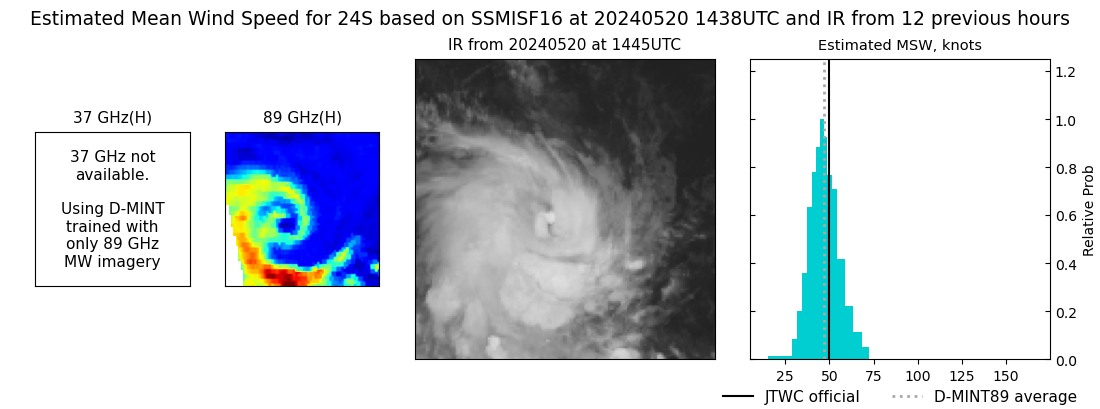 |
| 20240520 | 1236 UTC | SSMISF18 | 992 hPa | 47 kts | 41 kts | 53 kts | 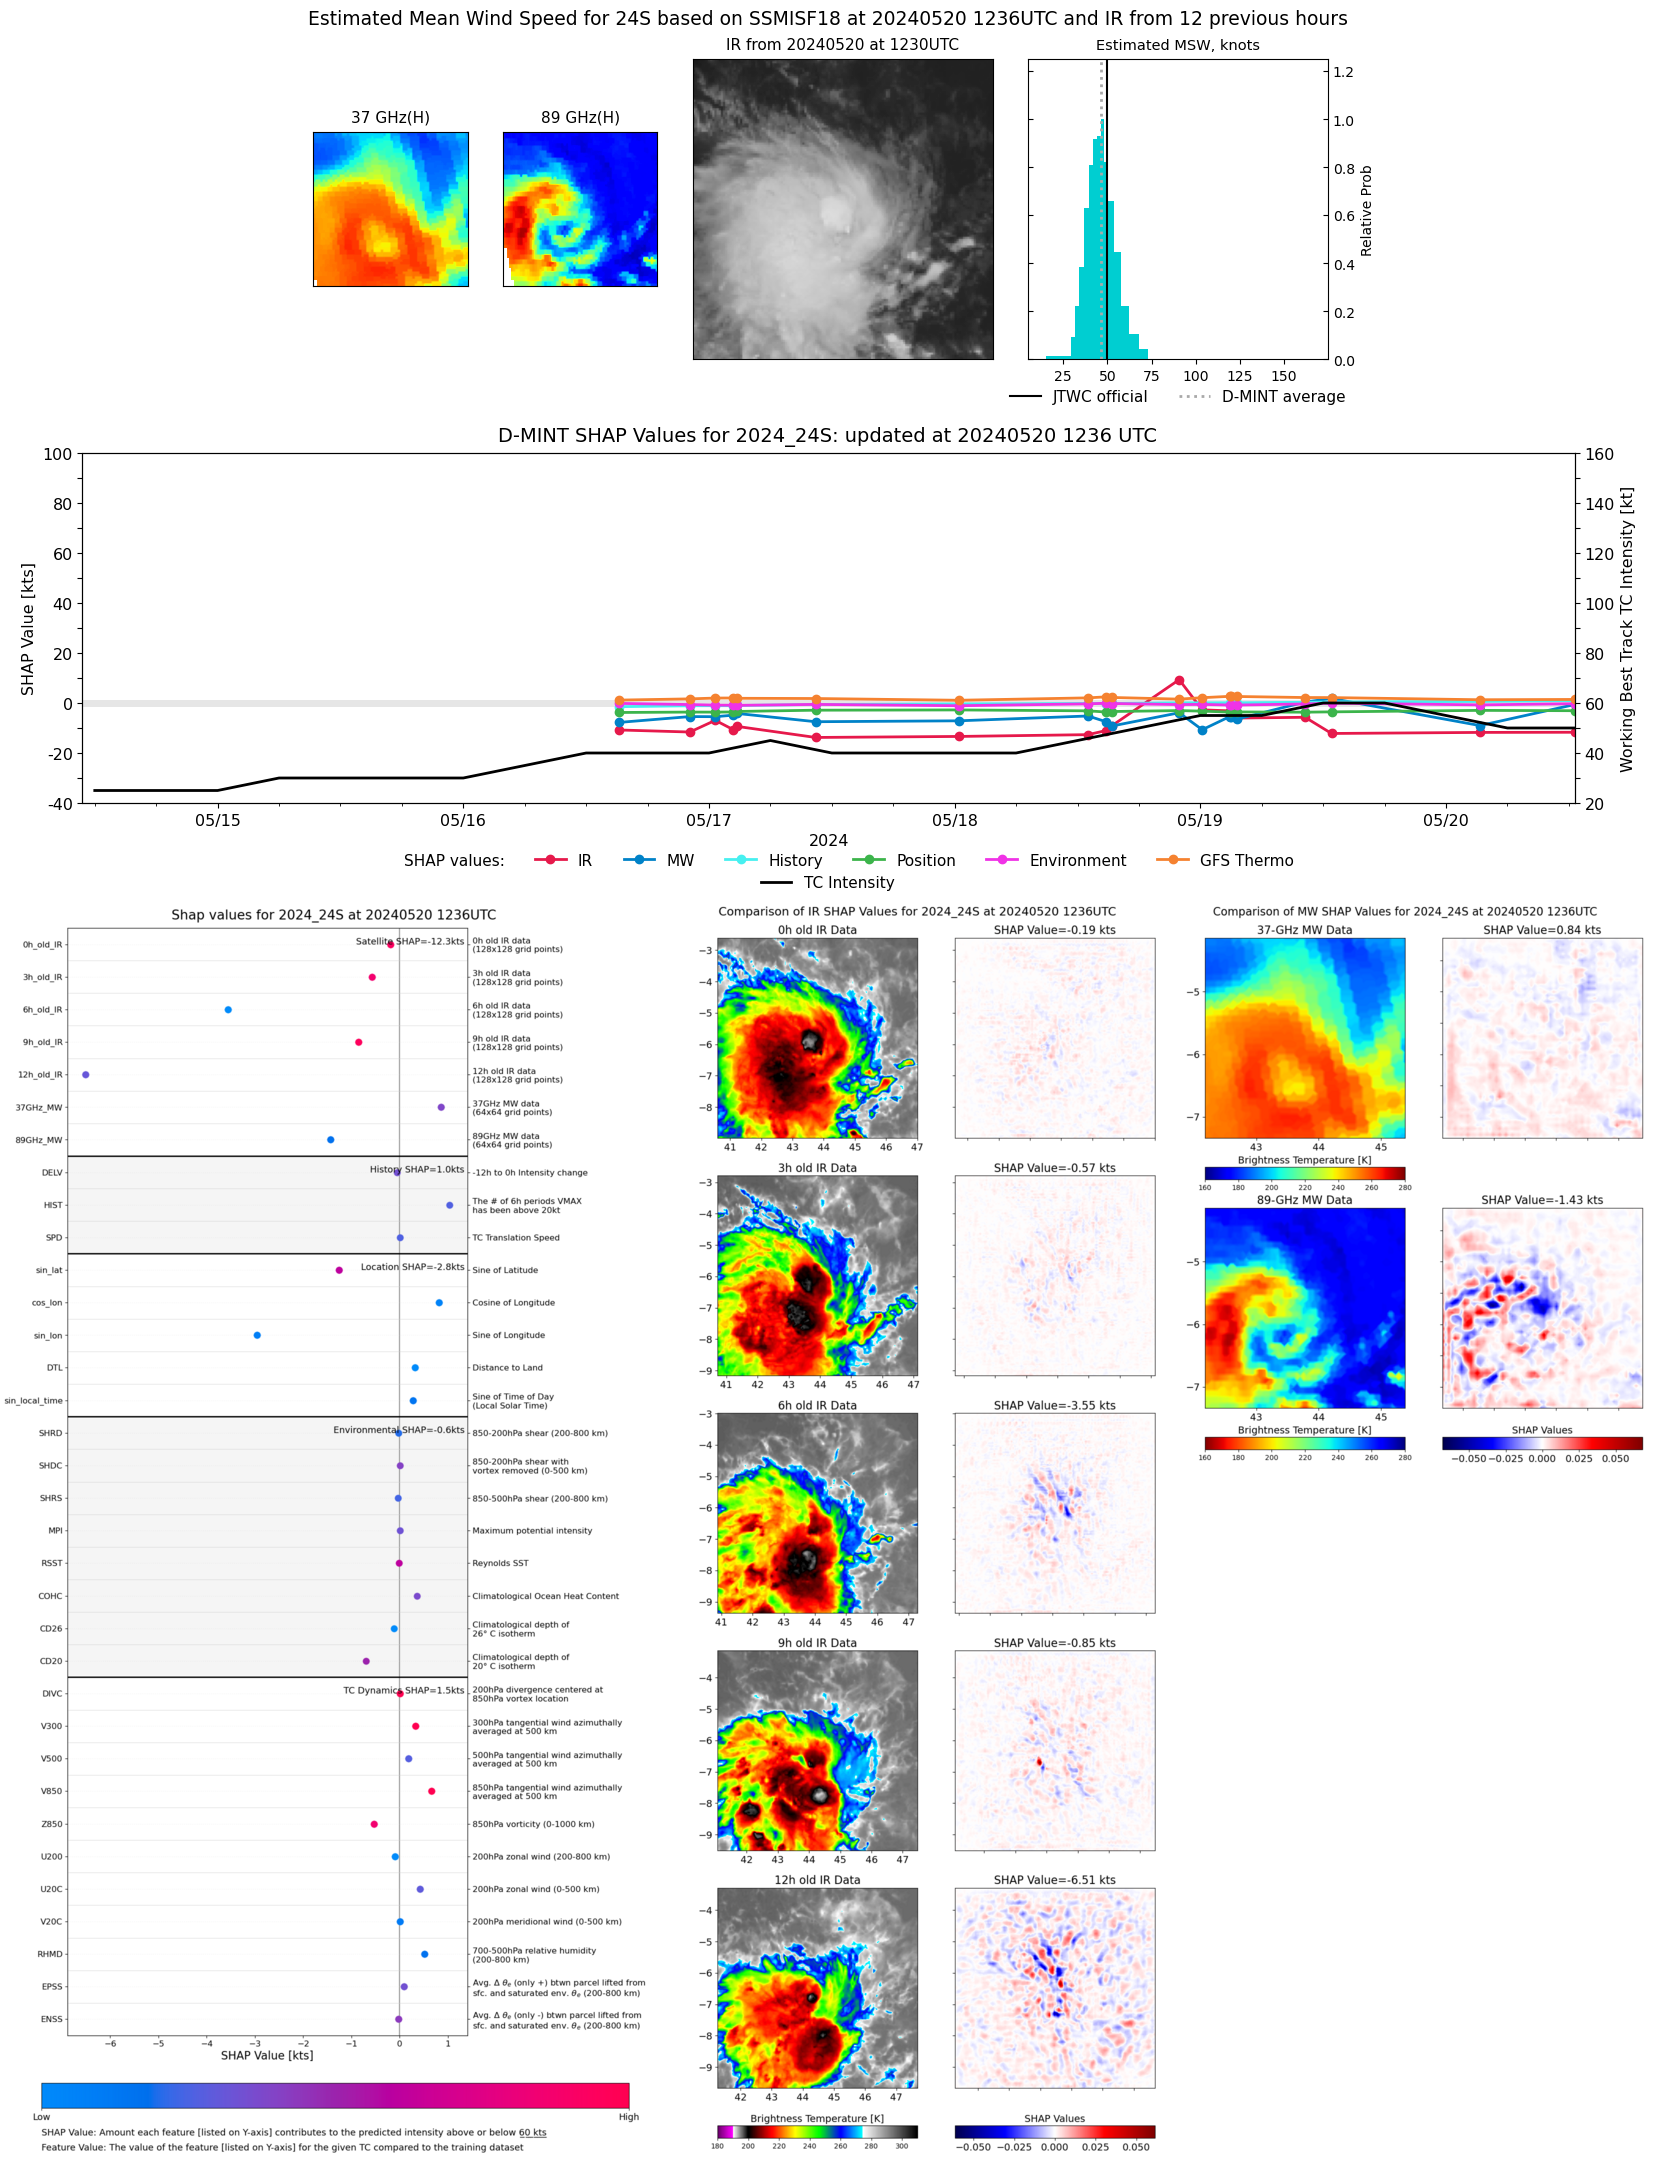 |
| 20240520 | 1057 UTC | AMSR2 | 992 hPa | 52 kts | 46 kts | 57 kts | 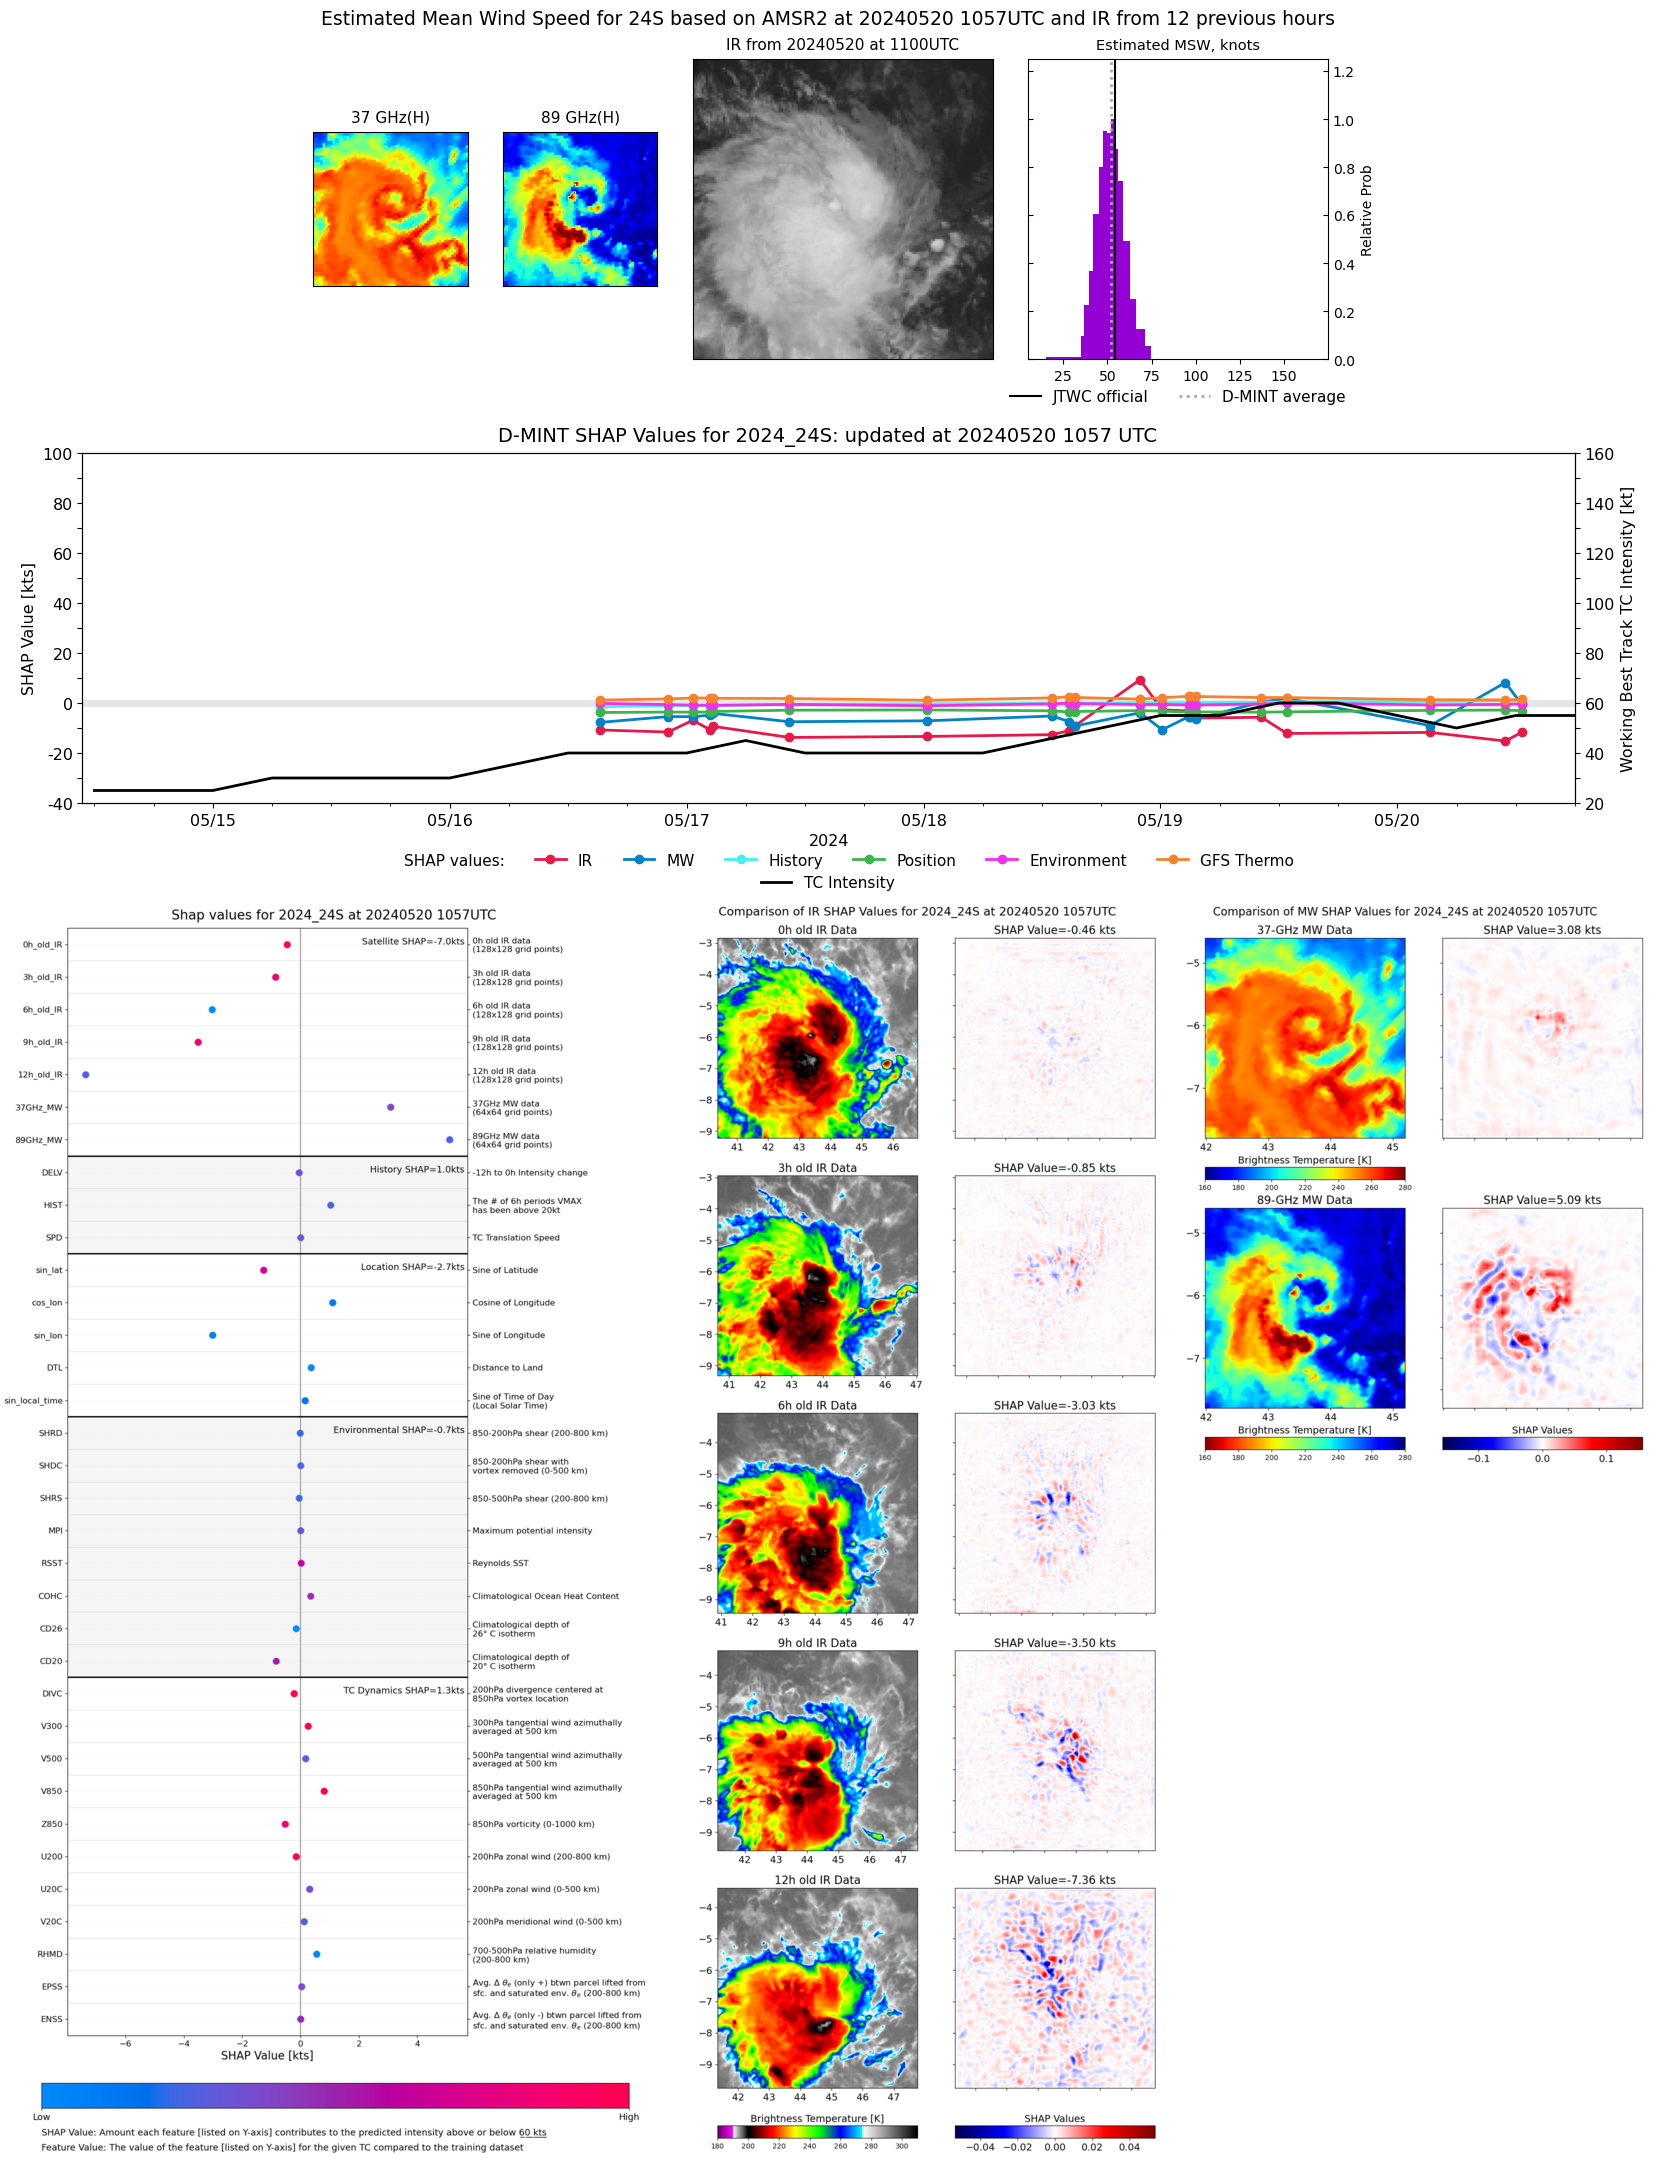 |
| 20240520 | 0319 UTC | SSMISF17 | 996 hPa | 38 kts | 33 kts | 43 kts | 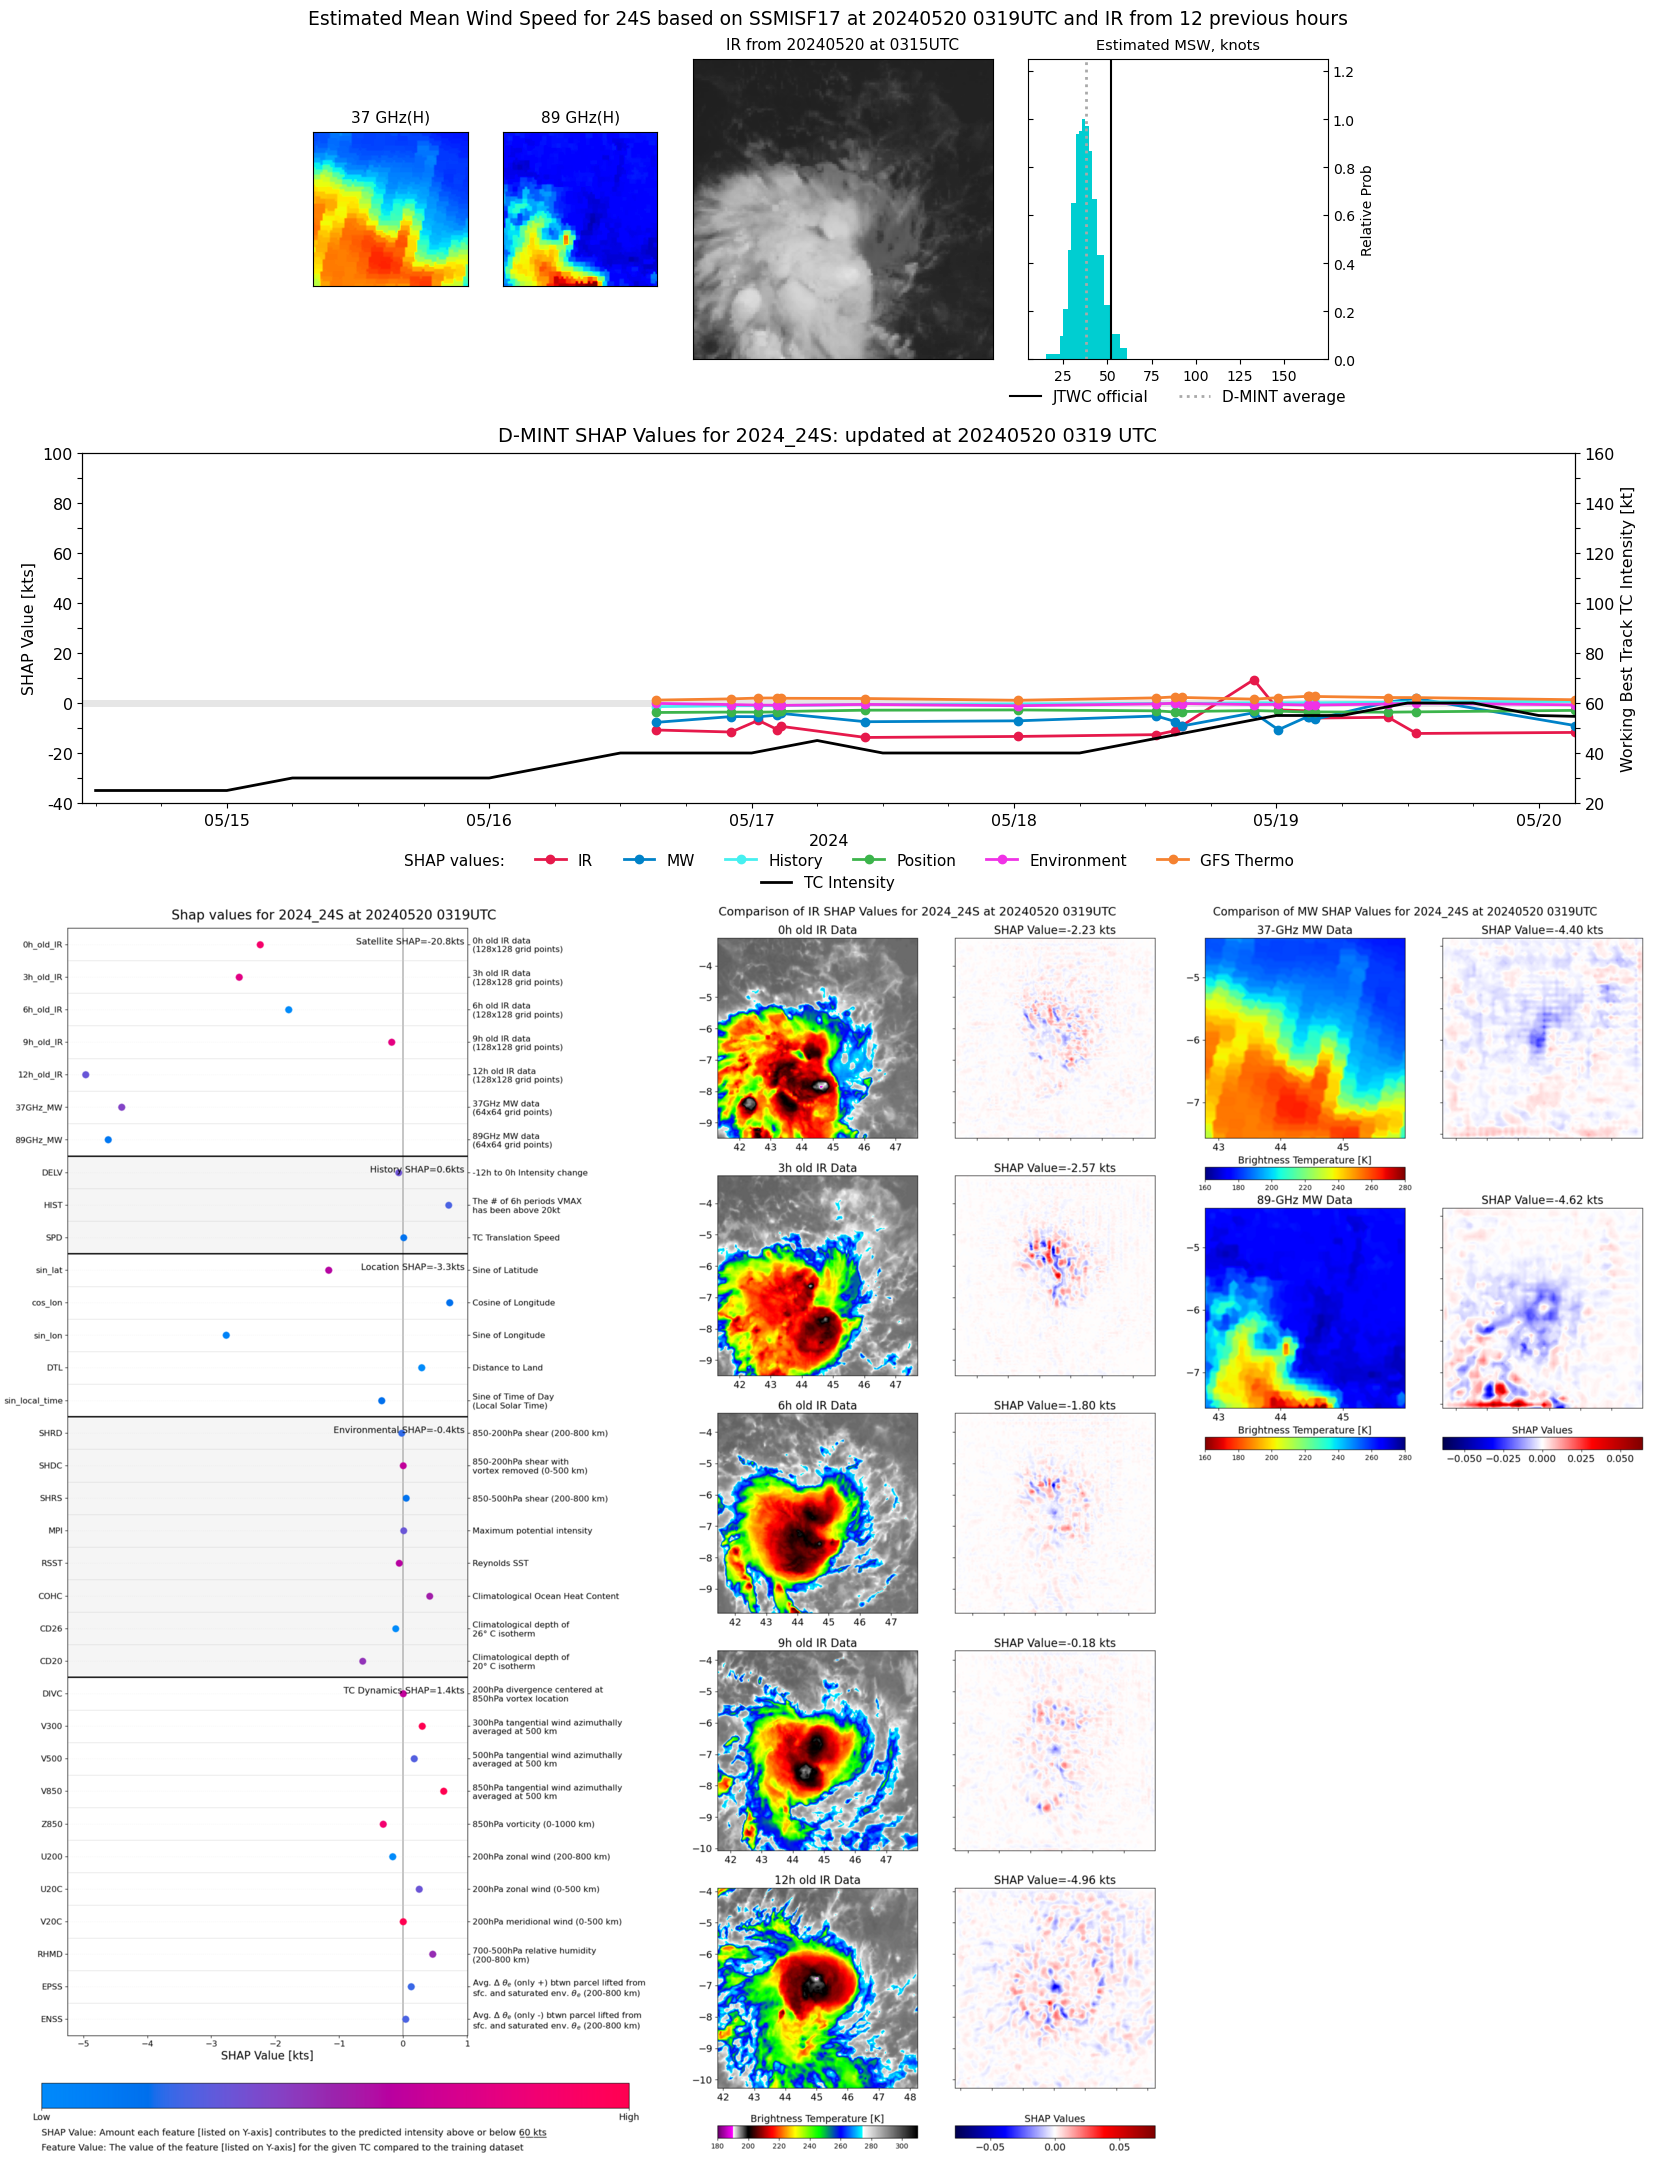 |
| 20240519 | 1450 UTC | SSMISF16 | 984 hPa | 56 kts | 50 kts | 64 kts | 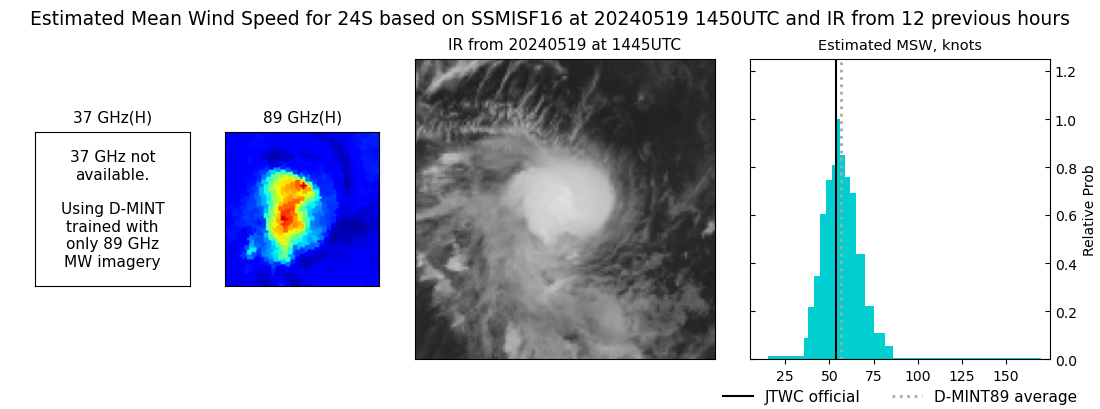 |
| 20240519 | 1249 UTC | SSMISF18 | 990 hPa | 49 kts | 43 kts | 55 kts | 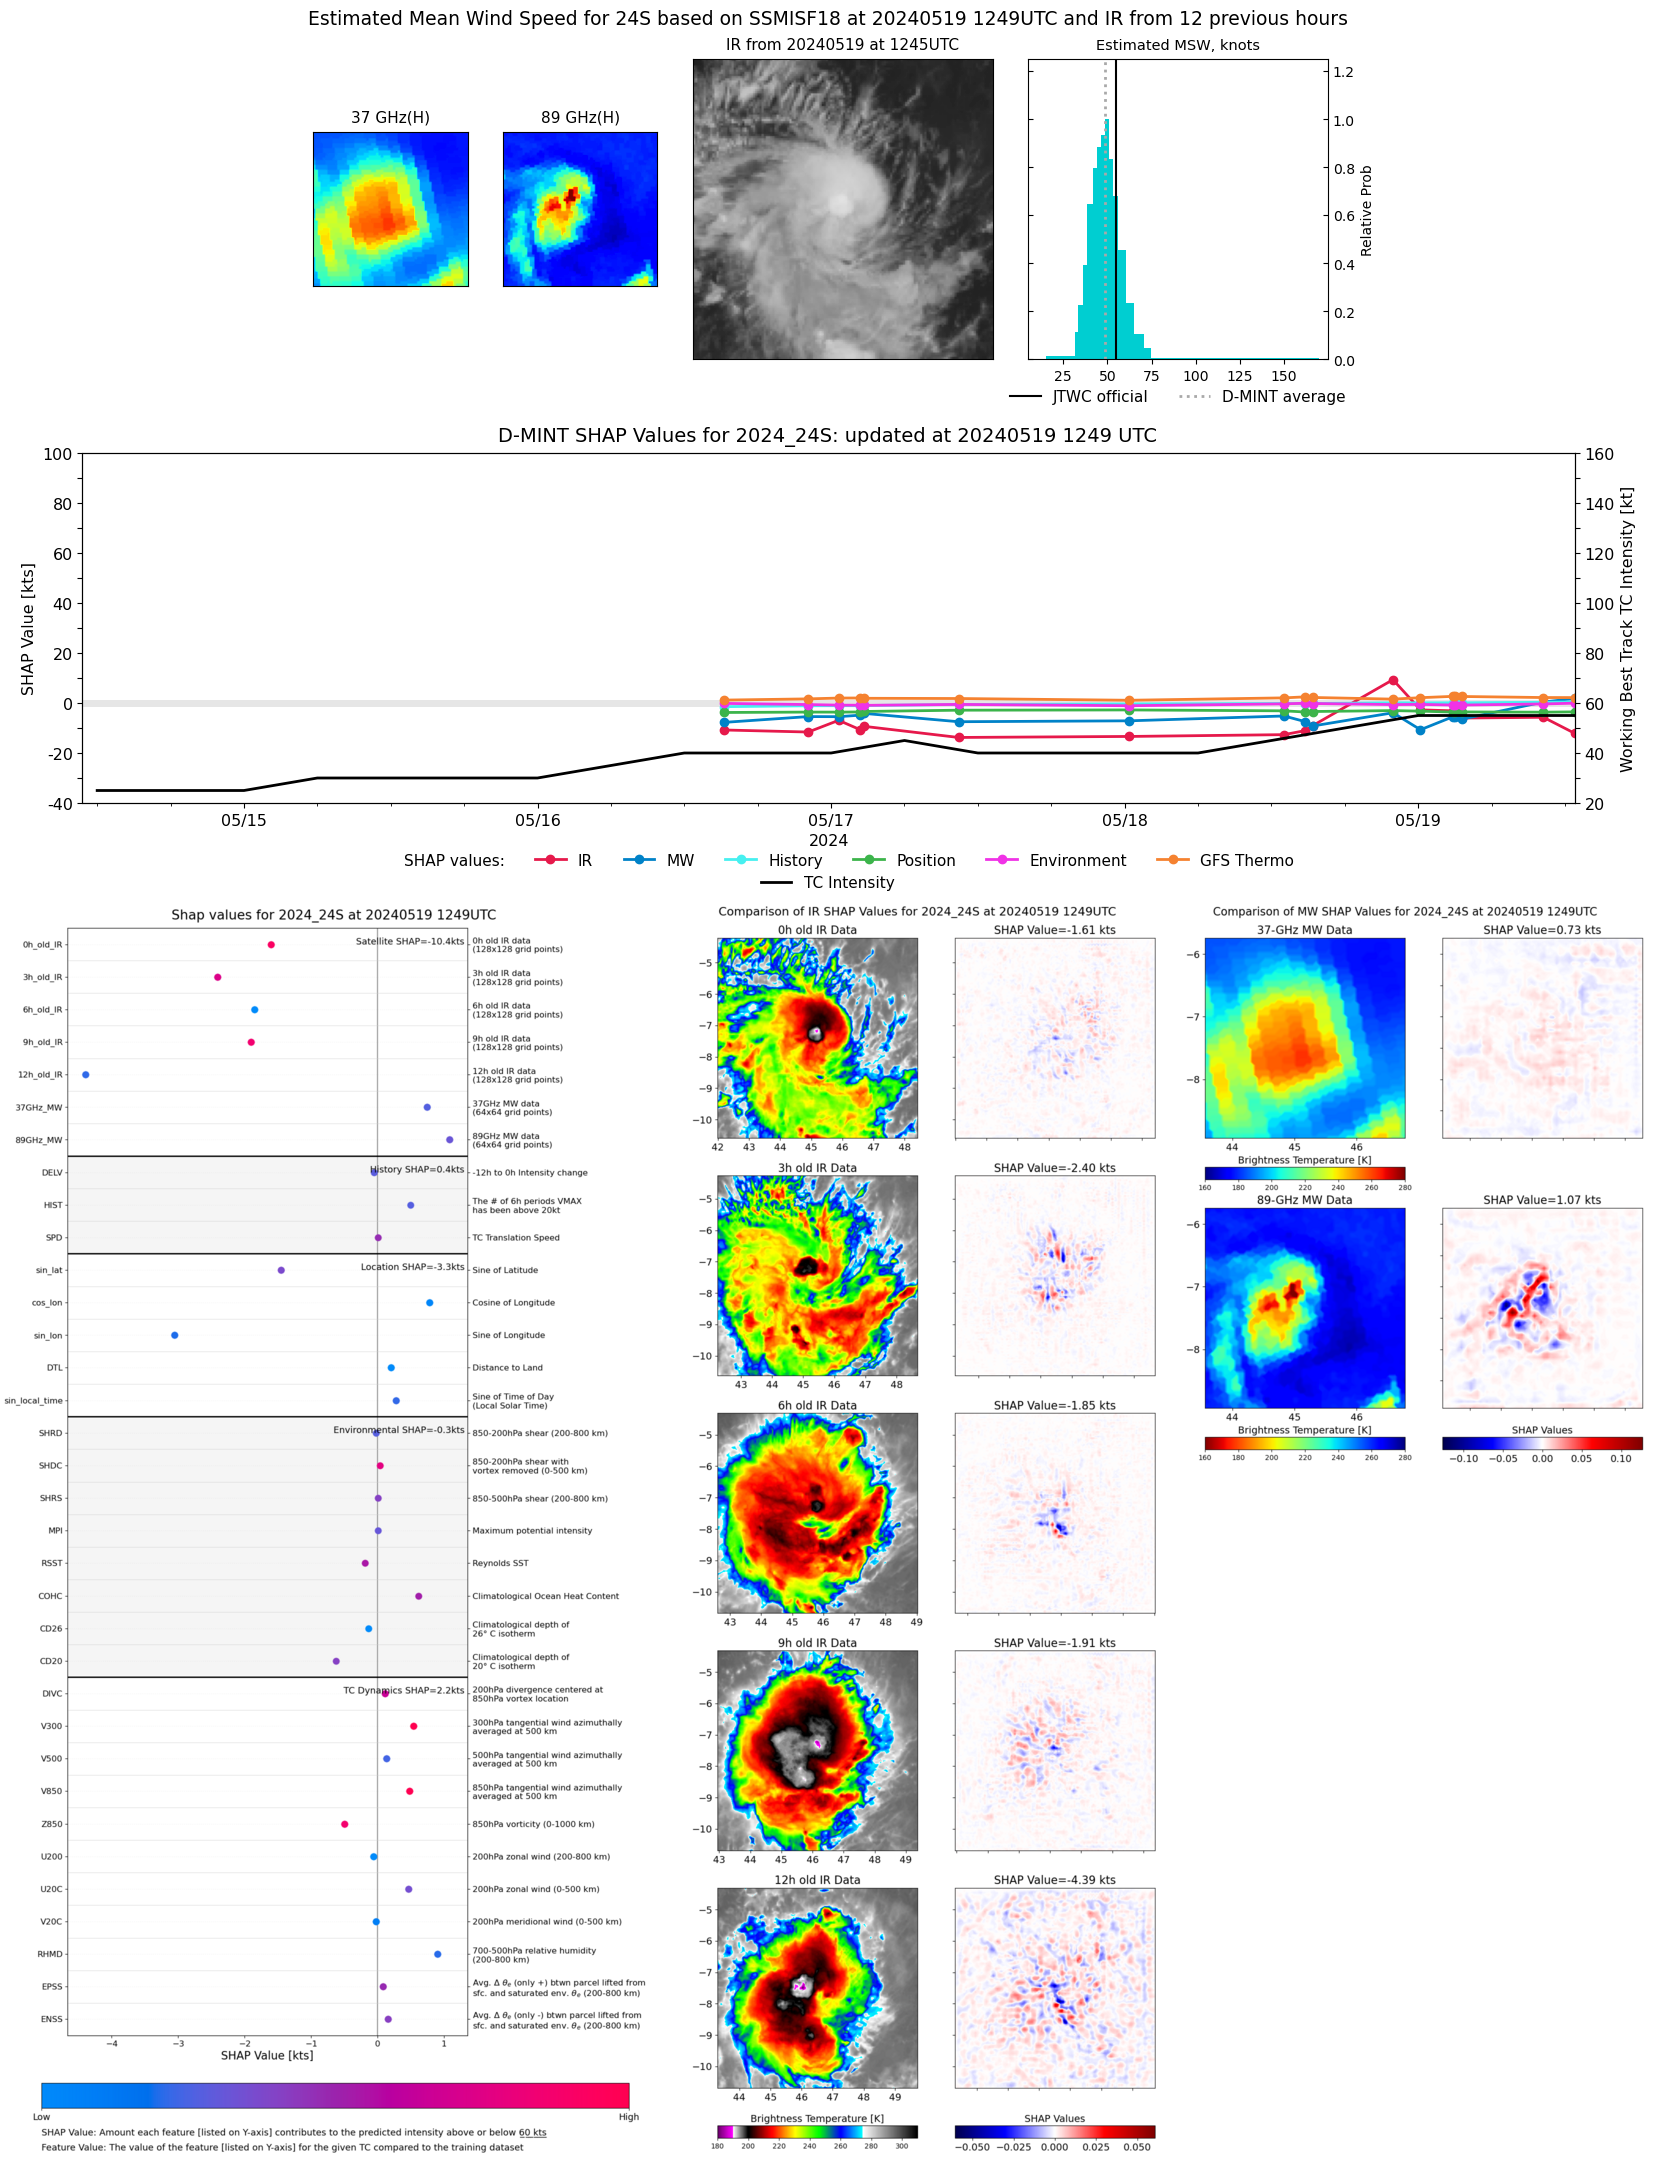 |
| 20240519 | 1014 UTC | AMSR2 | 999 hPa | 53 kts | 47 kts | 59 kts | 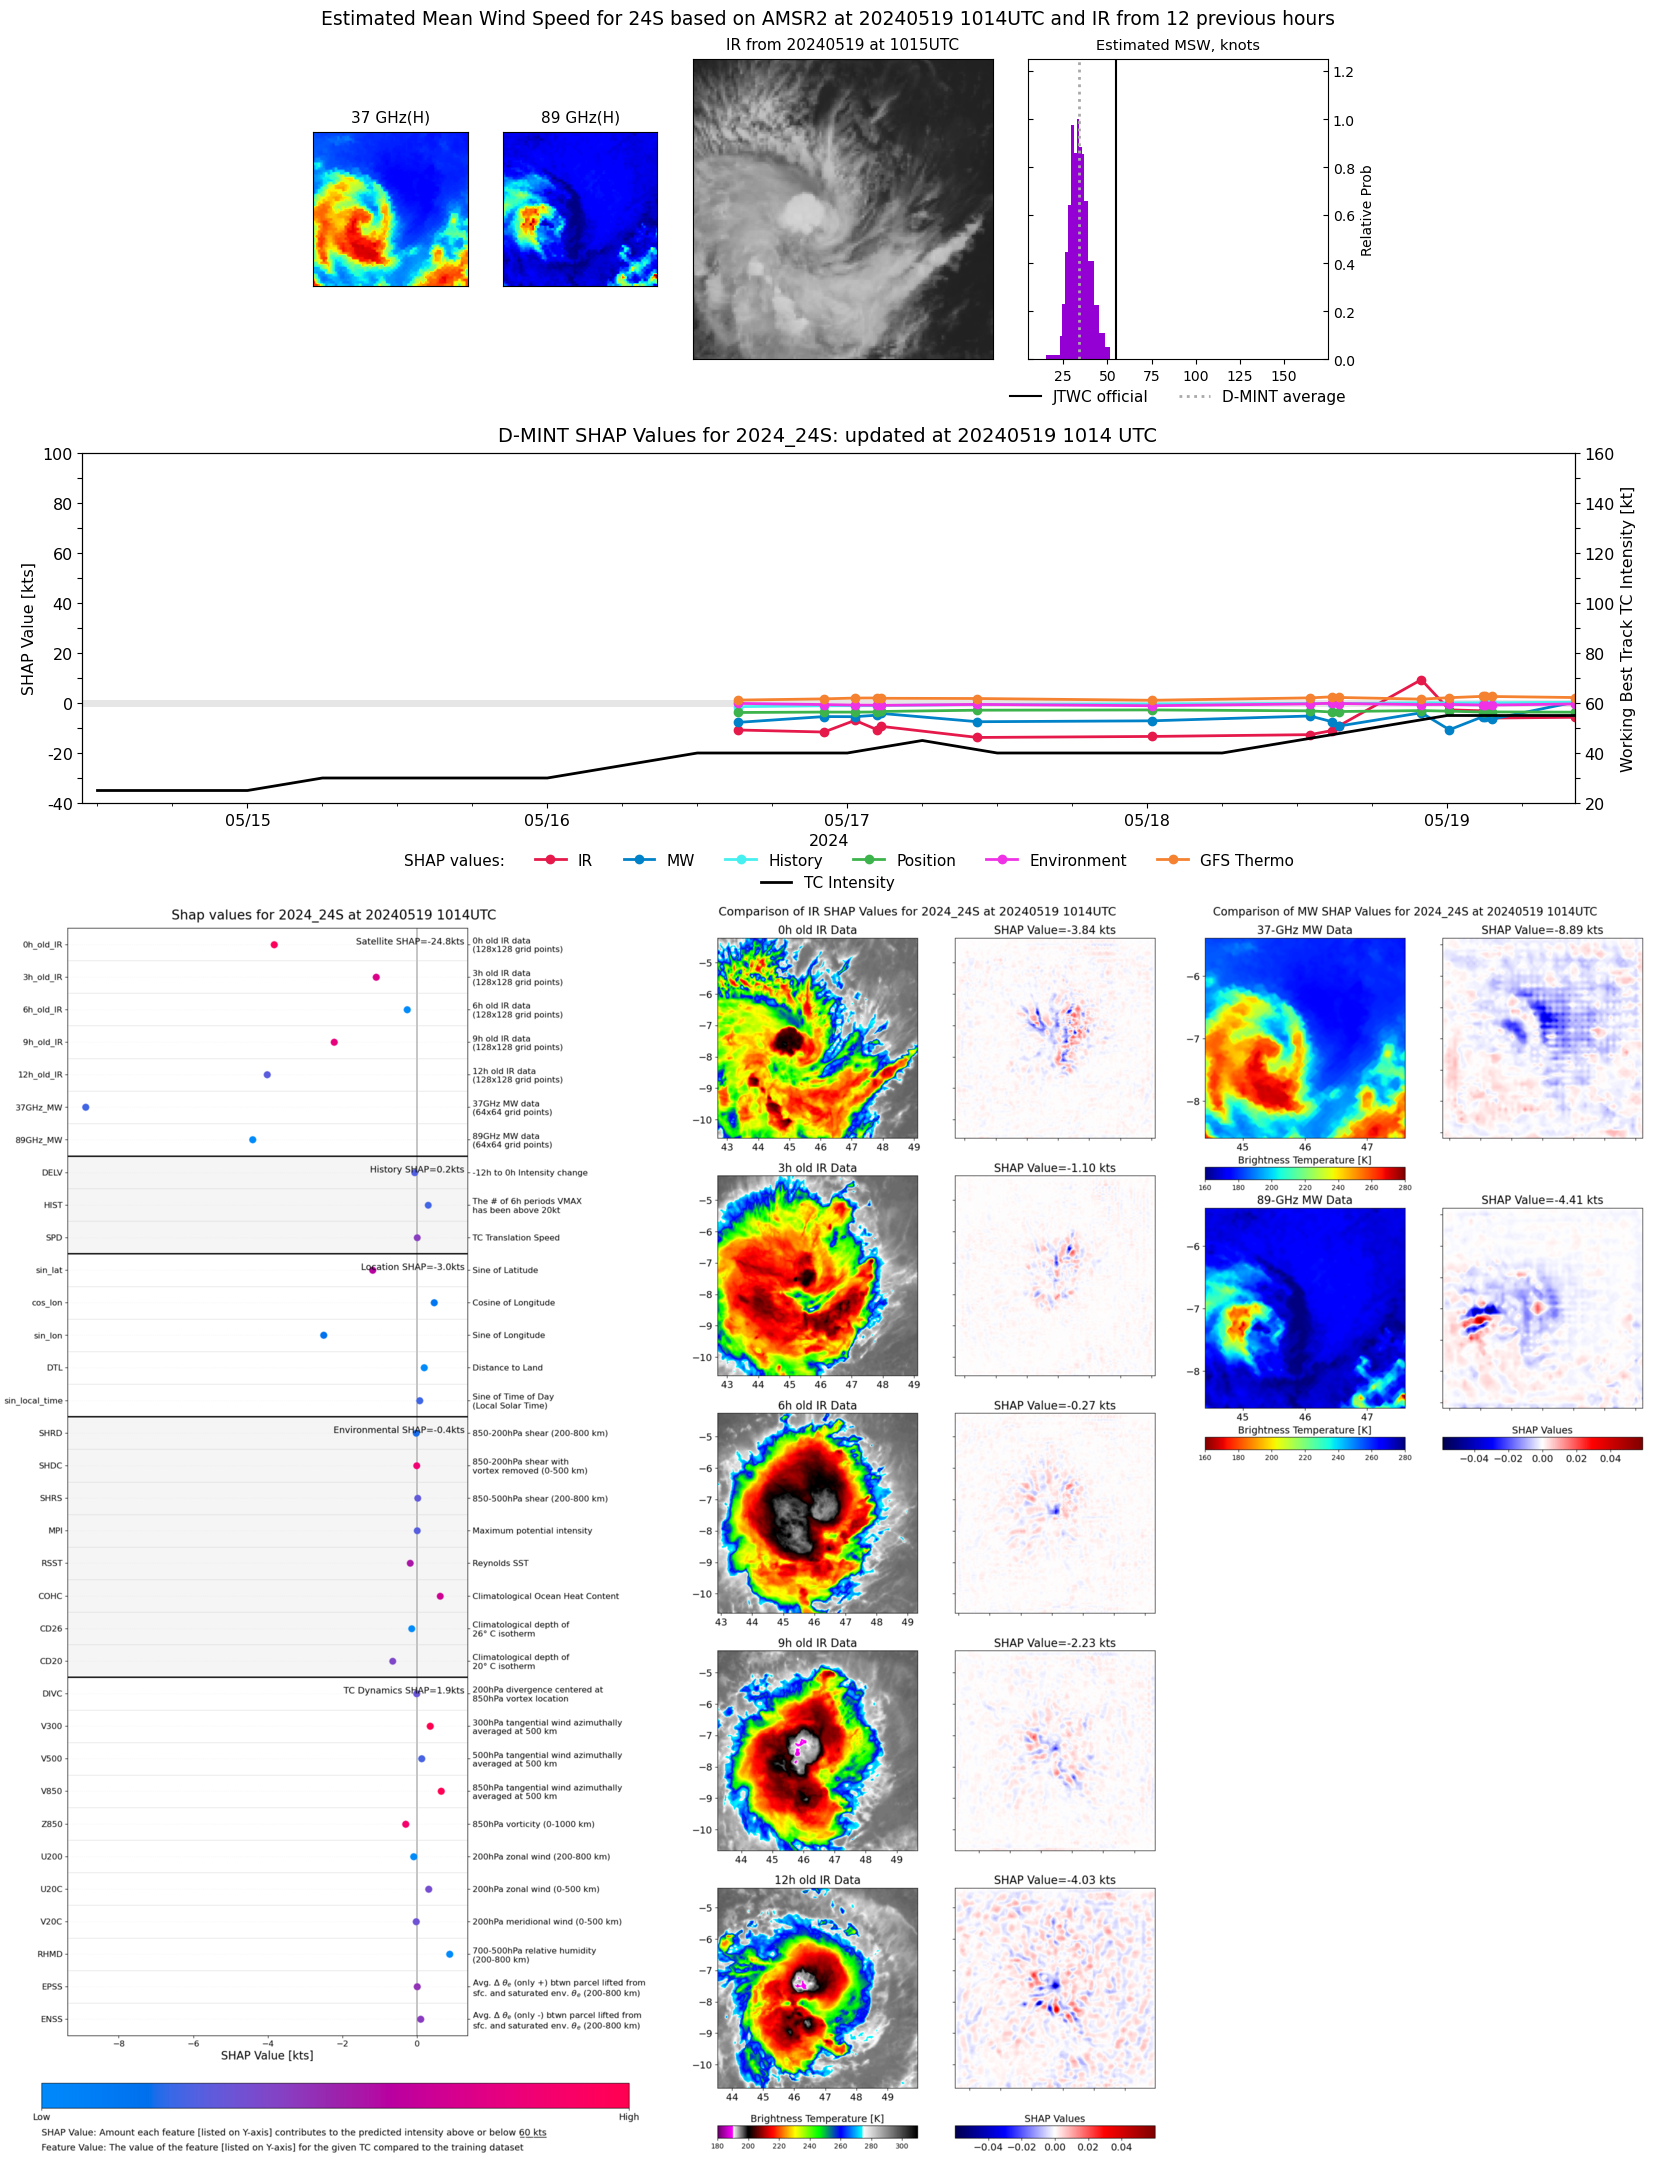 |
| 20240519 | 0334 UTC | SSMISF17 | 986 hPa | 46 kts | 40 kts | 52 kts |  |
| 20240519 | 0300 UTC | GMI | 986 hPa | 49 kts | 43 kts | 56 kts |  |
| 20240519 | 0253 UTC | GMI | 988 hPa | 50 kts | 44 kts | 56 kts | 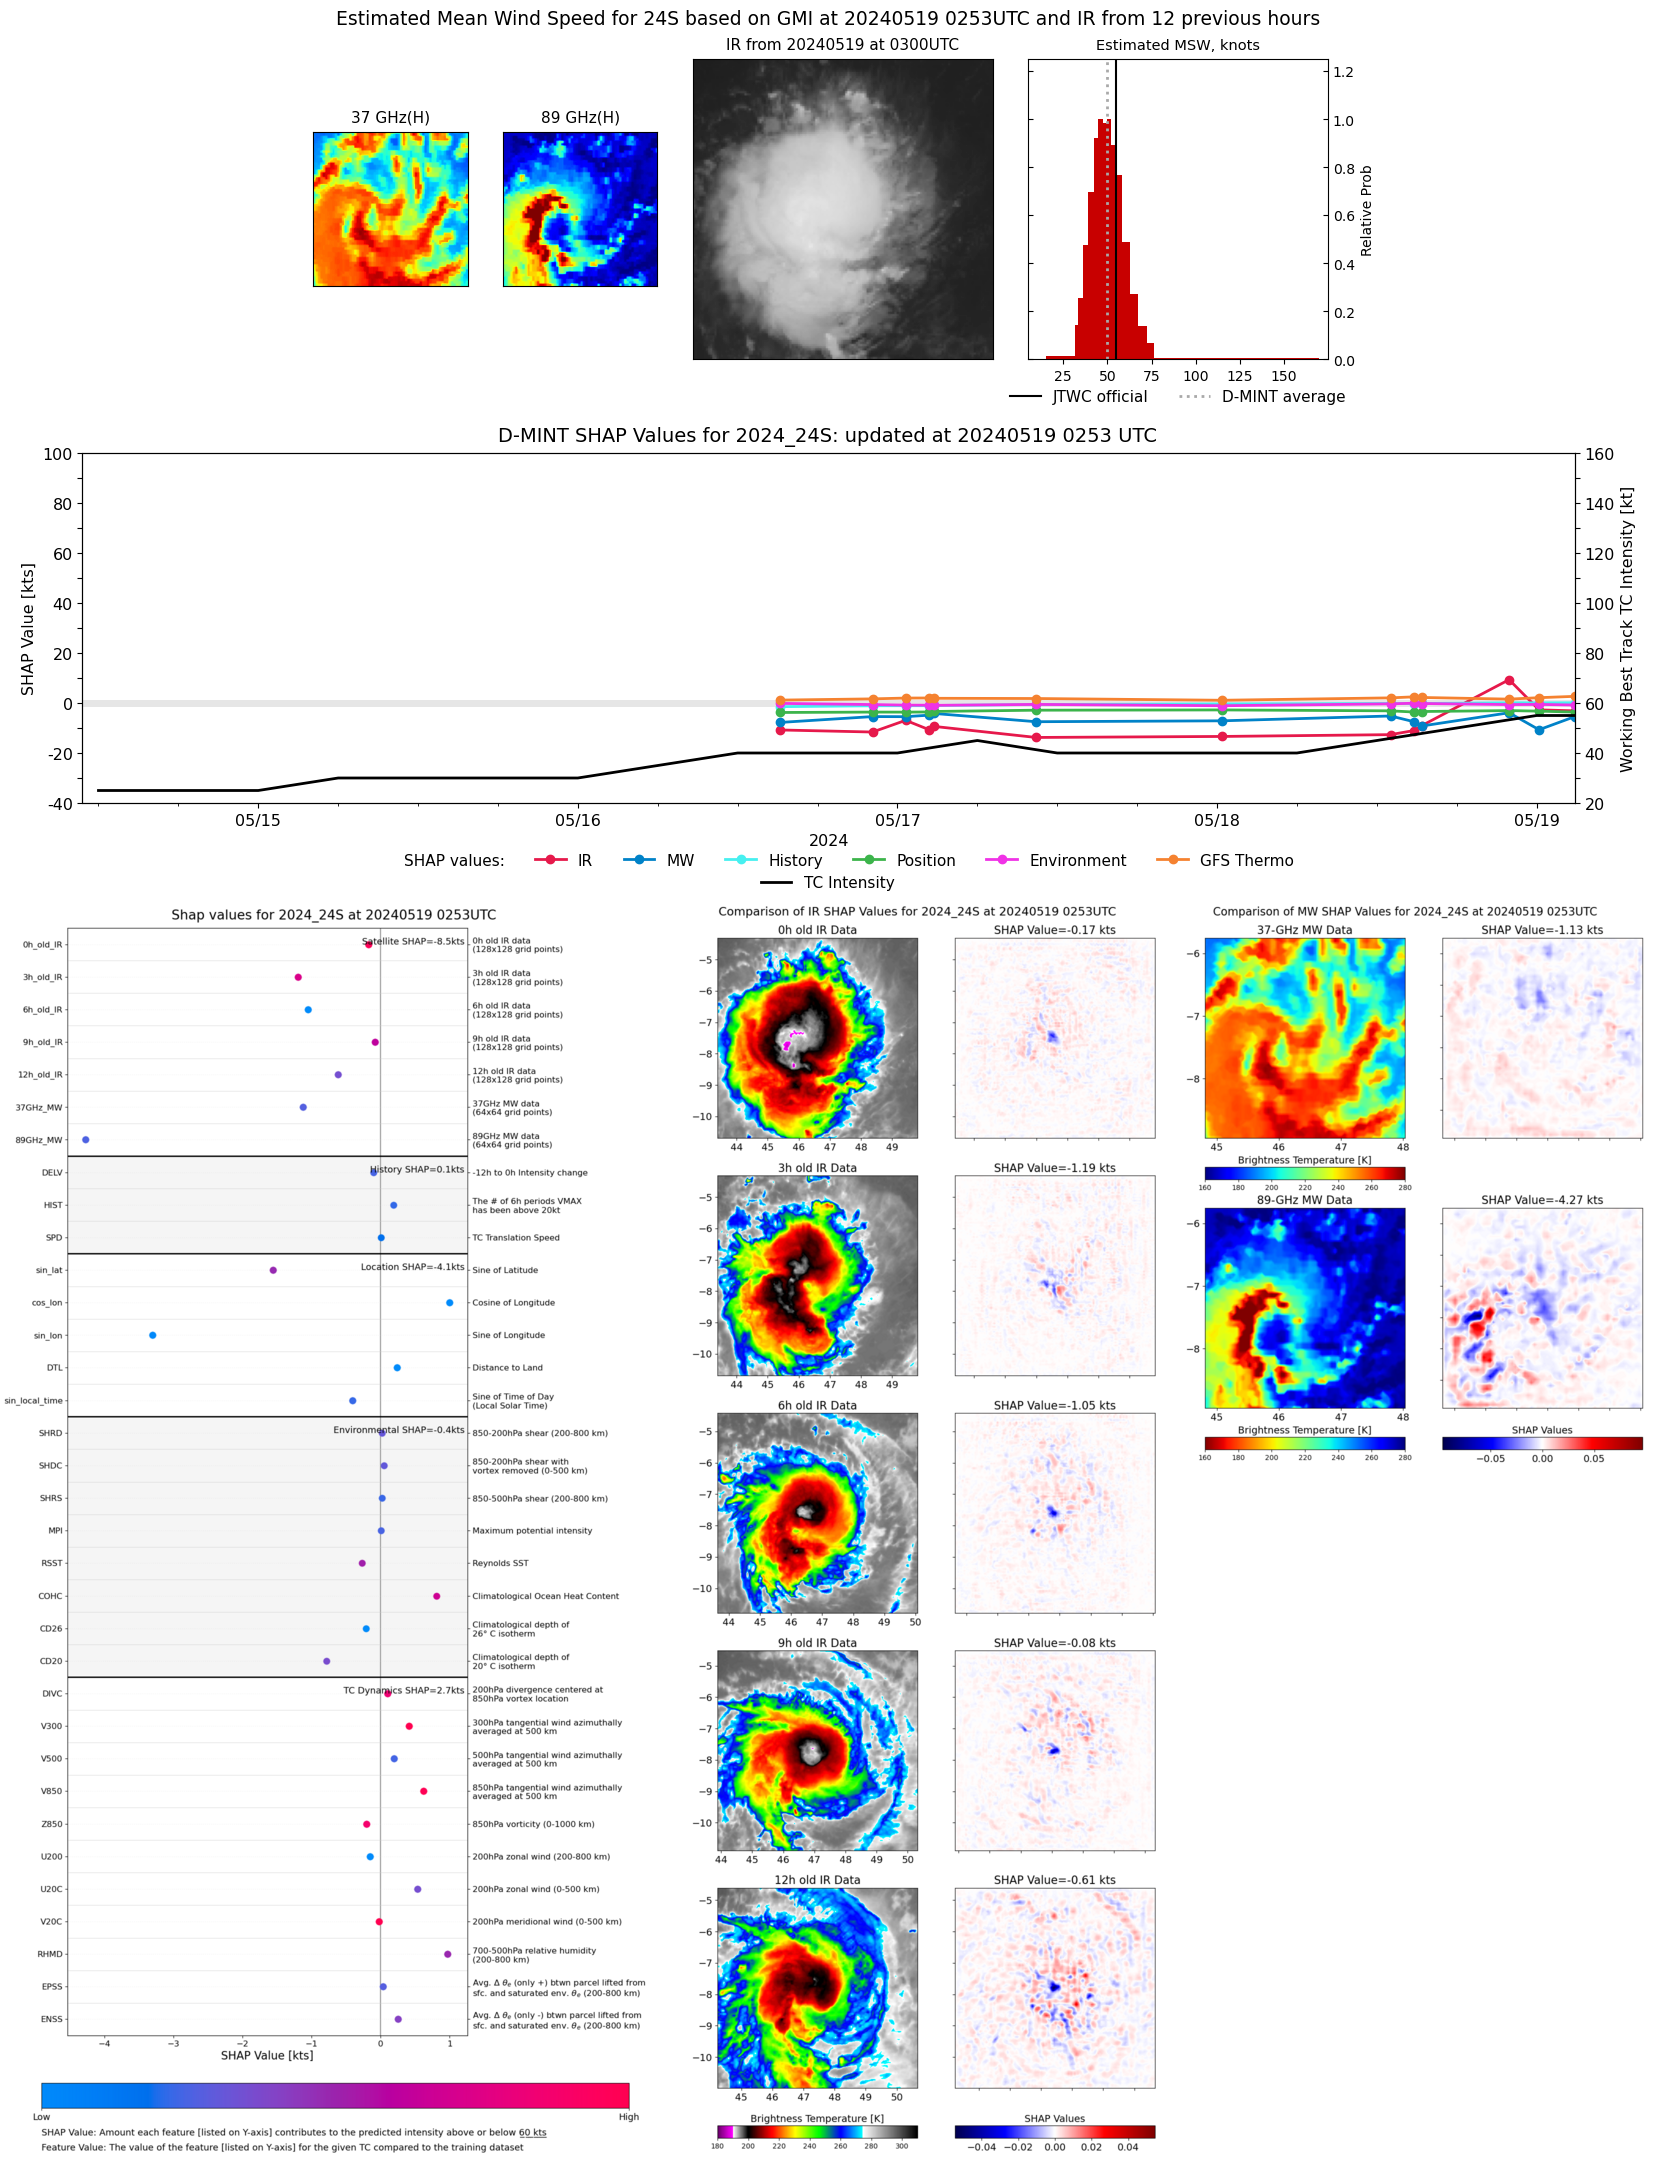 |
| 20240519 | 0011 UTC | SSMISF18 | 989 hPa | 45 kts | 39 kts | 51 kts |  |
| 20240518 | 2156 UTC | AMSR2 | 984 hPa | 59 kts | 53 kts | 66 kts | 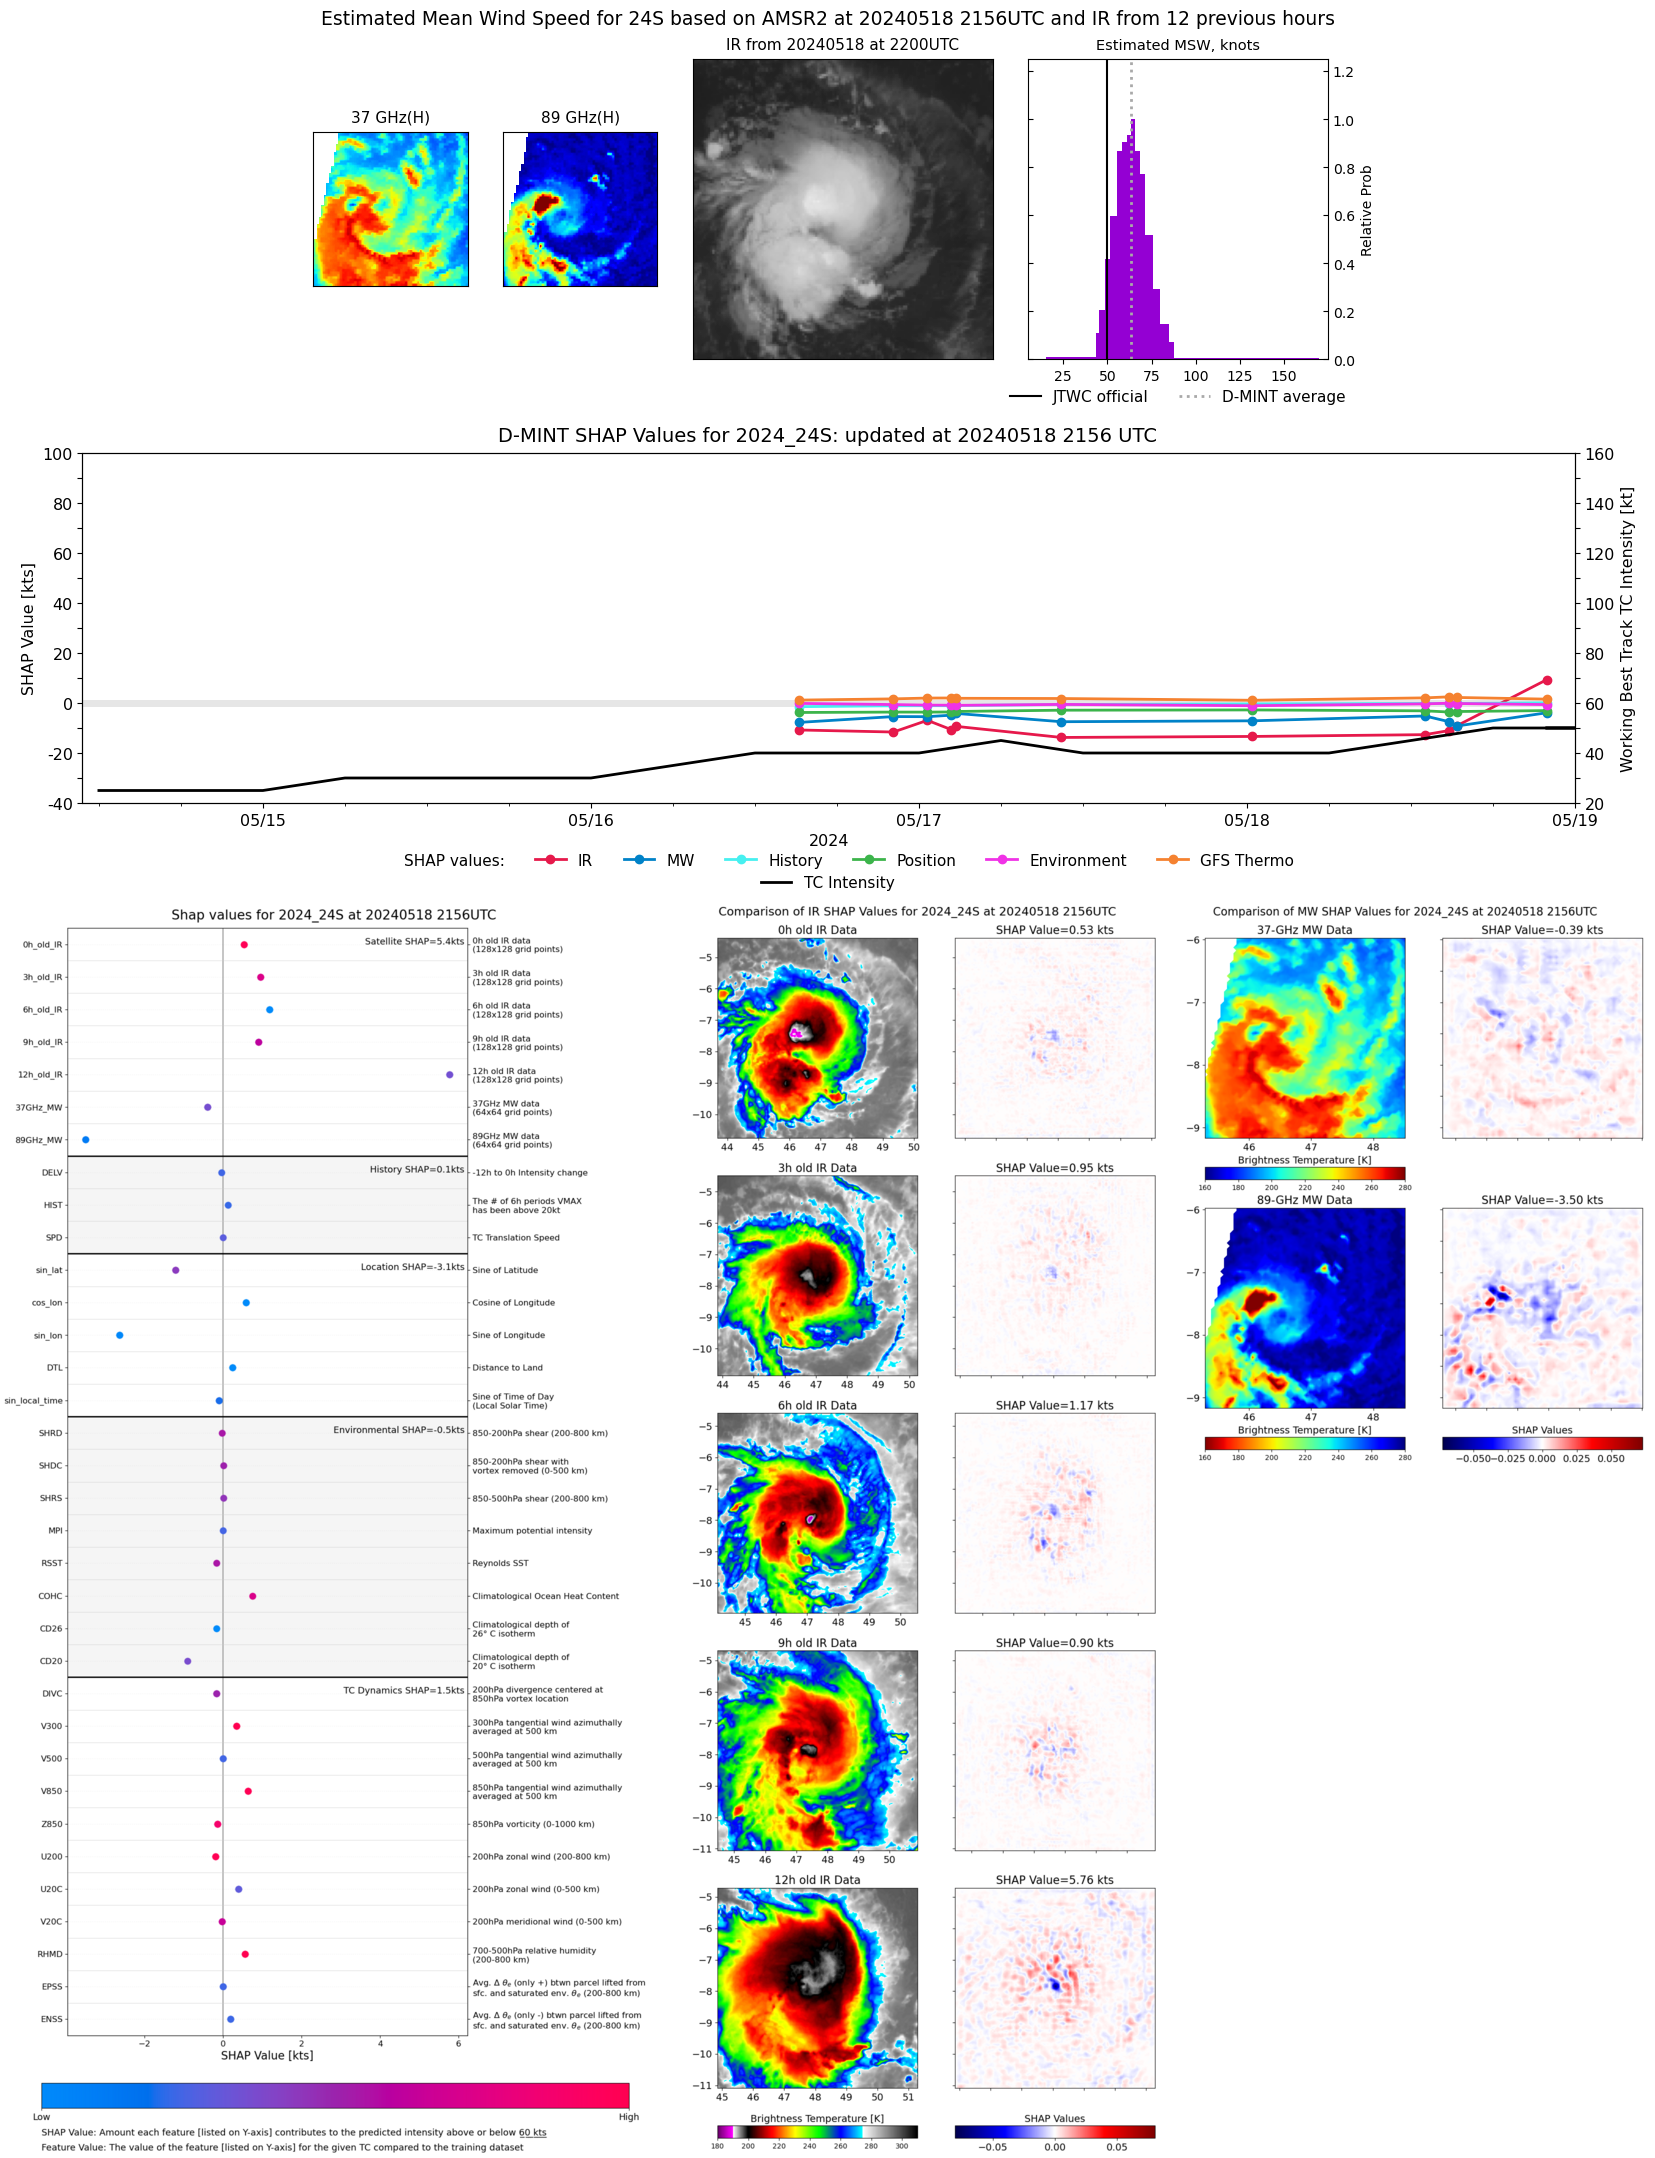 |
| 20240518 | 1523 UTC | GMI | 996 hPa | 40 kts | 36 kts | 45 kts | 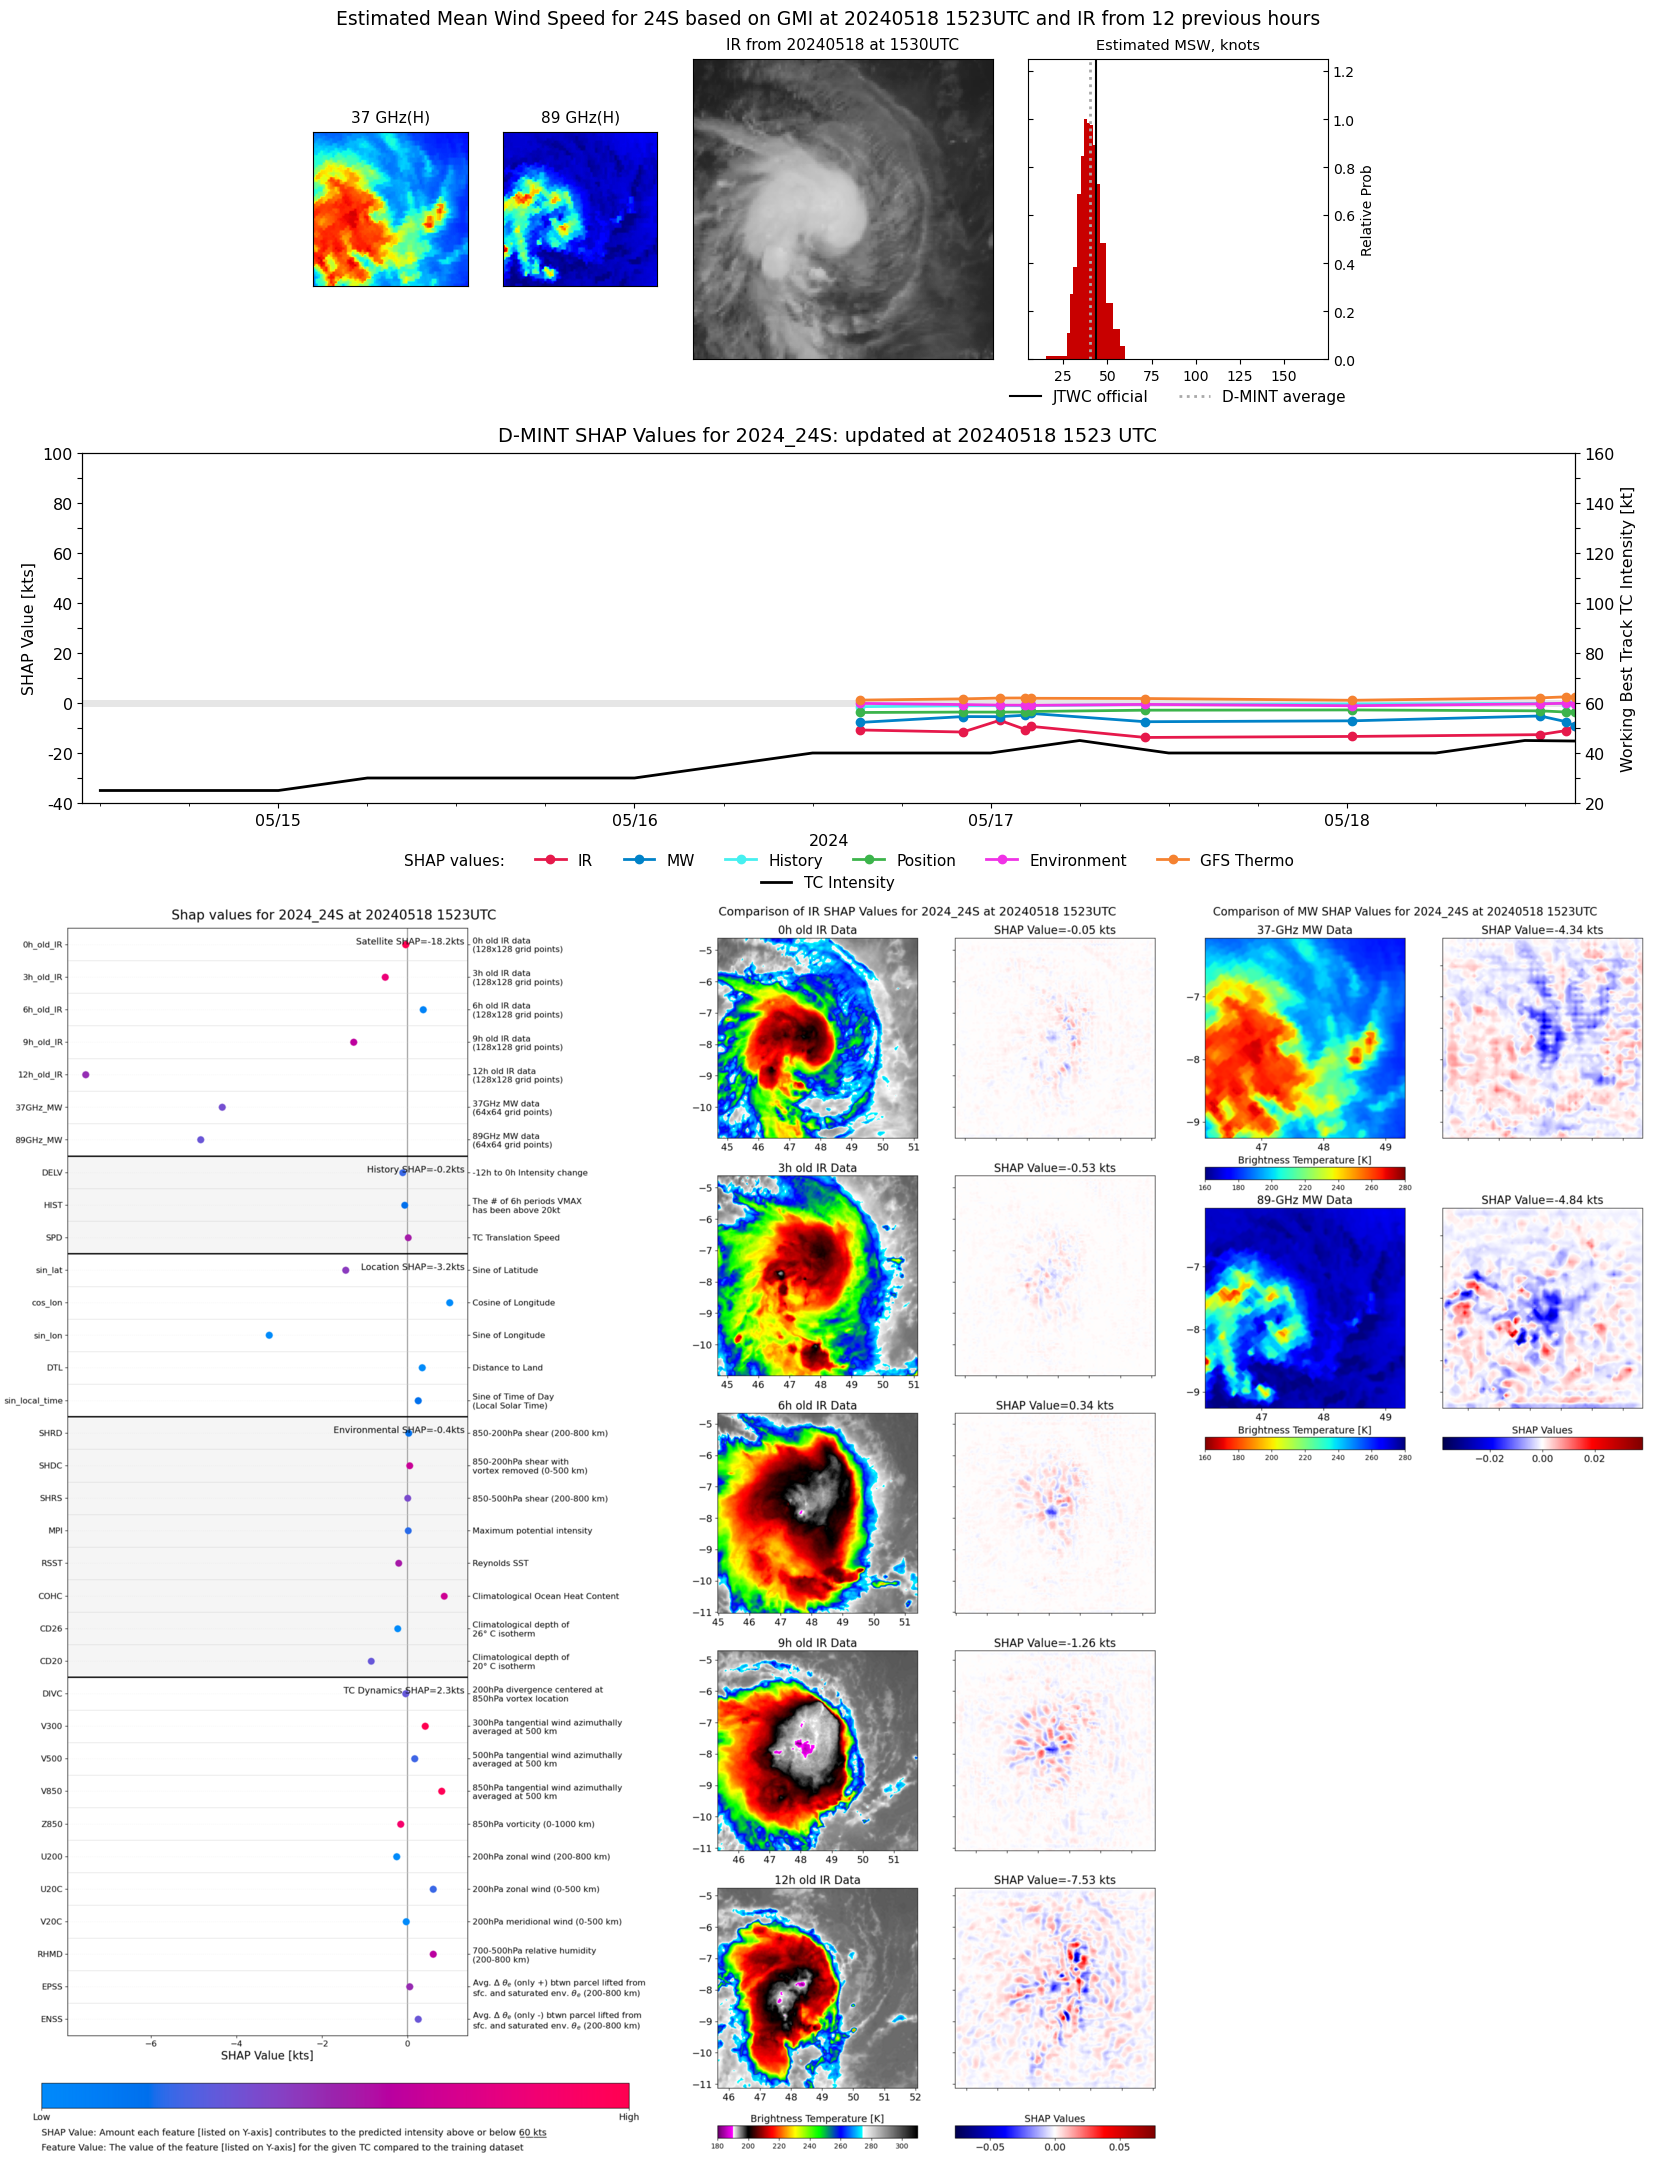 |
| 20240518 | 1503 UTC | SSMISF16 | 994 hPa | 34 kts | 30 kts | 39 kts | 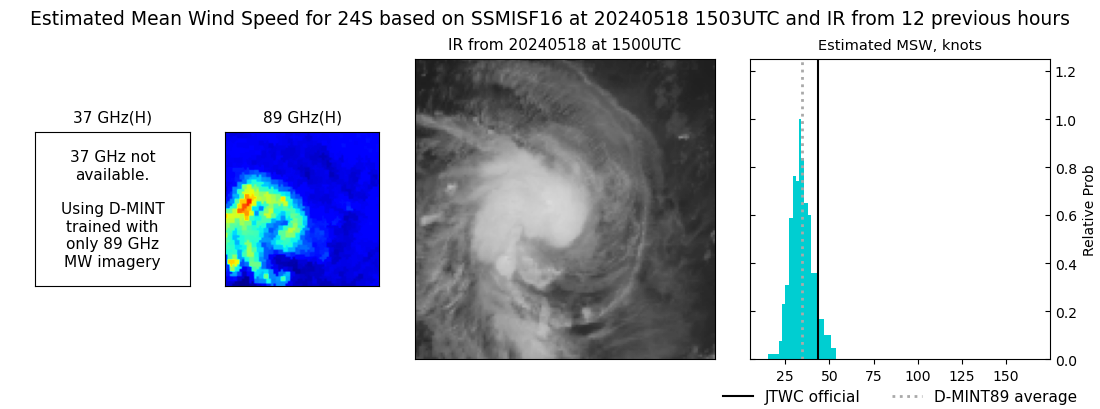 |
| 20240518 | 1446 UTC | SSMISF17 | 996 hPa | 40 kts | 35 kts | 45 kts |  |
| 20240518 | 1302 UTC | SSMISF18 | 993 hPa | 41 kts | 36 kts | 45 kts |  |
| 20240518 | 0224 UTC | SSMISF16 | 998 hPa | 35 kts | 31 kts | 39 kts | 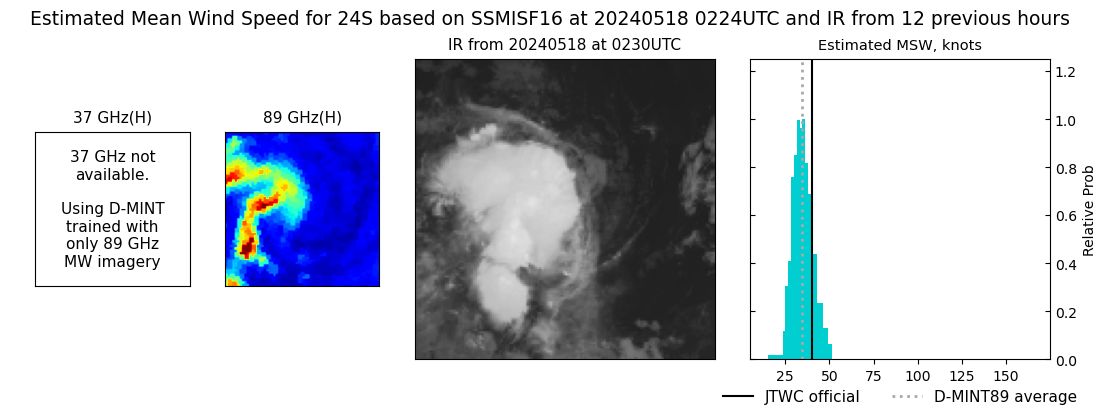 |
| 20240518 | 0023 UTC | SSMISF18 | 999 hPa | 36 kts | 32 kts | 40 kts | 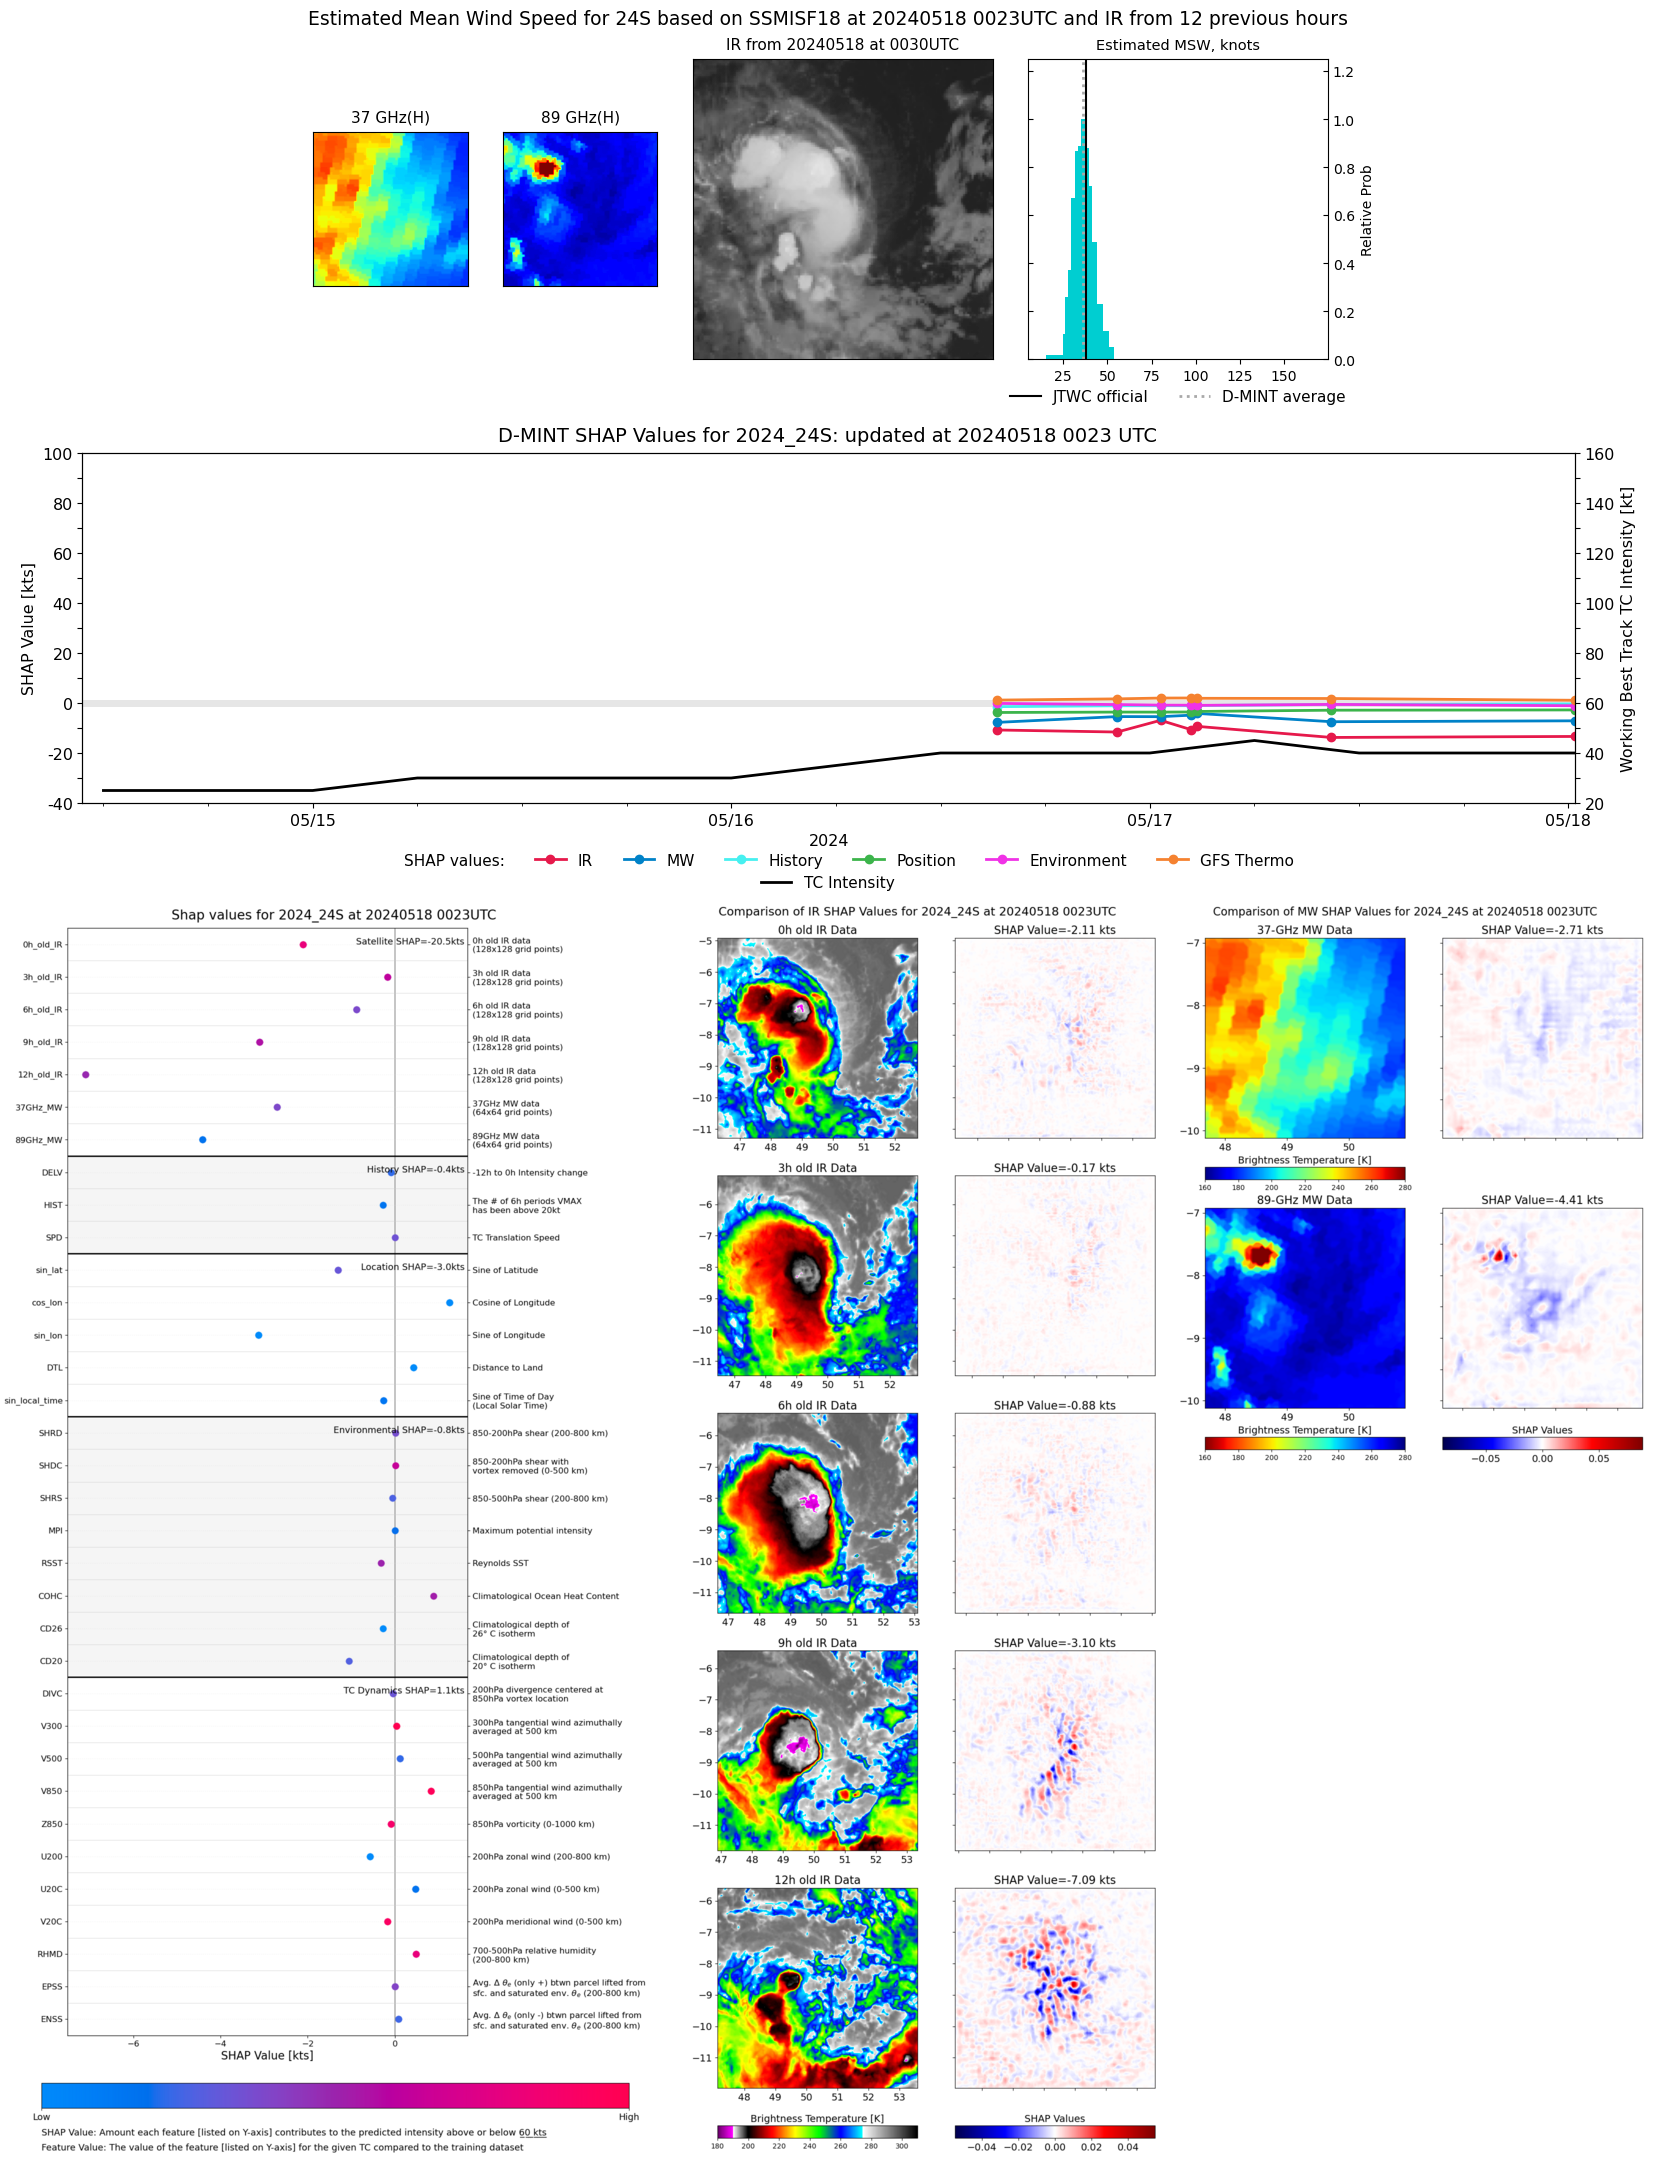 |
| 20240517 | 1025 UTC | AMSR2 | 998 hPa | 36 kts | 33 kts | 41 kts | 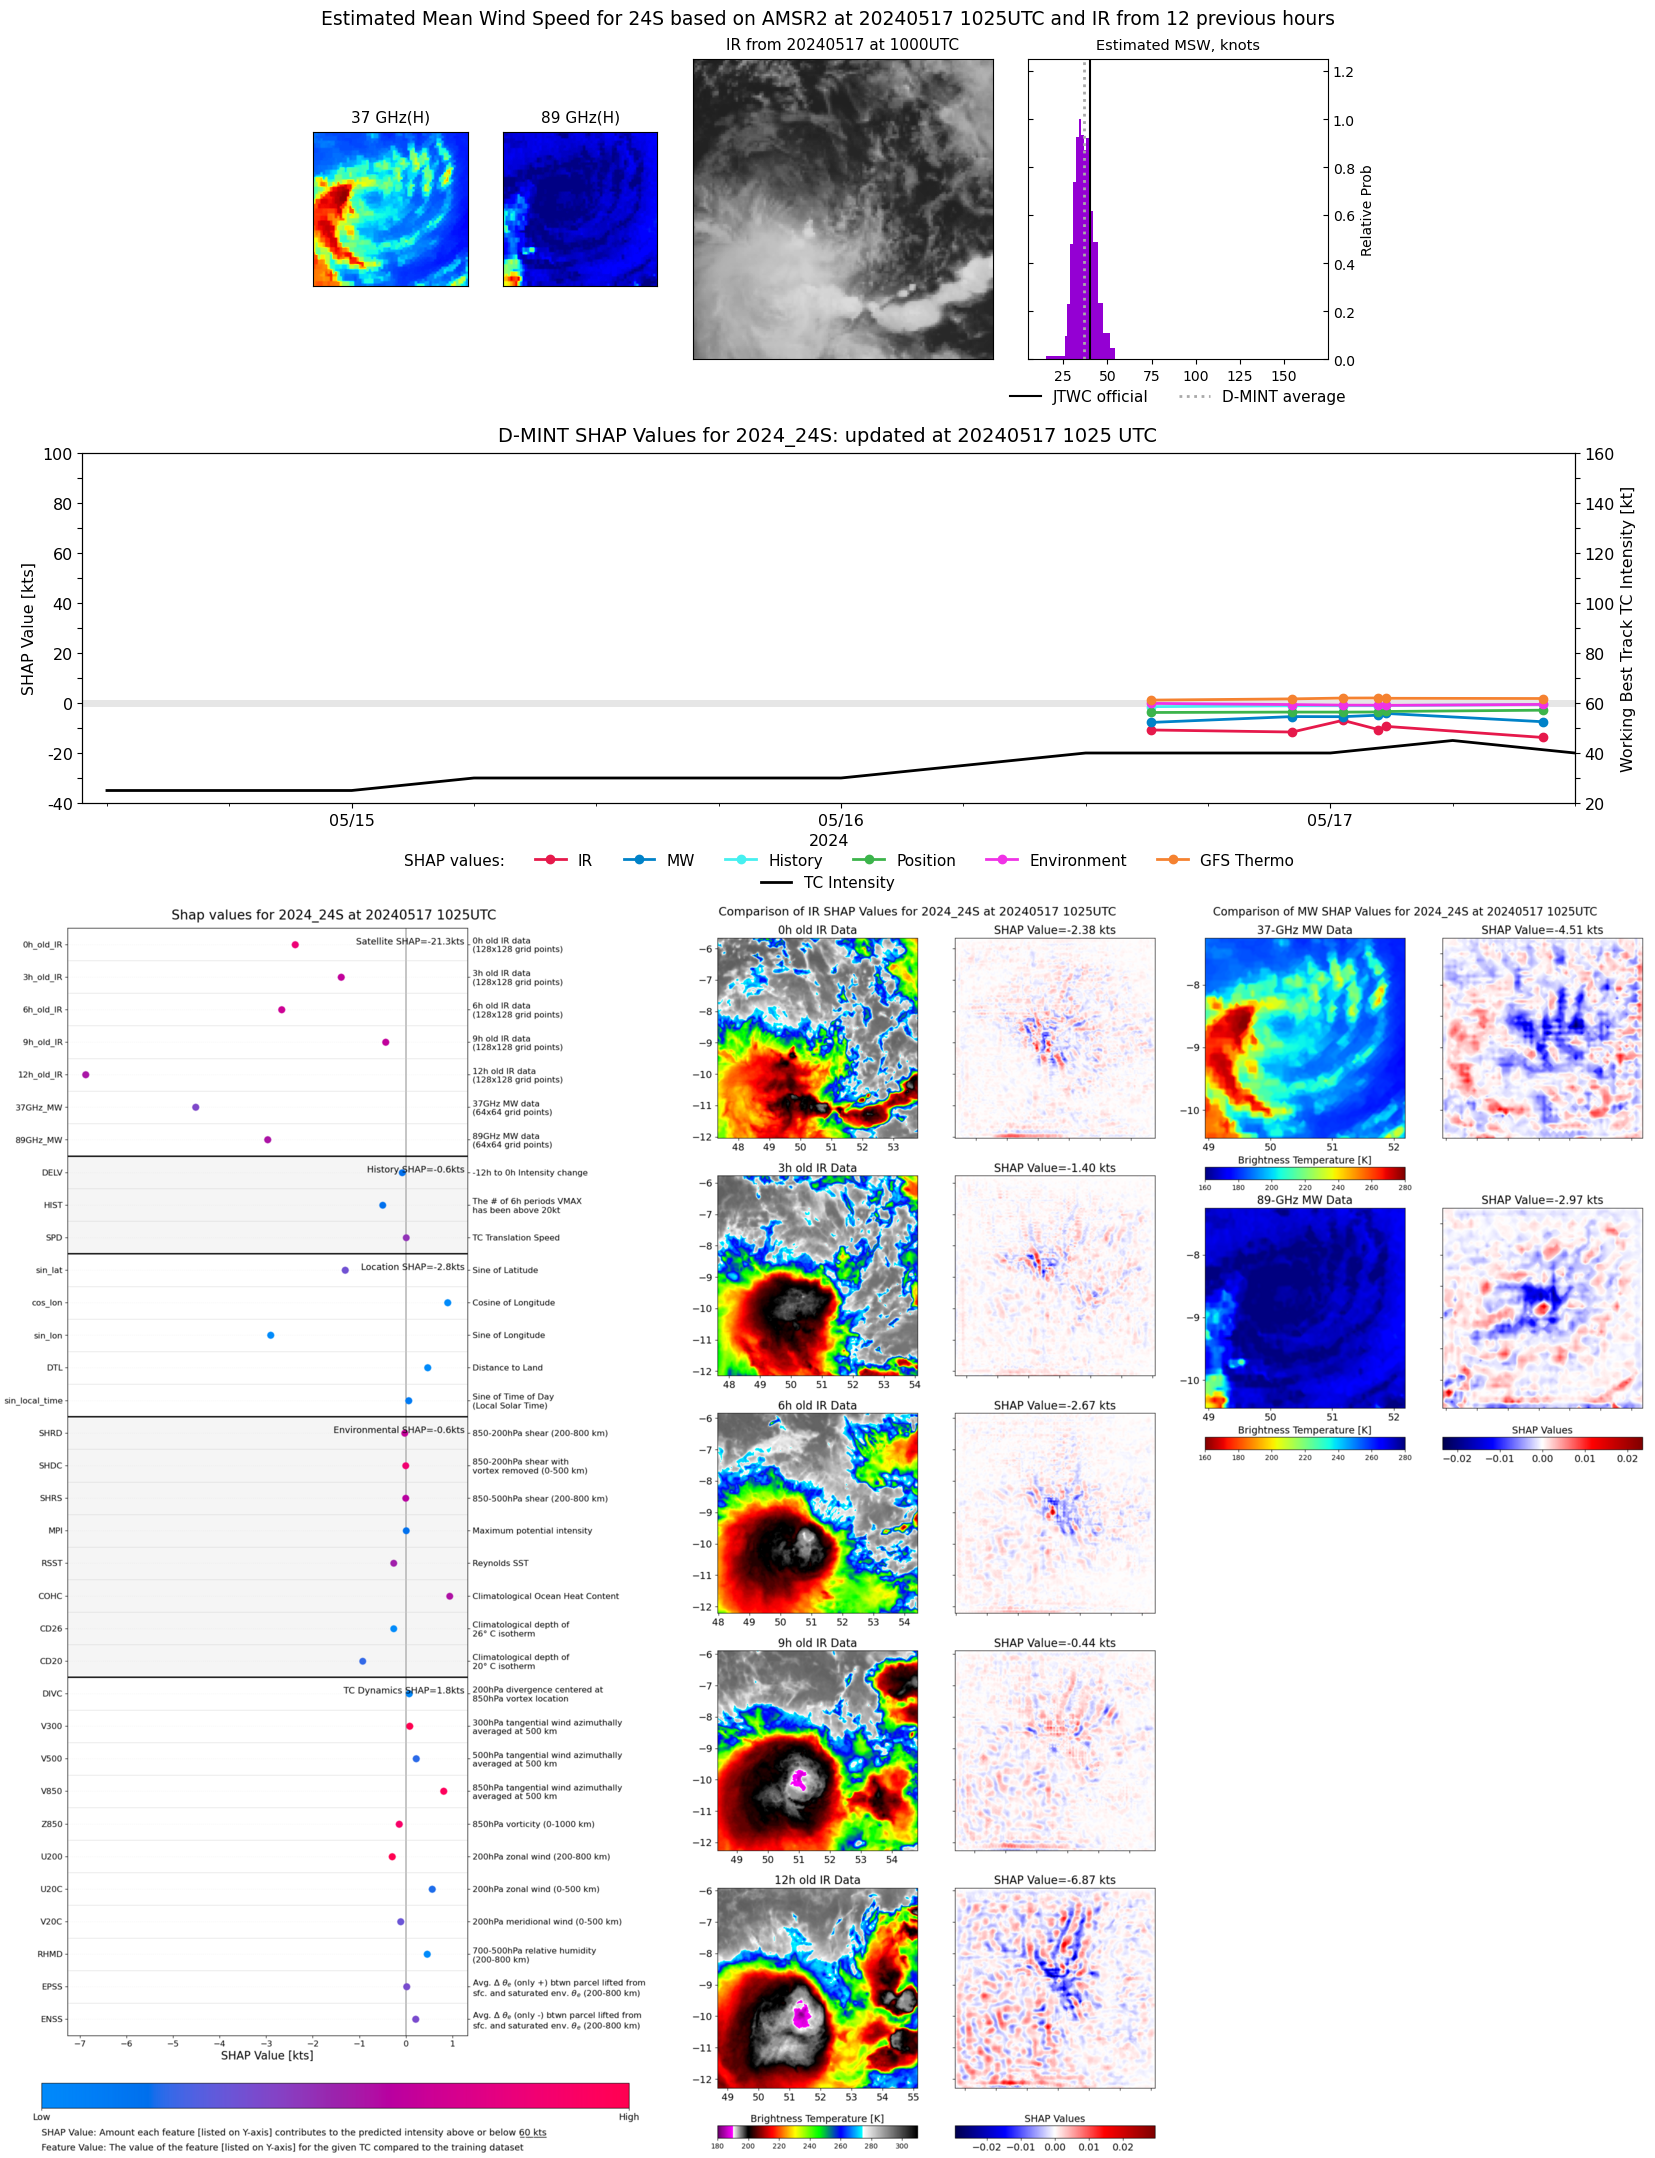 |
| 20240517 | 0243 UTC | GMI | 994 hPa | 42 kts | 38 kts | 47 kts |  |
| 20240517 | 0237 UTC | SSMISF16 | 992 hPa | 39 kts | 34 kts | 44 kts | 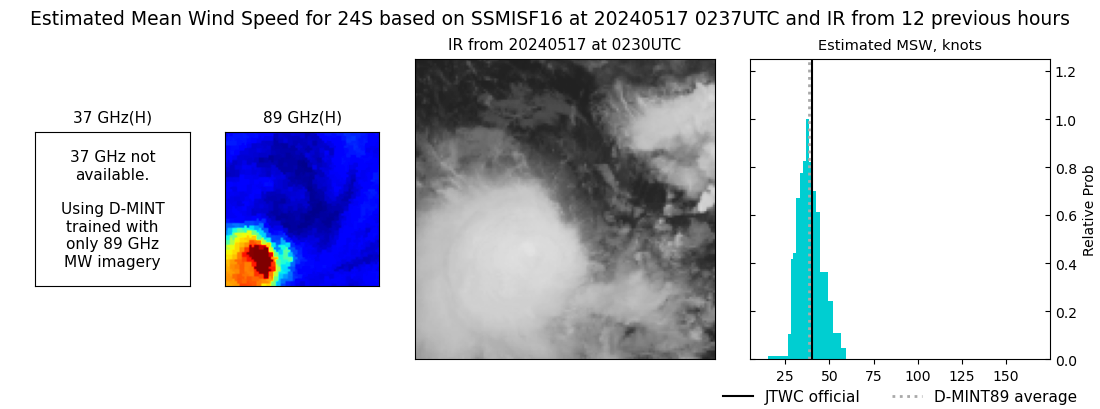 |
| 20240517 | 0221 UTC | SSMISF17 | 994 hPa | 41 kts | 37 kts | 46 kts | 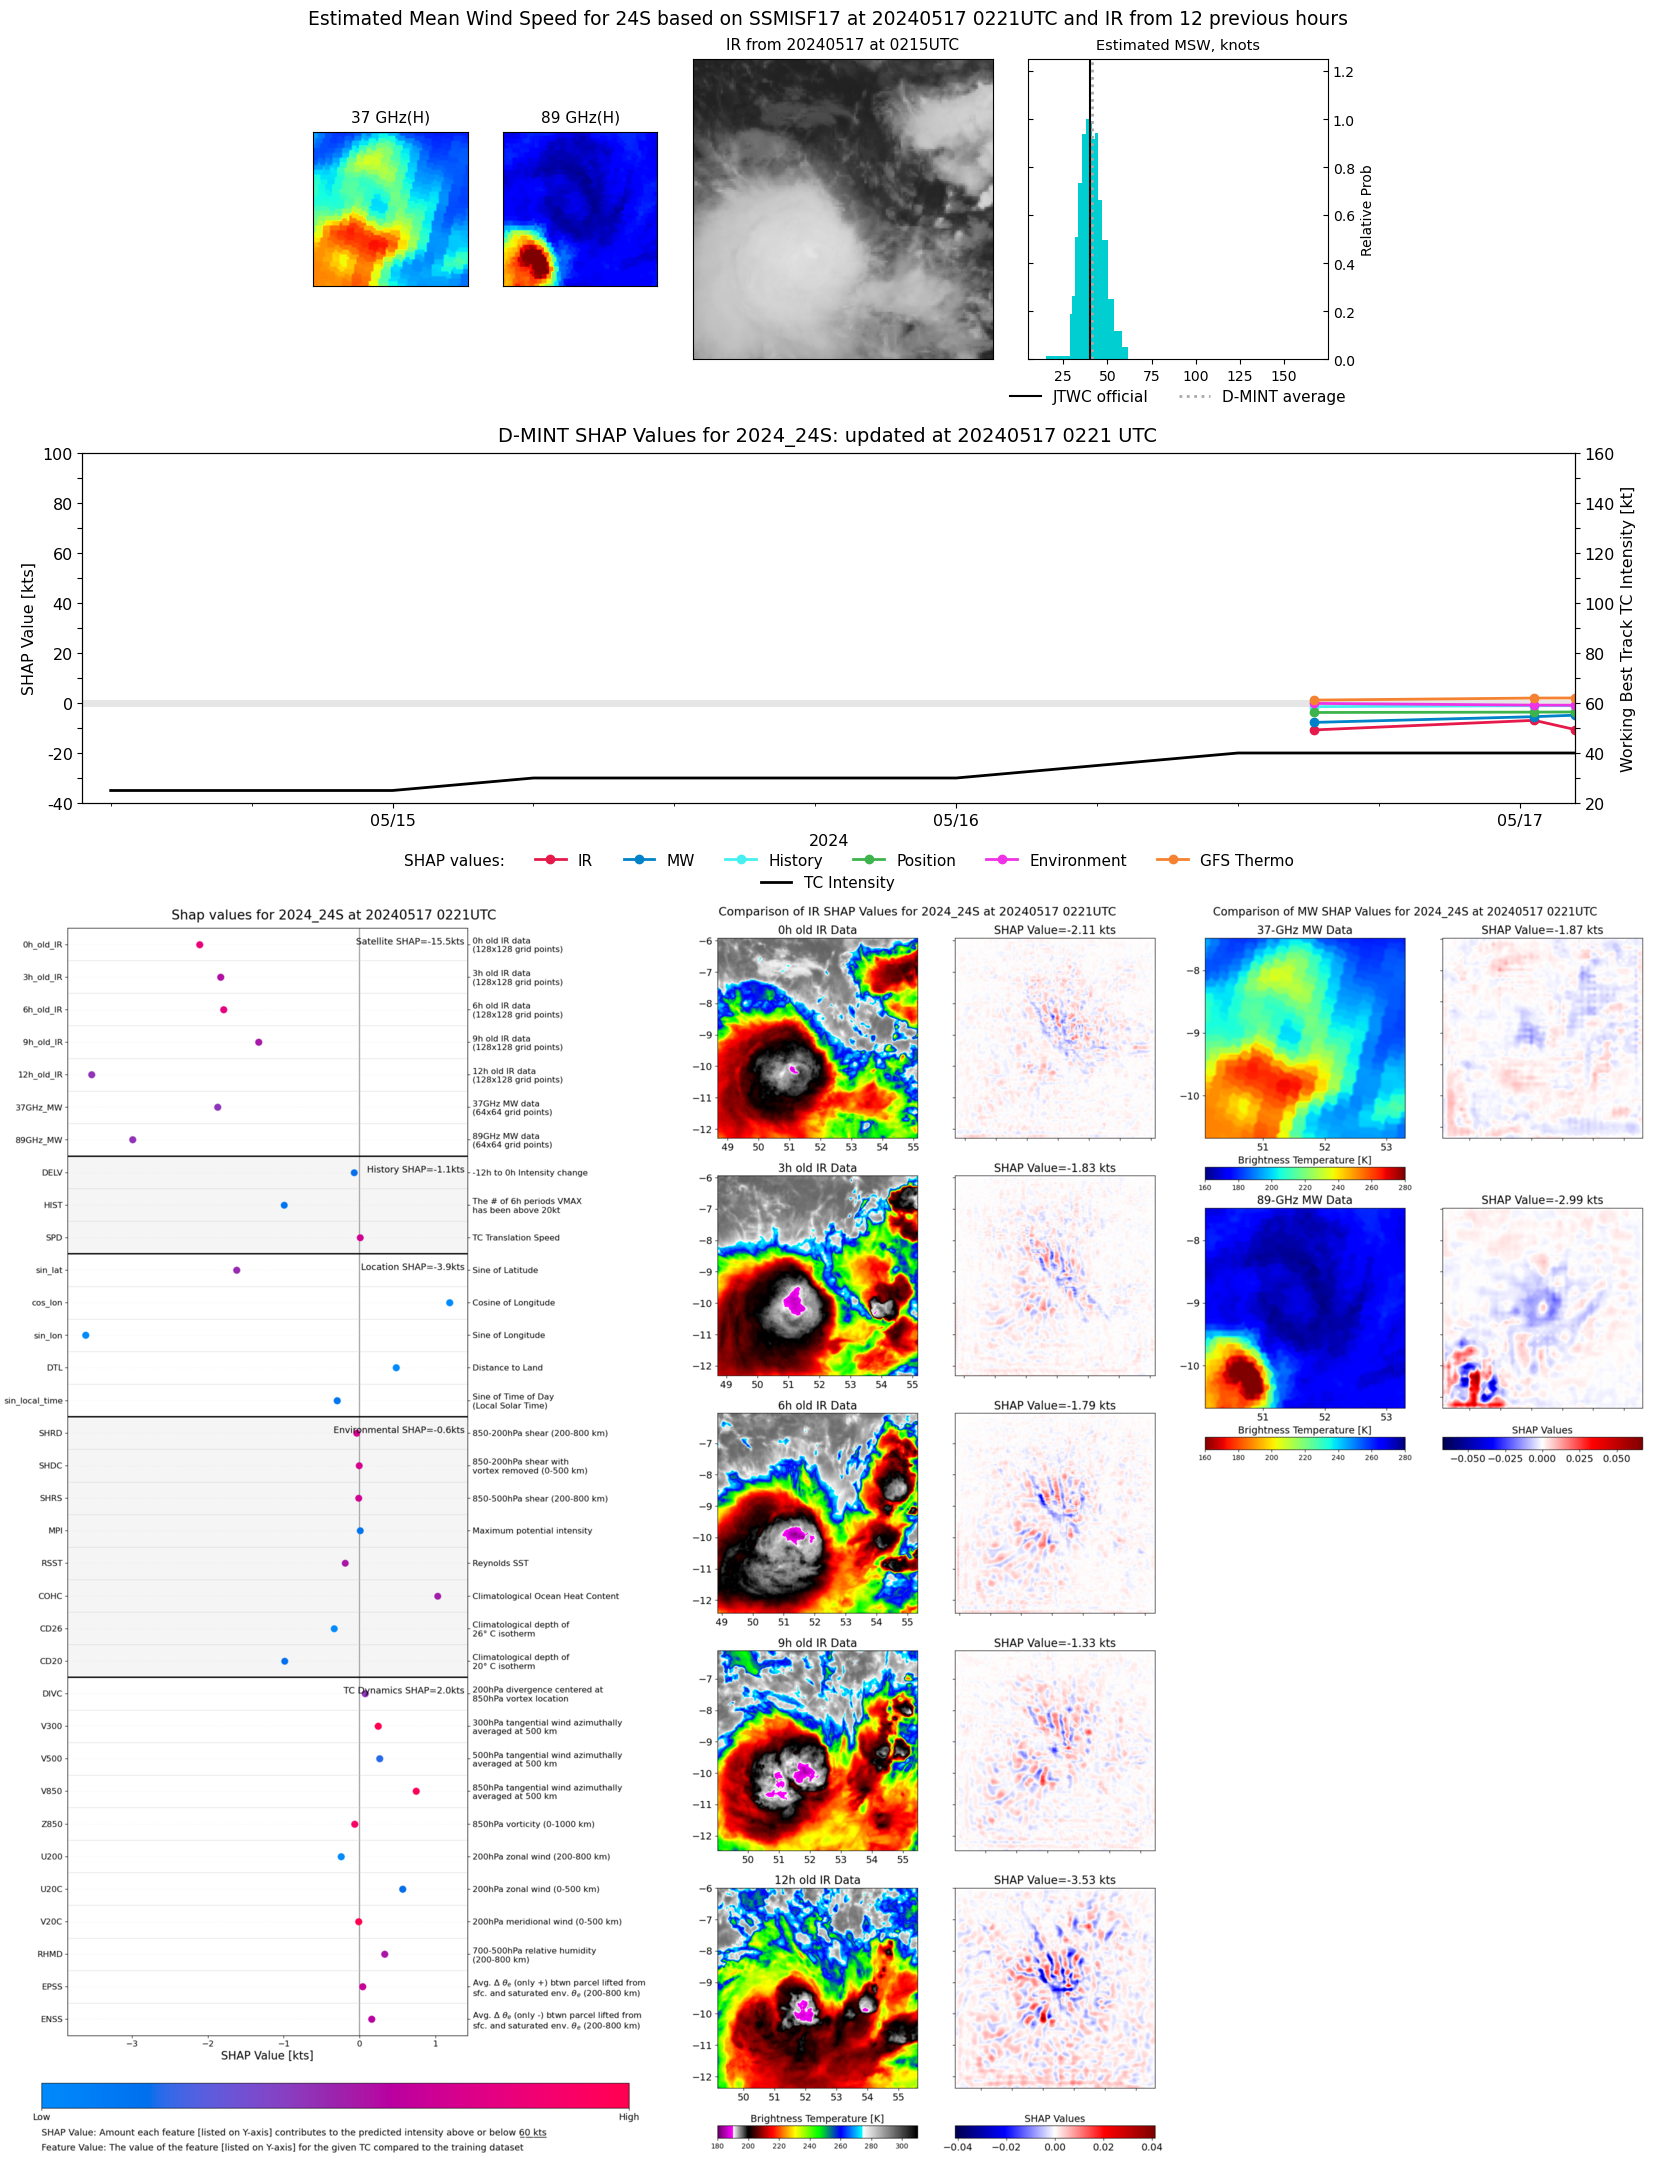 |
| 20240517 | 0037 UTC | SSMISF18 | 992 hPa | 45 kts | 40 kts | 50 kts | 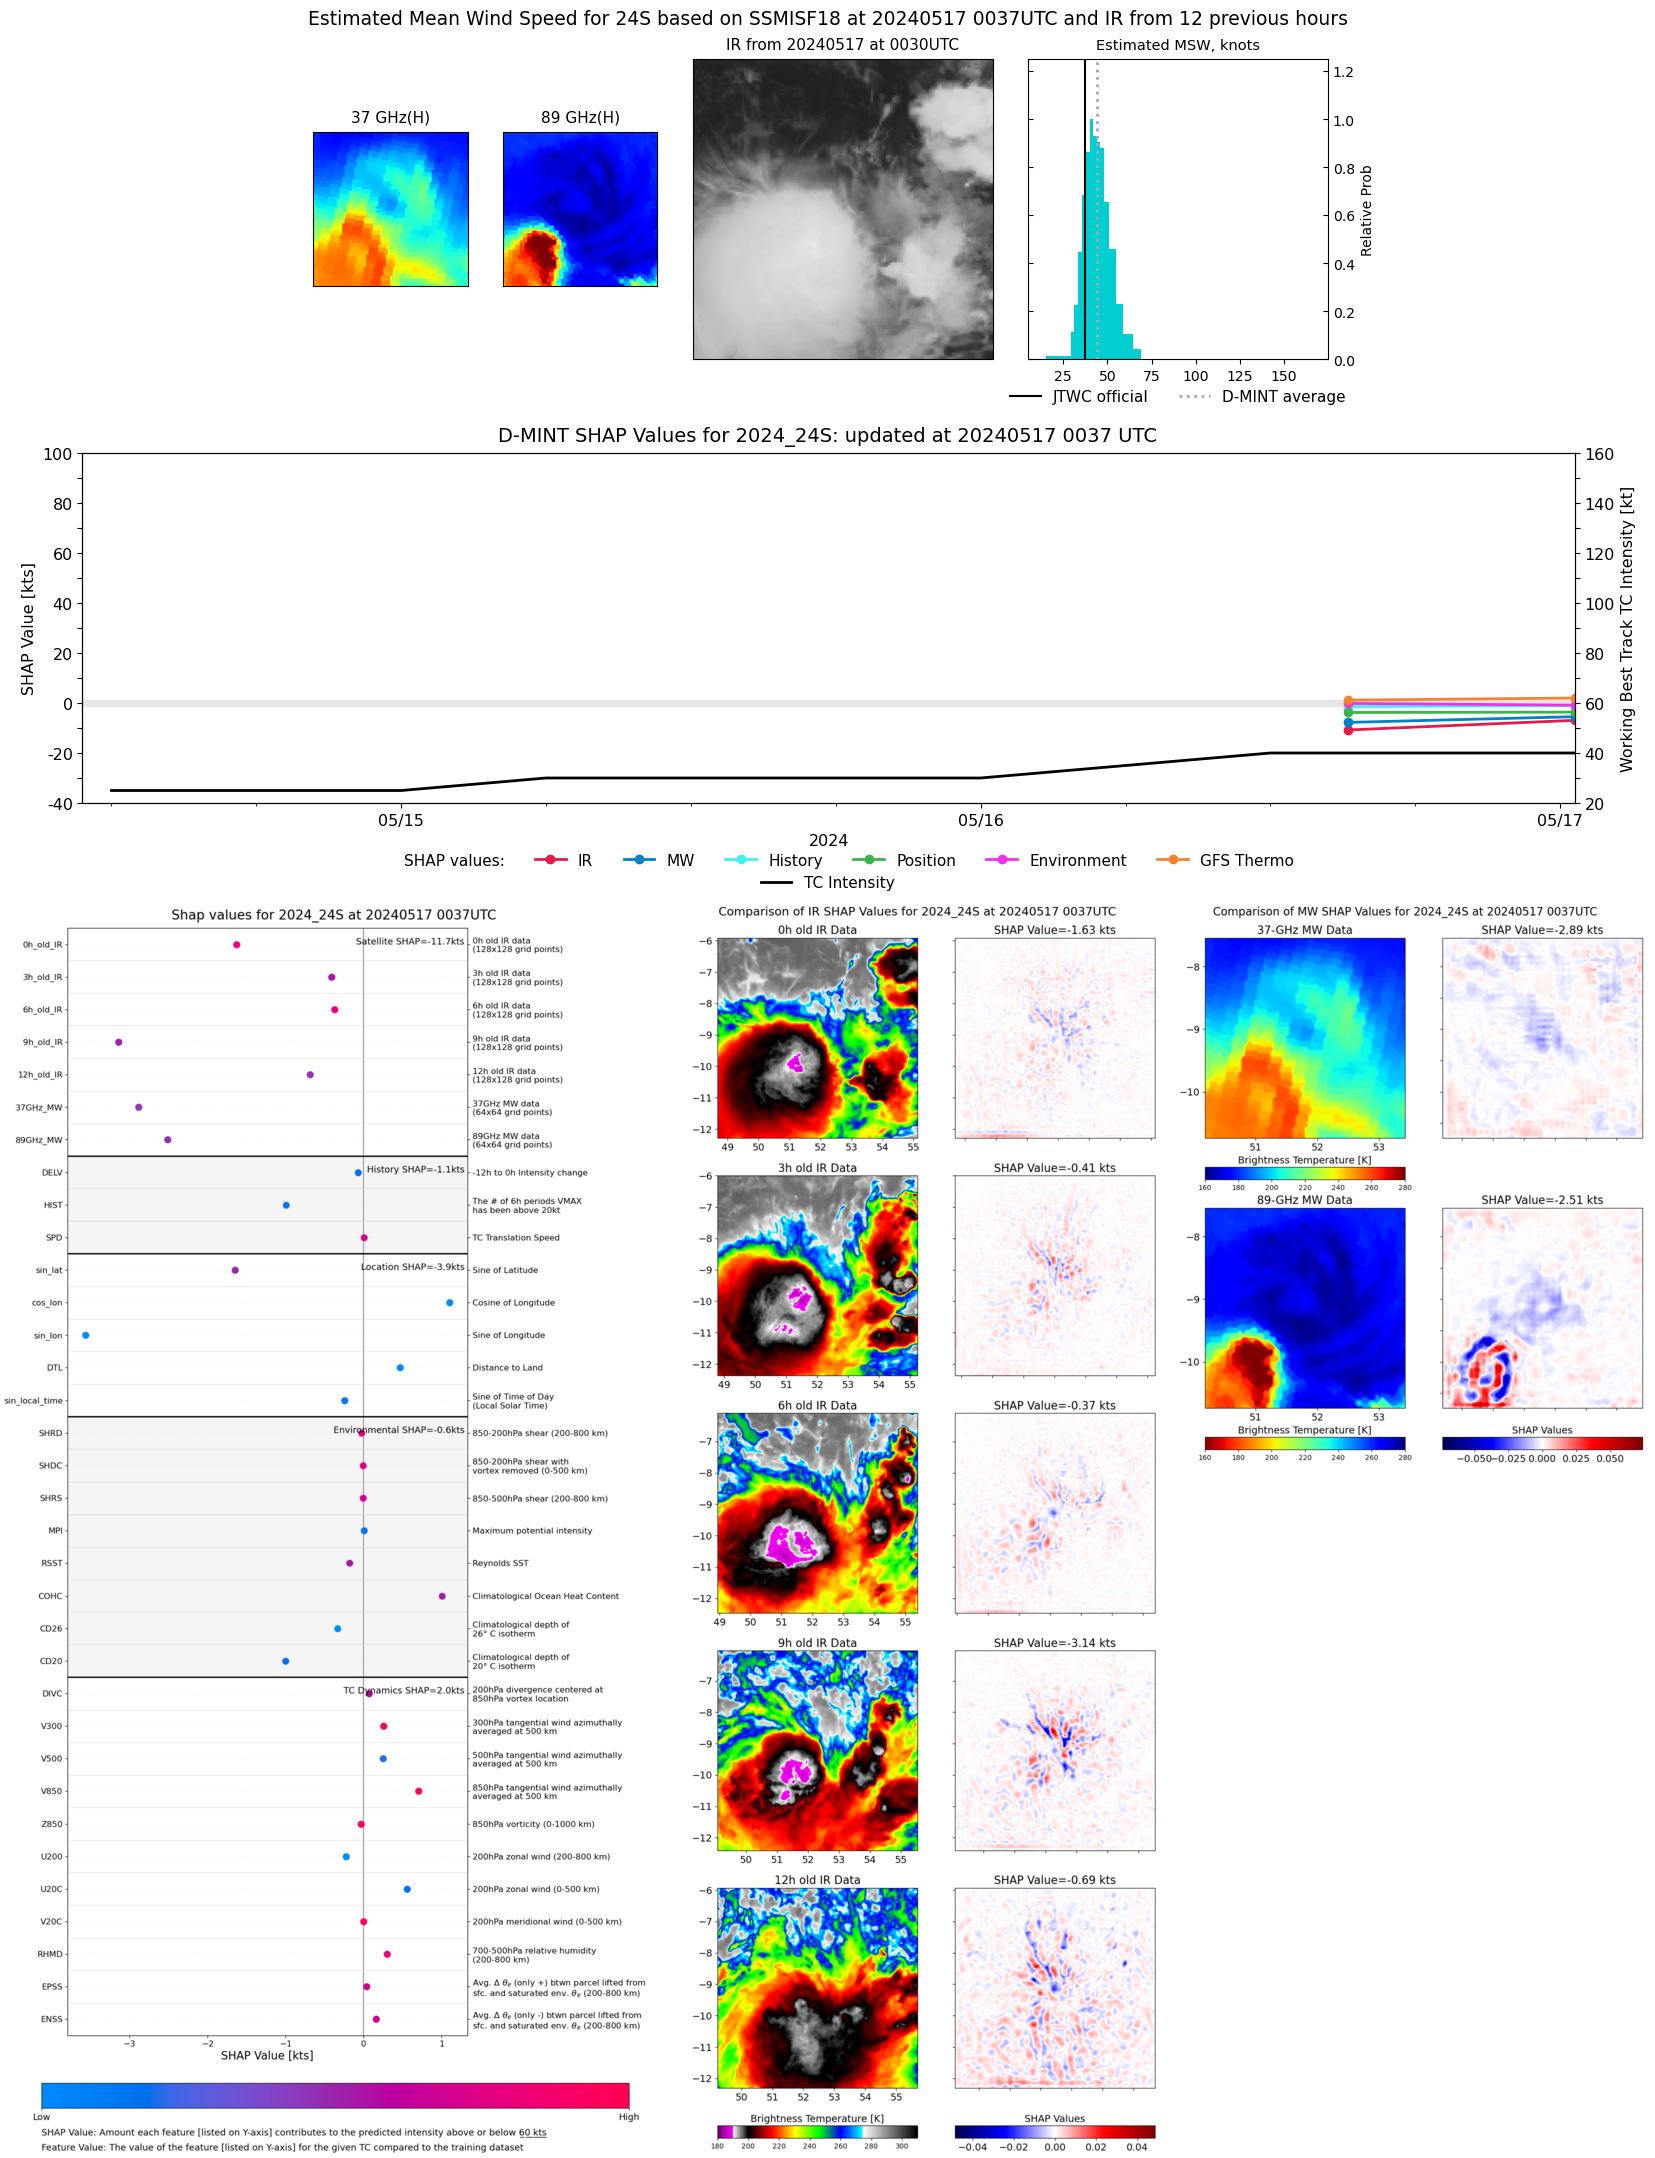 |
| 20240516 | 2208 UTC | AMSR2 | 992 hPa | 39 kts | 35 kts | 44 kts | 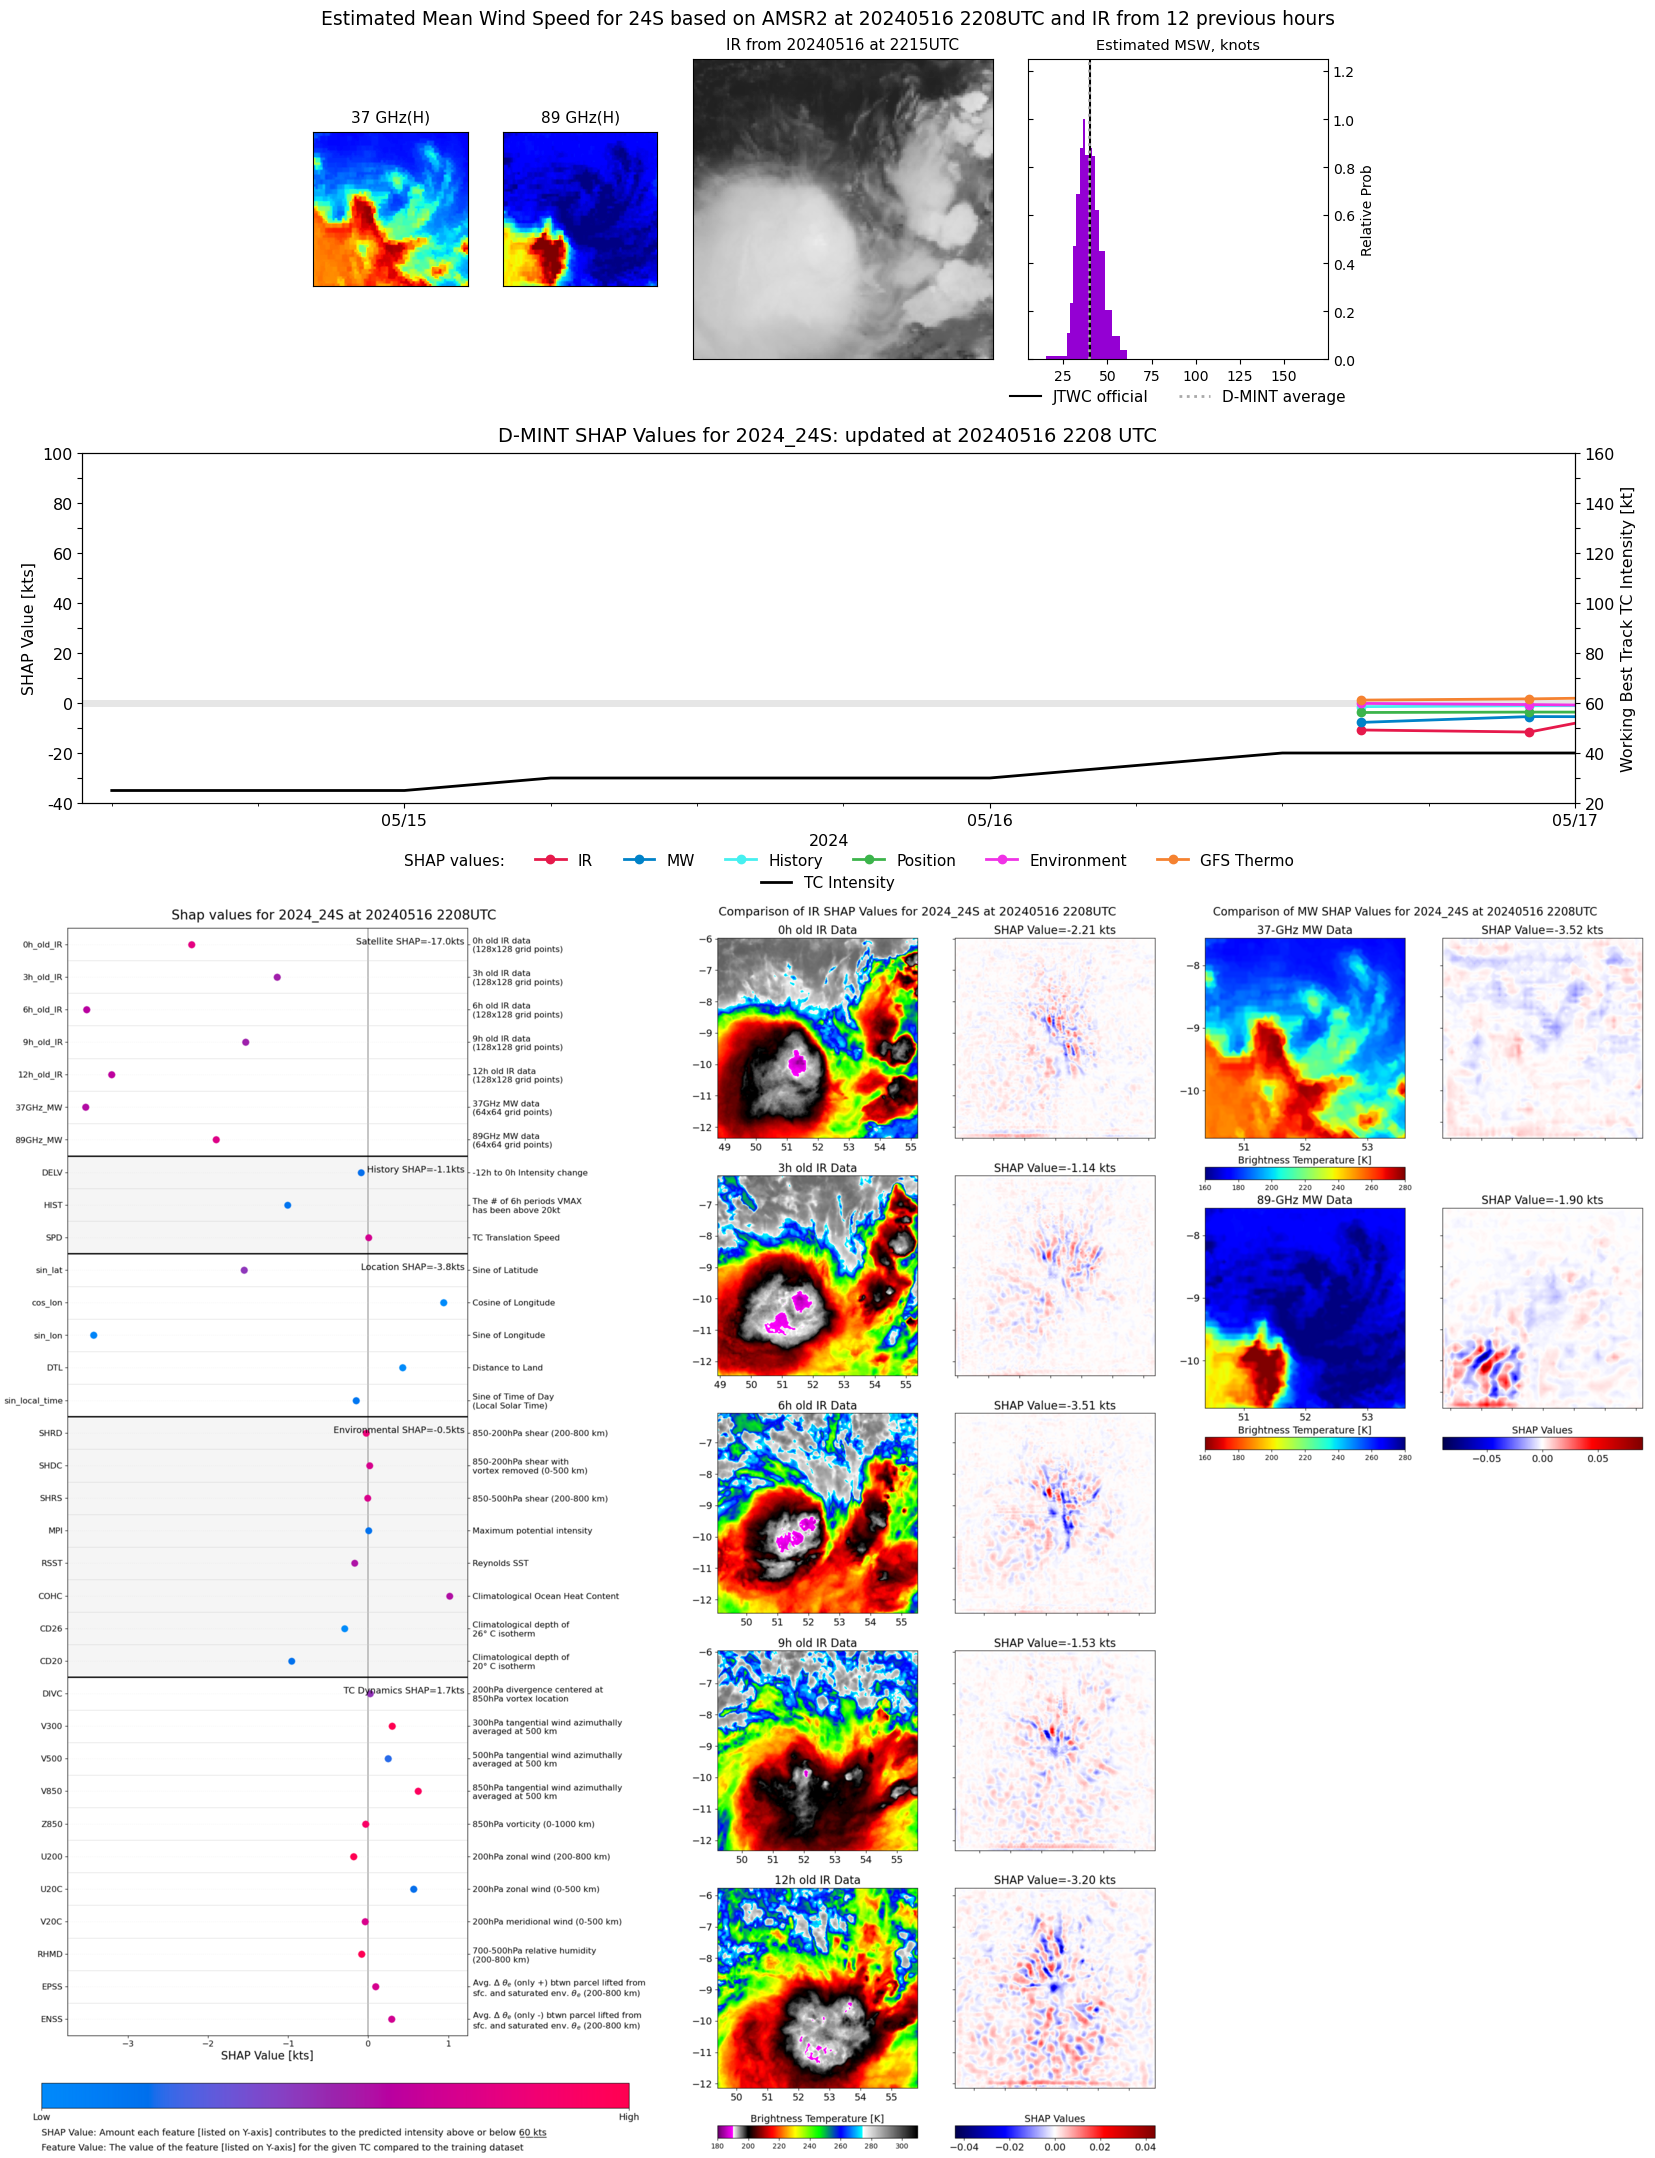 |
| 20240516 | 1513 UTC | SSMISF17 | 994 hPa | 37 kts | 33 kts | 42 kts |  |