|
||

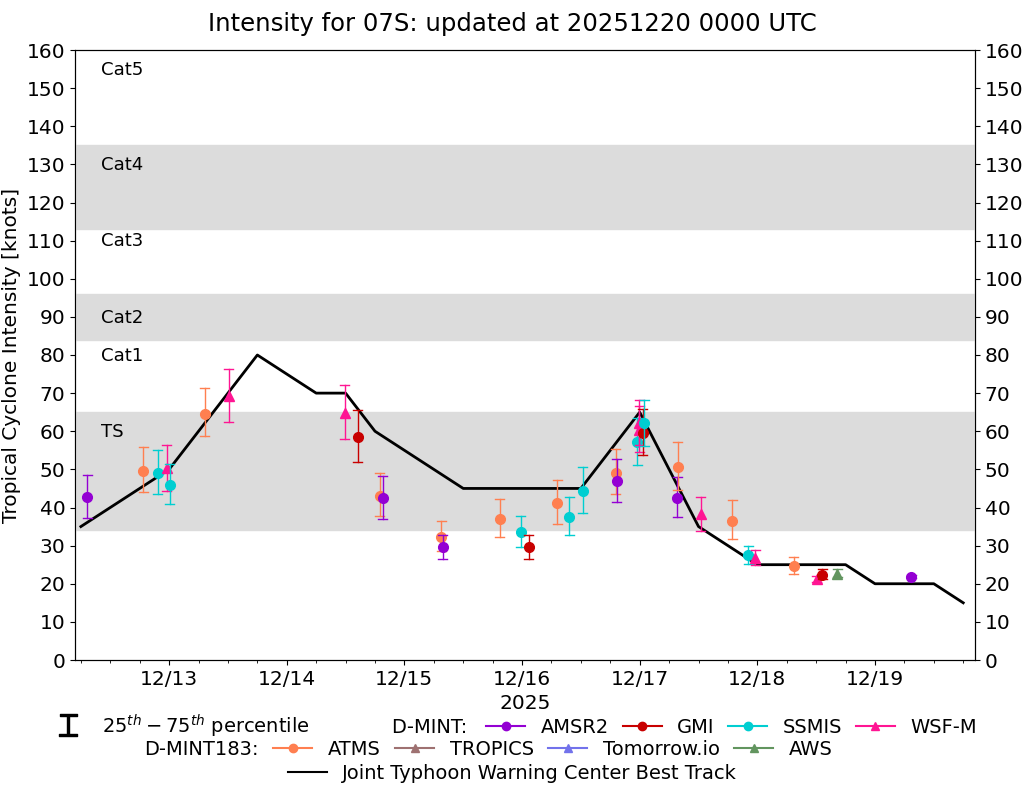 |
D-MINT HISTORY FILE for 2026_07S
| Date | Time | MW Sensor | MSLP | Vmax (30th-70th percentile average) | Vmax 25th percentile | Vmax 75th percentile | Image |
| 20251219 | 0726 UTC | AMSR2 | 1006 hPa | 22 kts | 21 kts | 22 kts |  |
| 20251218 | 1620 UTC | AWS | 1004 hPa | 23 kts | 22 kts | 24 kts |  |
| 20251218 | 1316 UTC | GMI | 1004 hPa | 22 kts | 21 kts | 24 kts |  |
| 20251218 | 1208 UTC | WSFM01 | 1006 hPa | 21 kts | 20 kts | 22 kts |  |
| 20251218 | 0725 UTC | ATMS-N21 | 1005 hPa | 25 kts | 23 kts | 27 kts |  |
| 20251217 | 2334 UTC | WSFM01 | 1005 hPa | 27 kts | 25 kts | 29 kts |  |
| 20251217 | 2211 UTC | SSMISF18 | 1004 hPa | 27 kts | 25 kts | 30 kts |  |
| 20251217 | 1851 UTC | ATMS-N21 | 999 hPa | 36 kts | 32 kts | 42 kts |  |
| 20251217 | 1229 UTC | WSFM01 | 996 hPa | 38 kts | 34 kts | 43 kts |  |
| 20251217 | 0744 UTC | ATMS-N21 | 984 hPa | 51 kts | 44 kts | 57 kts |  |
| 20251217 | 0737 UTC | AMSR2 | 993 hPa | 43 kts | 37 kts | 48 kts |  |
| 20251217 | 0056 UTC | SSMISF16 | 981 hPa | 62 kts | 56 kts | 68 kts |  |
| 20251217 | 0038 UTC | GMI | 978 hPa | 60 kts | 54 kts | 66 kts |  |
| 20251216 | 2354 UTC | WSFM01 | 978 hPa | 60 kts | 55 kts | 67 kts |  |
| 20251216 | 2354 UTC | WSFM01 | 980 hPa | 62 kts | 56 kts | 68 kts |  |
| 20251216 | 2329 UTC | SSMISF17 | 986 hPa | 57 kts | 51 kts | 64 kts |  |
| 20251216 | 1922 UTC | AMSR2 | 985 hPa | 47 kts | 41 kts | 53 kts |  |
| 20251216 | 1909 UTC | ATMS-N21 | 989 hPa | 49 kts | 44 kts | 55 kts |  |
| 20251216 | 1221 UTC | SSMISF17 | 991 hPa | 44 kts | 39 kts | 51 kts |  |
| 20251216 | 0935 UTC | SSMISF18 | 994 hPa | 38 kts | 33 kts | 43 kts |  |
| 20251216 | 0712 UTC | ATMS-N20 | 996 hPa | 41 kts | 36 kts | 47 kts |  |
| 20251216 | 0121 UTC | GMI | 999 hPa | 30 kts | 27 kts | 33 kts |  |
| 20251215 | 2343 UTC | SSMISF17 | 995 hPa | 33 kts | 30 kts | 38 kts |  |
| 20251215 | 1927 UTC | ATMS-N21 | 1000 hPa | 37 kts | 32 kts | 42 kts |  |
| 20251215 | 0750 UTC | AMSR2 | 999 hPa | 30 kts | 27 kts | 33 kts |  |
| 20251215 | 0731 UTC | ATMS-N20 | 999 hPa | 32 kts | 29 kts | 36 kts |  |
| 20251214 | 1934 UTC | AMSR2 | 986 hPa | 42 kts | 37 kts | 48 kts |  |
| 20251214 | 1857 UTC | ATMS-N20 | 991 hPa | 43 kts | 38 kts | 49 kts |  |
| 20251214 | 1429 UTC | GMI | 986 hPa | 59 kts | 52 kts | 66 kts |  |
| 20251214 | 1148 UTC | WSFM01 | 980 hPa | 65 kts | 58 kts | 72 kts |  |
| 20251213 | 1208 UTC | WSFM01 | NaN hPa | 69 kts | 62 kts | 76 kts |  |
| 20251213 | 0719 UTC | ATMS-N21 | 972 hPa | 64 kts | 59 kts | 71 kts |  |
| 20251213 | 0009 UTC | SSMISF16 | 986 hPa | 46 kts | 41 kts | 51 kts |  |
| 20251212 | 2332 UTC | WSFM01 | 987 hPa | 50 kts | 44 kts | 56 kts |  |
| 20251212 | 2139 UTC | SSMISF18 | 986 hPa | 49 kts | 43 kts | 55 kts |  |
| 20251212 | 1843 UTC | ATMS-N21 | 991 hPa | 50 kts | 44 kts | 56 kts |  |
| 20251212 | 0720 UTC | AMSR2 | NaN hPa | 43 kts | 37 kts | 49 kts |  |
| 20251211 | 1901 UTC | ATMS-N21 | 1003 hPa | 27 kts | 25 kts | 30 kts |  |
| 20251211 | 1108 UTC | WSFM01 | 1003 hPa | 27 kts | 24 kts | 31 kts |  |
| 20251209 | 2325 UTC | SSMISF17 | NaN hPa | 21 kts | 17 kts | 25 kts |  |
| 20251209 | 1914 UTC | AMSR2 | NaN hPa | 16 kts | 14 kts | 19 kts |  |
| 20251209 | 0934 UTC | SSMISF18 | NaN hPa | 16 kts | 13 kts | 19 kts |  |
| 20251209 | 0305 UTC | GMI | NaN hPa | 18 kts | 15 kts | 21 kts |  |
| 20251208 | 2340 UTC | SSMISF17 | NaN hPa | 16 kts | 15 kts | 18 kts |  |
| 20251208 | 1217 UTC | SSMISF16 | NaN hPa | 15 kts | 14 kts | 18 kts |  |