|
||

 |
D-MINT HISTORY FILE for 2026_10S
| Date | Time | MW Sensor | MSLP | Vmax (30th-70th percentile average) | Vmax 25th percentile | Vmax 75th percentile | Image |
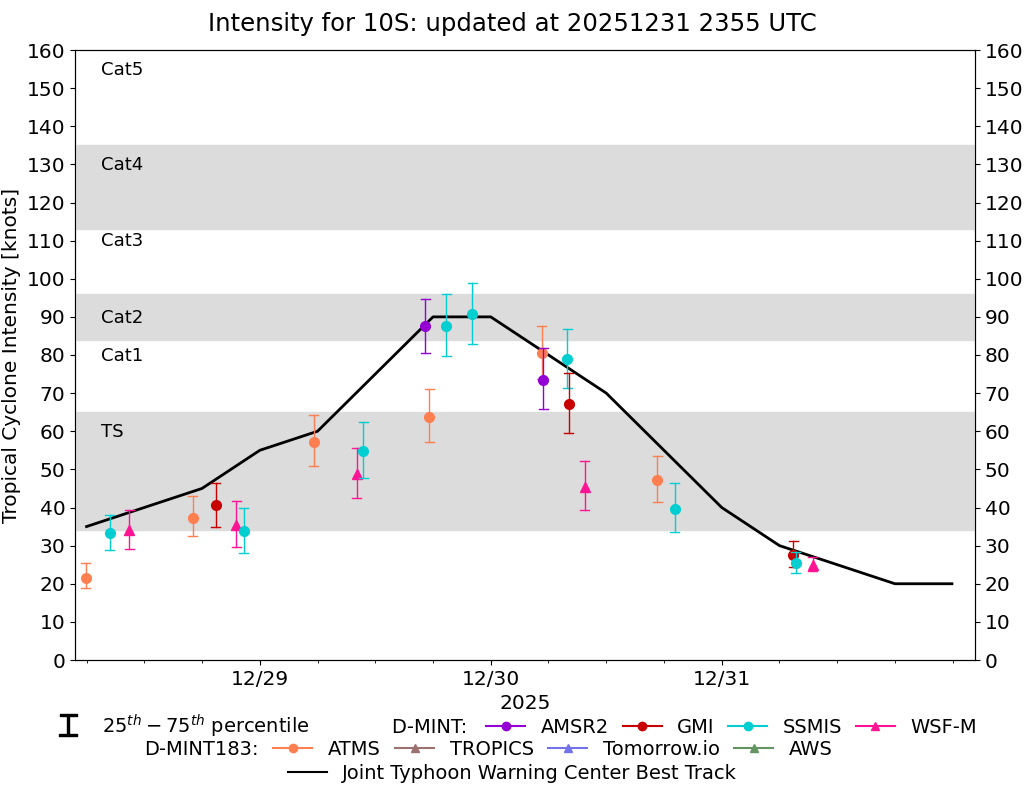
| 20260101 | 2121 UTC | SSMISF17 | 995 hPa | 29 kts | 26 kts | 33 kts |  |
| 20251231 | 0927 UTC | WSFM01 | 1001 hPa | 25 kts | 23 kts | 27 kts |  |
| 20251231 | 0926 UTC | WSFM01 | 1002 hPa | 26 kts | 24 kts | 29 kts |  |
| 20251231 | 0741 UTC | SSMISF18 | 998 hPa | 25 kts | 23 kts | 28 kts |  |
| 20251231 | 0725 UTC | GMI | 999 hPa | 28 kts | 24 kts | 31 kts |  |
| 20251230 | 1908 UTC | SSMISF18 | 988 hPa | 40 kts | 34 kts | 46 kts |  |
| 20251230 | 1717 UTC | ATMS-N20 | 991 hPa | 47 kts | 41 kts | 54 kts |  |
| 20251230 | 0946 UTC | WSFM01 | 981 hPa | 45 kts | 39 kts | 52 kts |  |
| 20251230 | 0807 UTC | GMI | 980 hPa | 67 kts | 60 kts | 75 kts |  |
| 20251230 | 0756 UTC | SSMISF18 | 971 hPa | 79 kts | 71 kts | 87 kts |  |
| 20251230 | 0526 UTC | AMSR2 | 969 hPa | 74 kts | 66 kts | 82 kts |  |
| 20251230 | 0517 UTC | ATMS-N21 | 973 hPa | 81 kts | 74 kts | 88 kts |  |
| 20251229 | 2205 UTC | SSMISF17 | 959 hPa | 91 kts | 83 kts | 99 kts |  |
| 20251229 | 1923 UTC | SSMISF18 | 971 hPa | 88 kts | 80 kts | 96 kts |  |
| 20251229 | 1735 UTC | ATMS-N20 | 978 hPa | 64 kts | 57 kts | 71 kts |  |
| 20251229 | 1713 UTC | AMSR2 | 966 hPa | 88 kts | 80 kts | 95 kts |  |
| 20251229 | 1046 UTC | SSMISF16 | 982 hPa | 55 kts | 48 kts | 62 kts |  |
| 20251229 | 1006 UTC | WSFM01 | 986 hPa | 49 kts | 43 kts | 55 kts |  |
| 20251229 | 0536 UTC | ATMS-N21 | 986 hPa | 57 kts | 51 kts | 64 kts |  |
| 20251228 | 2219 UTC | SSMISF17 | 989 hPa | 34 kts | 28 kts | 40 kts |  |
| 20251228 | 2134 UTC | WSFM01 | 994 hPa | 35 kts | 30 kts | 42 kts |  |
| 20251228 | 1926 UTC | GMI | 991 hPa | 41 kts | 35 kts | 47 kts |  |
| 20251228 | 1703 UTC | ATMS-N21 | 997 hPa | 37 kts | 33 kts | 43 kts |  |
| 20251228 | 1027 UTC | WSFM01 | 995 hPa | 34 kts | 29 kts | 39 kts |  |
| 20251228 | 0825 UTC | SSMISF18 | 994 hPa | 33 kts | 29 kts | 38 kts |  |
| 20251228 | 0555 UTC | ATMS-N21 | 999 hPa | 22 kts | 19 kts | 25 kts |  |
| 20251227 | 2153 UTC | WSFM01 | 1003 hPa | 23 kts | 20 kts | 26 kts |  |
| 20251227 | 1724 UTC | AMSR2 | NaN hPa | 21 kts | 18 kts | 24 kts |  |
| 20251227 | 0841 UTC | SSMISF18 | NaN hPa | 18 kts | 15 kts | 22 kts |  |
| 20251226 | 2237 UTC | SSMISF16 | NaN hPa | 16 kts | 14 kts | 18 kts |  |
| 20251226 | 2002 UTC | SSMISF18 | NaN hPa | 15 kts | 14 kts | 18 kts |  |
| 20251226 | 1129 UTC | SSMISF16 | NaN hPa | 16 kts | 14 kts | 18 kts |  |
| 20251226 | 0956 UTC | SSMISF17 | NaN hPa | 19 kts | 16 kts | 22 kts |  |
| 20251226 | 0919 UTC | GMI | NaN hPa | 16 kts | 14 kts | 19 kts |  |
| 20251226 | 0551 UTC | AMSR2 | NaN hPa | 16 kts | 14 kts | 18 kts |  |
| 20251225 | 1737 UTC | AMSR2 | NaN hPa | 16 kts | 15 kts | 19 kts |  |